

Abstract
Objectives
Vitamin D and serum lipid levels are risk factors for cardiovascular disease. We sought to determine if vitamin D (25OHD) interacts at established lipid loci potentially explaining additional variance in lipids.
Methods
1060 individuals from Utah families were used to screen 14 loci for SNPs potentially interacting with dietary 25OHD on lipid levels. Identified putative interactions were evaluated for 1) greater effect size in subsamples with winter measures, 2) replication in an independent sample, and 3) lack of gene-environment interaction for other correlated dietary factors. Maximum likelihood models were used to evaluate interactions. The replicate sample consisted of 2890 individuals from the Family Heart Study. Putative 25OHD receptor binding site modifying SNPs were identified and allele-specific, 25OHD-dependent APOA5 promoter activity examined using luciferase expression assays. An additional sample with serum 25OHD measures was analyzed.
Results
An rs3135506-25OHD interaction influencing HDL-C was identified. The rs3135506 minor allele was more strongly associated with low HDL-C in individuals with low winter dietary 25OHD in initial and replicate samples (p=0.0003 Utah, p=0.002 Family Heart); correlated dietary factors did not explain the interaction. SNP rs10750097 was identified as a putative causative polymorphism, was associated with 25OHD-dependent changes in APOA5 promoter activity in HEP3B and HEK293 cells (p<0.01), and showed similar interactions to rs3135506 in family cohorts. Linear interactions were not significant in samples with serum 25OHD measures; however, genotype-specific differences were seen at deficient 25OHD levels.
Conclusions
A 25OHD receptor binding site modifying APOA5 promoter polymorphism is associated with lower HDL-C in 25OHD deficient individuals.
Keywords: HDL CHOLESTEROL, TRIGLYCERIDE, VITAMIN D, APOLIPOPROTEIN A5, GENE-ENVIRONMENT INTERACTION, CARDIOVASCULAR DISEASE RISK, CAUSATIVE VARIANT
Introduction
Serum lipid levels are a major independent predictor of cardiovascular disease risk1. Ninety-six genetic loci have been associated with lipid levels in genome-wide association studies (GWAS); however, identified variants in aggregate explain less than 30% of heritability of individual lipid measures 2, 3.
Lipid levels are influenced by both genetic and environmental factors4. One nutrient hypothesized to influence serum lipids is vitamin D. Vitamin D is a fat soluble vitamin that is obtained by dietary intake or synthesized in the skin by UV radiation of 7-dehydrocholesterol. It is converted from the storage form, 25-hydroxy-vitamin D (25OHD), to the active form, 1,25-dihydroxy-vitamin D (1,25OHD), primarily by the kidneys. 1,25OHD activates a transcription factor, vitamin D receptor (VDR), with numerous binding sites throughout the genome5. As a fat soluble dietary transcription factor activator, it is feasible that 25OHD may influence in lipid metabolism. However, the nature of this effect is controversial, and numerous observational and interventional studies have been performed without consistent findings 6. Discrepancies between individual vitamin D studies may be due to variable experimental design, with possible explanations being differences due to seasonal changes in diet and sun exposure 7; differing effects of 25OHD, versus the active form, 1,25OHD; or vitamin D2 versus vitamin D3 8. Another source of discrepancies may be gene-environment interaction4.
We investigated the interaction of dietary 25OHD and 14 loci found to be strongly associated with HDLC, LDL-C, and triglyceride levels in GWAS studies 2, 3.
Methods
Study Samples
From 1980 to 1982, approximately 2500 subjects in 98 Utah pedigrees were recruited for a study of cardiovascular disease in Utah (Utah sample) by identifying probands with early stroke, coronary heart disease death, or hypertension 9. At a follow-up visit between 2004 and 2008 DNA was obtained for genetic studies and a dietary survey was administered 10. Lipid measures and genotyping were performed as described previously 11. Analyses were performed with self identified white individuals not taking lipid modifying medications for whom complete measures on lipids, genetic polymorphisms, and dietary surveys were available (n=1060 individuals with HDL-C, 1057 with triglycerides in 70 families, see Table 1 for sample characteristics). The winter subsample of the Utah Sample consisted of 362 individuals assessed November through March inclusive (see Table 1).
Table 1.
| N | age | sex | BMI | Vitamin D | HDL | LDL | Triglycerides | rs3135506 | rs10750097 | |||
|---|---|---|---|---|---|---|---|---|---|---|---|---|
| % | mean | mean(SD) | mean(SD) | mean(SD) | mean(SD) | |||||||
| Individuals | Families | mean(SD) | male | (SD) | IU | mg/dL | mg/dL | mg/dL | MAF | MAF | ||
| Total | 45.3 | 28.4 | 46.5 | 119.5 | ||||||||
| Utah | Sample | 1060 | 70 | (14.3) | 47.4 | (6.1) | 355 (287) | (12.0) | (28.6) | 132.6 (81.1) | 0.065 | 0.223 |
| Winter | 45.8 | 28.1 | 48.9 | 119.7 | ||||||||
| Sample | 362 | 41 | (14.7) | 49.2 | (5.8) | 354 (288) | (12.8) | (28.7) | 126.5 (74.4) | 0.061 | 0.232 | |
| Total | 51.5 | 27.7 | 49.5 | 124.3 | 150.8 | |||||||
| FamHS | Sample | 2890 | 505 | (13.7) | 46.4 | (5.5) | 269 (173) | (14.7) | (35.9) | (103.7) | 0.075 | 0.213 |
| Winter | 51.4 | 27.7 | 49.9 | 124.2 | 152.1 | |||||||
| Sample | 1006 | 316 | (13.6) | 50.1 | (5.5) | 268 (174) | (14.7) | (35.0) | (105.8) | 0.076 | 0.209 | |
| Individuals | ng/mL | |||||||||||
| Total | 64.3 | 28.6 | 40.7 | 104.8 | 190.4 | |||||||
| IHC | Sample | 1552 | (12.1) | 66.6 | (6.2) | 23.6 (6.2) | (13.1) | (36.7) | (179.7) | 0.216 | ||
| No | 62.9 | 28.9 | 42.2 | 107.0 | 183.2 | |||||||
| IHC | Medication | 744 | (12.5) | 62.9 | (6.5) | 23.7 (6.1) | (13.8) | (34.2) | (153.4) | 0.220 | ||
A replication cohort consisted of 5243 white individuals from the NHLBI Family Heart Study (FamHS sample) 12. These population-based families were examined at 4 clinical centers: Framingham, MA; Salt Lake City, UT; Minneapolis, MN; and Forsyth County, NC 13. Analyses were performed with self identified white individuals not taking lipid modifying medications for whom complete measures on lipids, genetic polymorphisms, and dietary surveys were available (n=2890 individuals in 504 families, see Table 1 for sample characteristics). The winter subsample of the FamHS consisted of 1006 individuals assessed November through March inclusive (see Table 1).
The semi-quantitative Willett food-frequency questionnaire used in both Utah and FamHS samples has well-documented reproducibility and validity 10. Both dietary and supplemental vitamin D reports were available in the Utah sample, but only total vitamin D intake was available in the FamHS sample.
A third cohort (Intermountain Healthcare sample) had data from total serum 25OHD, DNA, and other covariates available on 1526 subjects with HDL-C and 1552 with triglyceride levels and was derived from the Intermountain Healthcare ongoing Angiographic Registry and DNA Bank with samples obtained just prior to angiography 14. Lipid and 25OHD measurements were performed by the Intermountain Healthcare clinical laboratory using standard methods. Race/ethnicity was not included for analysis of this registry subgroup, but approximately 92% of samples in the entire registry are Caucasian. Individuals with serum 25OHD above 40 ng/ml were excluded, as this strongly suggests substantial supplementation 15. Pre-angiography medication records were not available; however, post-angiography discharge medication records identified 728 and 744 for HDL-C and triglyceride analysis, respectively, without post-angiography lipid modifying medications prescribed (see Table 1).
Laboratory Methods
SNP selection and genotyping
Genotype data was available for the Utah sample at 14 SNPs previously selected from the most significant, replicated loci in previous genome-wide association studies where successful assay probes could be developed as previously published 11. These SNPs were rs102275 (FADS1), rs10468017 (LIPC), rs1260326 (GCKR), rs17321515 (TRIB1), rs2228671 (LDLR), rs3135506 (APOA5), rs328 (LPL), rs3846662 (HMGCR), rs4420638 (APOC1), rs4939883 (LIPG), rs646776 (SORT1), rs6756629 (ABCG8), rs693 (APOB), and rs714052 (MLXIPL). SNPs were genotyped using real-time PCR melting curve analysis on a LightScanner instrument using SimpleProbes and genotyping reagents (Idaho Technology, Salt Lake City, Utah). Genotype calls were verified by 2 individuals with discrepant calls resolved by repeat genotyping. All SNPs were in Hardy-Weinberg equilibrium (p > 0.01).
Genotyping data from genome-wide studies using FamHS samples has been described previously with rs12272004 used as a tag for rs3135506 (r2 = 1.0) 16.
We genotyped rs10750097 in the Utah samples using real-time PCR melting curve analysis on a LightScanner instrument using SimpleProbes and genotyping reagents as described above. We genotyped rs10750097 in the Intermountain Healthcare sample using a Taqman assay.
Bioinformatic identification of SNPs modifying putative VDR binding sites
We used several data sources including published literature and public databases to identify SNPs in linkage disequilibrium with rs3135506 and CONSITE software to identify putative VDR binding sites within 40kb 5’ and 3’ of rs3135506 for both consensus and variant sequences 17, 18. We considered either r2 > 0.6 or D’ > 0.9 to indicate high linkage disequilibrium. Polymorphic sites where a predicted VDR site was present at TF score >65% for at least one variant and where the linked polymorphism improved the consensus match score by at least 1, indicating a change to a base that is at least 40% more common in consensus VDR binding sites, were considered likely candidates.
Molecular confirmation altered promoter activity in response to 1,25OHD
Renilla luciferase reporter vectors were produced by inserting 1 kb (GRCh37/hg19:chr11:116,663,024-116,664,075 reverse strand) of promoter sequence of the human APOA5 gene containing the predicted VDR site (GenScript) into the pGL4.70 vector (Promega) upstream of the Renilla luciferase reporter gene. Site directed mutagenesis was used to change the rs10750097 ‘C’ base to ‘T’ to obtain a vector that only differed at this site. These reporter vectors were co-transfected with a firefly luciferase-expressing control vector, pGL4.10 (Promega), into HEP3B hepatoma or HEK293 kidney cells using lipofectamine 2000 (InVitrogen). After transfection, we incubated cells in MEM+10% FBS for 16–24 hours then supplemented cell lines with varying concentrations of 1,25-dihydroxyvitamin D3 (1,25OHD)(EMD Chemicals) dissolved in DMSO as described previously 19. After 24 hours of incubation with differing amounts of 1,25OHD, cells were lysed and relative light units measured using a Veritas Luminometer (Turner Biosystems) by injection of the Dual Luciferase Reporter Assay reagents (Promega). Renilla luciferase activity was normalized to firefly luciferase activity to control for transfection efficiency. Renilla luciferase activity was determined relative to the reporter gene expression seen in the absence of 1,25OHD. The averages and standard deviations were derived from 2 independent experiments with at least 8 wells for each experimental condition. T-tests were used to evaluate significance of differences in expression.
Statistical Methods
Interaction analysis: Discovery
An initial screen with the Utah sample using simple linear regression and additive genetic models while correcting for age, sex, and BMI but not family structure was used to identify potential 25OHD interactions with selected SNPs 11. For all statistical analyses, natural log transformations of HDL-C, LDL-C, triglycerides, and dietary variables were used. Interactions found to be nominally significant at a p<0.05 level were further analyzed. We chose this low cutoff to avoid type-II error in the discovery phase. We performed 42 analyses (14 SNP × 3 lipid measures). Although screening linear regression is ideal for rapidly comparing and visualizing estimates of linear effects, since both genetic and environmental factors are correlated within families, potentially introducing bias in beta-coefficient and significance measures, we sought a maximum likelihood tool that could correct for family structure to obtain unbiased significance estimates. We employed jPAP software with additive genetic models for maximum likelihood analysis while correcting for age, sex, BMI, and family structure to verify that any screened associations were not due to family structure and to generate more accurate p-values20.
Interaction analysis: Replication and Hypothesis Testing
To differentiate true 25OHD interactions from false positives identified in the discovery phase, we tested several hypotheses: 1) The absolute size of interaction effects will be greater in subsamples with winter 25OHD and lipid measures because serum 25OHD levels are lowest and correlation with survey dietary 25OHD intake is highest when the contribution from sun exposure is lowest 21. 2) Interactions will be replicated in an independent sample. 3) The interaction effects will not be accounted for by other dietary factors.
To test the first hypothesis we subdivided the Utah sample by the season of clinic visit, as both diet and lipids were measured at the same clinic visit. We compared the interaction effect size coefficient predicted from maximum likelihood analysis described above in the entire sample with the effect size from identical analysis of the winter subsample. The size of this coefficient in maximum likelihood analysis is analogous to the beta-coefficient in linear regression. We considered larger absolute interaction effect size in the winter subsample to be consistent with 25OHD interaction, and a smaller absolute interaction effect size in the winter subsample to be inconsistent with 25OHD interaction.
To test the second hypothesis we employed jPAP software with additive genetic models for maximum likelihood analysis of the entire FamHS sample while correcting for age, sex, BMI, family structure, and study center 20. We considered findings with interaction p < 0.05 and with the same direction of interaction effect to indicate significant improvement in maximum likelihood analysis and replication of initial findings. We also subdivided this sample by season to evaluate the first hypothesis in the FamHS sample.
To test the third hypothesis ruling out interactions with other dietary measures highly correlated with dietary 25OHD, we evaluated each dietary variable correlated with 25OHD at r2 > 0.8. Using the combined Utah and FamHS samples we evaluated models with each 25OHD correlated variable and its interaction with the genetic variant comparing them to models with and without the gene-25OHD interaction. We expected adding gene-25OHD interaction to models that already included correlated dietary covariate interactions would significantly improve the models at p < 0.05 if the 25OHD was the main driver of the interaction, and conversely the gene-dietary covariate interactions would not significantly improve models already containing gene-25OHD interaction terms.
Interaction analysis: Exploratory
Associations with related variables
As HDL and triglycerides are inversely correlated and APOA5 is known to influence primarily triglycerides, we used jPAP maximum likelihood analysis to evaluate 25OHD interactions with triglycerides in both family samples and winter subsamples.
Confirmation of rs10750097 interaction in family based samples
Three SNPS: rs12272004, rs651821, and rs9804646 perfectly predicted rs10750097 in 1000 genomes data and were used to impute rs10750097 in the FamHS sample 22. This reduced the FamHS sample size to 2123 individuals for rs10750097 analyses, as a smaller number of genotypes were available for all predictor SNPs. With a combined family based sample, we used jPAP software with additive genetic models for maximum likelihood analysis to evaluate rs10750097 interactions in all year and winter-only samples as described above.
Evaluation of Intermountain Healthcare Sample (IHC sample) with serum 25OHD
The IHC sample had measures of serum 25OHD, as opposed to the measures of dietary 25OHD, available in previous samples; we used this to evaluate the interaction in a sample with a different 25OHD measure. We determined that we would have over 80% power to detect a linear interaction effect similar to that seen in the winter-subsamples in the combined sample if serum 25OHD and dietary 25OHD similarly measure underlying biological states, if differences in population demographics do not influence the interaction, and if there was little between sample heterogeneity due to medication status. We would have near 80% power to detect linear interactions in the unmedicated subsample if there was substantial heterogeneity, and the other assumptions listed above were true. We used multiple linear regression in the entire IHC sample and unmedicated subsample to test for linear rs10750097-serum-25OHD interaction while correcting for age, sex, and BMI. We also divided the IHC, Utah, and FamHS samples into either serum 25OHD or dietary 25OHD quintiles to better visualize and compare genotype specific trends in HDL-C and triglycerides for all three samples.
Results
Interaction analysis: Discovery
We screened 14 SNPs at loci that are known to influence HDL-C, LDL-C, or triglyceride levels for potential gene-25OHD interactions in lipid levels in a Utah based family sample. There were 1060 individuals with all appropriate measures in this sample, these individuals had a mean age of 45 and were 47% male (see Table 1). The mean daily dietary 25OHD intake was 355 IU. Although approximately 43% of the Utah samples received some 25OHD in the form of multivitamins, specific supplementation of 25OHD was rare with <1% of the population taking over 1000 IU 25OHD.
Only rs3135506 in APOA5 at the APOA1-APOC3-APOA4-APOA5 locus showed potential 25OHD interaction with HDL-C in the Utah study (Figure 1a, supplemental Table 1). The interaction of 25OHD and rs3135506 significantly improved the model prediction for HDL-C in the Utah sample using maximum likelihood models to correct for age, sex, BMI, and family structure (p = 0.005, Table 2).
Figure 1.
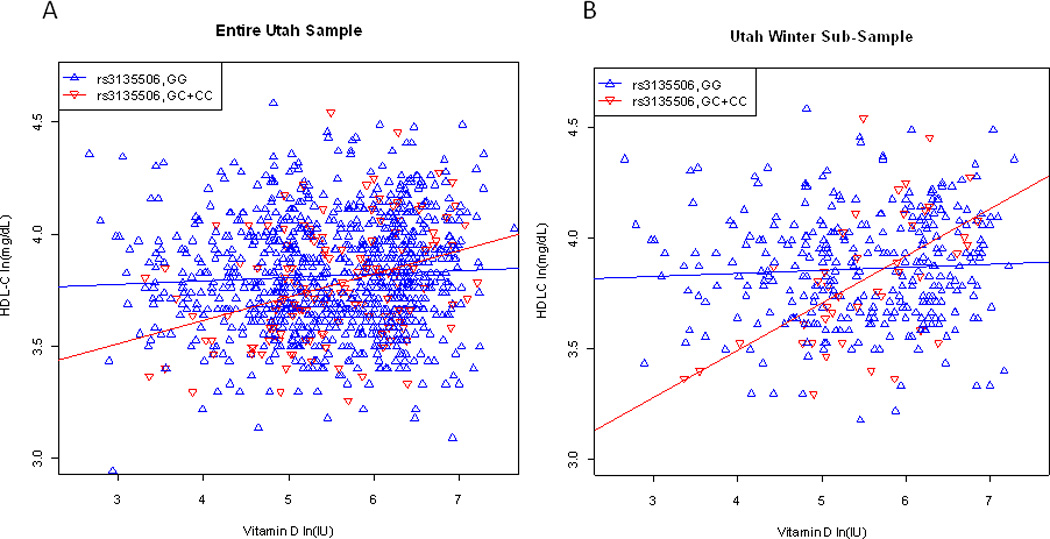
Linear models of rs3135506-dietary 25OHD interaction in HDL-C in the Utah Sample. Red and blue lines show genotype specific trends in HDL-C by dietary intake. GC and CC carriers are combined for this figure due to the small number of CC carriers. (A) Entire Utah Sample. (B) Linear model of Utah Winter Sub-Sample illustrating greater difference in slope between genotypes.
Table 2.
Maximum Likelihood Models rs3135506 (rs12272004 in FHS) and HDL
| Model components | Utah (N=1060, 70)* | FHS (N=2889, 505)* | combined (N = 3949, 575)* | |||
|---|---|---|---|---|---|---|
| -2 ln likelihood |
p value for difference | -2 ln likelihood |
p value for difference | -2 ln likelihood |
p value for difference | |
| baseline covariates ** | −340.66 | −222.42 | −519.28 | |||
| baseline covariates **, Vitamin D | −343.58 | 0.09 | −222.67 | 0.62 | −519.43 | 0.7 |
| baseline covariates **, Vitamin D, rs3135506 | −346.2 | 0.11 | −236 | 0.0003 | −534.26 | 0.0001 |
| baseline covariates **, Vitamin D, rs3135506, interaction of Vitamin D and rs3135506 | −354.27 | 0.005 | −238.84 | 0.09 | −542.03 | 0.005 |
| Model components | Utah winter only (N=362, 41)* | FHS winter only (N= 1006, 316)* | combined winter only (N= 1368, 357)* | |||
| -2 ln likelihood |
p value for difference | -2 ln likelihood |
p value for difference | -2 ln likelihood |
p value for difference | |
| baseline covariates ** | −129.54 | −41.71 | −156.28 | |||
| baseline covariates **, Vitamin D | −136.42 | 0.009 | −41.99 | 0.6 | −157.31 | 0.31 |
| baseline covariates **, Vitamin D, rs3135506 | −140.84 | 0.04 | −46.72 | 0.03 | −165.44 | 0.004 |
| baseline covariates **, Vitamin D, rs3135506, interaction of Vitamin D and rs3135506 | −153.55 | 0.0004 | −56.34 | 0.002 | −181.39 | 0.00007 |
N = number of individuals, number of families
baseline covariates are age, BMI, and sex in aging study with study site added for FHS and combined samples
Interaction analysis: Replication and Hypothesis Testing
To differentiate true 25OHD interactions from false positives potentially identified in the discovery phase, we tested several hypotheses: 1) The absolute size of interaction effects will be greater in subsamples with winter 25OHD and lipid measures when serum 25OHD levels are lowest due to low sun exposure and correlation of serum 25OHD and dietary survey 25OHD is highest21. 2) Interactions will be replicated in an independent sample. 3) The interaction effects will not be accounted for by other dietary factors.
In the Utah winter subsample, which consisted of 362 individuals in 41 families and had demographic characteristics similar to the entire Utah sample (see Table 1), the 25OHD-rs3135506 interaction effect was more significant than in the entire sample (p = 0.0004, see Table 2). The interaction effect size in the winter was 0.14 compared to 0.06 in the entire sample (see Figure 1). The size of this coefficient in maximum likelihood analysis is analogous to the beta-coefficient in linear regression, and the interaction effect is best conceptualized as the difference in the slopes between genotype specific regression lines (i.e., the difference in slopes in Figure 1A is smaller than the difference in slopes in Figure 1B).
The FamHS sample consisted of 2890 individuals in 505 families. The mean age was about six years older (52) than the mean age in the Utah sample; the gender distribution was similar, and average reported daily dietary vitamin D was somewhat less (269 IU per day) with < 1% of the sample reporting greater than 1000 IU daily 25OHD intake. In the entire FamHS sample the interaction of dietary 25OHD and rs12272004, a marker in complete linkage disequilibrium with rs3135506, did not significantly improve the maximum likelihood model of HDL-C (p = 0.09)(Table 2), although the direction of interaction trend was the same as that seen in the Utah sample. In the FamHS winter subsample the dietary 25OHD-rs12272004 interaction was significant (p = 0.002) and the interaction effect size was greater in the winter subsample than in the entire sample (0.09 compared to 0.03)(supplemental Figure 1).
Dietary 25OHD was highly correlated with calcium, phosphorus, vitamin B2, and lactose intake (r2 ≥ 0.8). There was no significant interaction of rs3135506 with calcium, phosphorus, vitamin B2, or lactose that influenced HDL-C in the combined FamHS and Utah sample. The rs3135506-25OHD interaction influencing HDL-C remained significant at p<0.05 even while correcting for each of these gene-correlated dietary measure interactions independently.
Interaction analysis: Exploratory
In order to better understand the nature of the putative gene-25OHD interaction at the APOA5 locus we performed several exploratory analyses. We evaluated interactions in triglyceride levels, as HDL-C and triglyceride levels are inversely related and main genetic effects of the APOA5 locus appear to be related primarily to triglycerides. We used bioinformatics to identify putative vitamin D receptor binding sites and transient transfection of tissue cultured cells to determine if genetic variation potentially changes vitamin D dependent APOA5 promoter activity. We also investigated the interaction in a clinical sample that had serum 25OHD measures available, as opposed to the dietary 25OHD measures that were available in the initial and replicate samples.
Effect of dietary 25OHD interaction with APOA5 SNPs on triglycerides levels
Gene-25OHD interactions did not significantly improve triglyceride models in the entire Utah or FamHS samples (see supplemental Table 1). In the winter FamHS subsample, the rs12272004 25OHD contributed significantly to triglyceride models (p = 0.0009). Trends were similar in the Utah sample although interaction effects on triglycerides were not significant.
Bioinformatic identification and molecular confirmation of putative VDR binding site modifying SNP
SNP rs10750097, 1kb 5’ of the APOA5 promoter, predicted a 25OHD responsive allele, increasing the CONSITE score of the VDR binding site by a score of 1.2. Linkage disequilibrium was significant in 1000 genomes CEU samples between rs10750097 and rs3135506 (r2=0.22, D’=1.0) and rs964184 (r2=0.45, D’=0.72), the SNP most commonly reported for this locus in GWAS studies. Suggesting rs10750097 is a likely causative polymorphism.
Molecular confirmation altered promoter activity in response to 1,25OHD
APOA5 promoter driven expression of a Renilla reporter gene was consistently higher for the rs10750097 ‘C’ than for the rs10750097 ‘T’ allele when the culture media was supplemented with 1,25OHD (Figure 2). This difference was significant for both HEP3B and HEK293 cell lines at multiple concentrations of 1,25OHD with a 1.2 to 1.5 fold increase in expression at these 50–100 nm concentrations (Figure 2). Expression of the ‘T’ allele vector decreased with increasing 1,25OHD in HEP3B cells, presumably due to 1,25OHD related inhibition of cell growth in hepatoma cell lines23.
Figure 2.
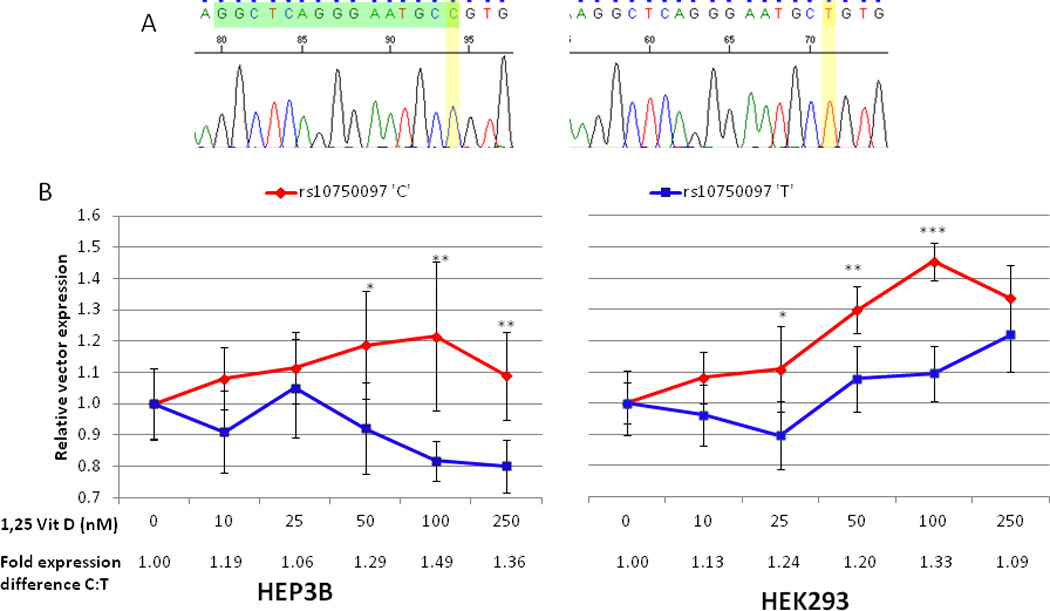
In vitro studies of 25OHD and ApoA5 promoter variants. (A) Sequencing chromatograms from vector constructs illustrating site-directed mutagenesis genotype change corresponding to rs10750097 modification with putative 25OHD receptor binding site highlighted in green. (B) Changes in relative vector expression in HEP3B and HEK293 cell lines with varying levels of 1,25 dihydroxyvitamin D3. * p < 0.05 for difference, ** p < 0.01 for difference, *** p < 0.001 for difference
Confirmation of rs10750097 interaction in combined samples
In combined samples, LD between rs3135506 and rs10750097 was similar to that seen in public databases (r2 = 0.25, D’ = 1.0). 25OHD-rs10750097 interactions in HDL-C and triglyceride levels were significant (p = 0.0007 and p = 0.04 respectively, see supplemental Table 3). The winter subsample of the combined family sample showed significant interaction effects with greater effect sizes (0.055 in winter compared to 0.028 for HDL-C and −0.068 in winter compared to −0.038 for triglycerides, see supplemental Table 4). The absolute value of the size of the interaction effect in the HDL-C model was larger than the effect of the rs10750097 SNP only (0.028 for interaction, 0.018 for rs10750097) suggesting that the additional variance attributable to the interaction effect may be greater than the variance attributable to the genetic polymorphism alone.
Evaluation of IHC sample with serum 25OHD levels
The mean age in the IHC sample was 64, 19 years older than the initial Utah sample, and this sample was approximately two thirds male. Average serum 25OHD was 23.6 ng/mL (see Table 1). There was no substantial heterogeneity between the entire IHC sample and the sample with no medications prescribed. In the IHC sample, the interaction of serum 25OHD and rs10750097 was not significant in linear modeling of HDL-C or triglyceride levels in either the entire IHC sample (p=0.60 and 0.76 respectively for rs10750097) or the subsample without discharge medications (p=0.88 and 0.66 respectively for rs10750097). Lower 25OHD levels tended to show larger genotype-specific differences in HDL-C for rs10750097 heterozygotes in IHC and family samples, although inference is complicated by low numbers of rare homozygotes at very low 25OHD levels (Figure 3A and 3B).
Figure 3.
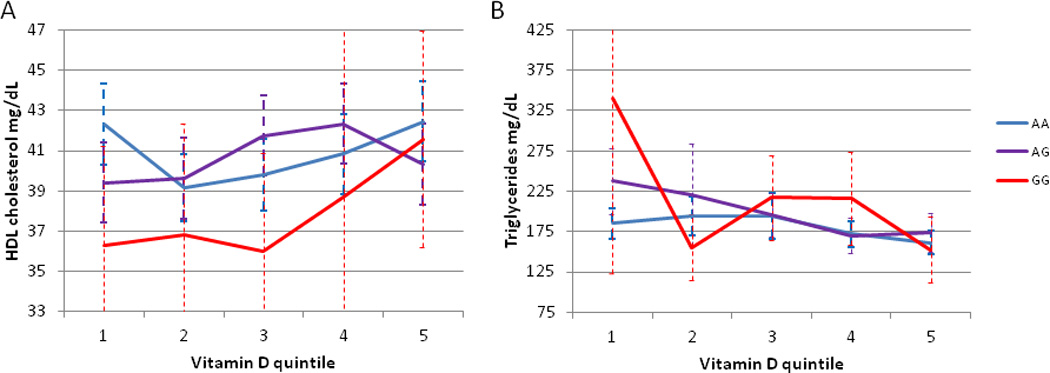
Lipid levels by rs10750097 genotype and serum 25OHD quintile in the IHC sample. (A) HDL levels. (B) Triglyceride levels. Error bars show 95% confidence intervals.
Discussion
We observed an interaction between dietary 25OHD and rs3135506 in the APOA1-APOC3-APOA4-APOA5 locus that influences HDL-C and possibly triglyceride levels. Although the initial statistical interaction would not have held up to strict correction for multiple comparisons, we chose to use a hypothesis driven approach based on the known epidemiology of 25OHD to determine if this putative interaction was likely to be a true interaction or a false positive. We hypothesized that: 1) A true gene-dietary 25OHD interaction will be stronger in winter, either due to higher correlation of serum and dietary 25OHD or due to higher prevalence of 25OHD deficiency; 2) The interaction will replicate in an independent sample; and 3) Other dietary factors correlated with 25OHD will not explain the interaction effects. Our data supports the first and third hypotheses, and partially supports the second hypothesis as the interaction effect was not significant in the entire replicate sample, but was significant in the winter subsample of the replicate sample, which in retrospect might have been the preferred replicate sample.
In exploratory analysis, 25OHD interactions with triglycerides were also significant in one sample, but trends were more variable from sample to sample. The reciprocal relationship between HDL-C and triglyceride levels has been well described, and our data does not discriminate which of these may be the primary actor in this case; it is possible that we observed more consistent interactions with HDL-C by chance because there is less population variance in HDL-C levels than in triglyceride levels. This observation should be taken in the context of growing evidence that the role of HDL-C in cardiovascular disease may not be causal, but may be due to the inverse relationship with triglycerides 24, 25. Recent reports indicate treatments that specifically increase HDL-C do not improve cardiovascular endpoints 26. This does not diminish the potential for clinical implications of gene-25OHD interactions as the underlying molecular mechanisms may influence underlying cardiovascular disease mediators as well as HDL-C.
Further exploratory analysis identified rs10750097 as a plausible causative polymorphism, the minor allele of which creates a putative VDR binding site that increases APOA5 promoter activity in cultured cells, supporting a functional role that needs to be investigated further. Although the interaction effect was slightly stronger for rs10750097 than for rs3135506, it was not as much stronger as we expected from our functional studies. We cannot rule out the possibility of other VDR binding modifying polymorphisms or haplotype effects caused by other interaction modifying polymorphisms at this locus. Electrophoretic mobility shift or chromatin immunoprecipitation will be necessary to conclusively establish the effect of rs1050097 on VDR binding.
The APOA1-APOC3-APOA4-APOA5 locus is one of the most significant loci in GWAS associated with triglyceride, HDL-C, and total cholesterol levels 2. There is linkage disequilibrium throughout the locus; however, the haplotype block containing all SNPs discussed in this paper extends from 8 kb 5’ to 70 kb 3’ of APOA5. This haplotype block does not include APOA1, APOC3, or APOA4, but may contain regulatory elements that influence expression of these genes18. Despite established genetic associations and good understanding of the basic biology of apolipoproteins, the identity and biologic mechanisms of specific polymorphisms responsible for genetic associations at this locus have not been clearly defined27. Proteins coded by genes at this locus play diverse roles in lipid transport, inflammation, immunity, thrombosis, redox balance and perhaps even satiety; genes include apolipoprotein A1, the major structural component of HDL particles and apolipoprotein A5, which is believed to play a role in triglyceride metabolism 25, 28. There is evidence that multiple polymorphisms within the locus influence lipid levels and that there may be within locus gene-gene interaction 29, 30. Our findings of an additional gene-environment interaction add to the complexity of this locus in the regulation of lipid metabolism.
Though 25OHD is a fat soluble vitamin, it is unlikely that the 25OHD interaction described here is secondary to the previously identified rs662799 APOA5-dietary fat-interaction, as correlation between rs662799 and rs3135506 is low 31. Our identification of an additional gene-diet interaction at APOA5 suggests that gene-diet interactions may be common, several, and identifiable in current well-characterized research samples. Gene-environment interactions such as these may contribute to the “missing” heritability in lipid measures, as human heritability calculations do not disentangle interaction from pure genetic effects 32. The amount of variance attributable to the gene-vitamin D interaction appears similar and perhaps larger than the amount of variance attributable to the genetic effect alone increasing the total amount of variance attributable to the locus. This can be seen comparing effect sizes of the genetic effect with those of the gene-environment interaction (see supplemental Table 4).
A weakness of our study that tempers our enthusiasm about our conclusions is that significant linear trends were not present in all samples. There are substantial limitations in comparing samples with serum and dietary 25OHD samples due to differences in measures. Whereas survey dietary 25OHD is a measure of intake, serum 25OHD is influenced by dietary intake, sun exposure, body stores, utilization, and excretion. In addition, differences in populations, scales, and cutoffs may explain the failure to detect a significant interaction in the IHC sample. Although the IHC sample was adequately powered to detect linear interactions similar to the larger effects seen in the winter subsamples, it was less well powered to detect interactions similar to those seen in the entire sample. The IHC sample showed HDLC and triglyceride differences at the lowest levels of 25OHD similar to those seen in Utah and FamHS samples, suggesting interactions may be non-linear (see Figure 3 and supplemental Figure 2). This suggests that interactions were stronger in winter subsamples primarily because seasonal selection enriches for 25OHD deficiency. There was no enrichment for 25OHD deficiency in the IHC sample. It is encouraging that a similar trend of lower HDL-C in rs10750097 ’C’ carriers at deficient levels of 25OHD was seen in the IHC sample. Surprisingly, in FamHS and IHC samples there is a slight decrease in HDL-C at the highest levels of 25OHD in rs10750097 ’C’ carriers (see Figure 3 and supplemental Figure 2). While our study was not initially designed to evaluate non-linear interactions, these observations should aid in the design of additional replication studies and may inform future investigations of gene-25OHD interactions in other traits.
Additional replication studies and prospective clinical studies will be necessary confirm these findings and determine if interaction effects are correlated with cardiovascular endpoints.
Highlights.
A 25OHD receptor binding site modifying APOA5 promoter polymorphism was associated with lower HDL-C in 25OHD deficient individuals.
Stronger interactions in subsamples evaluated in winter months suggest effects may be meaningful only at deficient levels of vitamin D.
Gene-environment interactions with modifiable environmental components suggest potential strategies to improve cardiovascular risk.
Supplementary Material
Acknowledgements
The authors would like to thank Christine Anderson for her assistance with cell culture. This research was supported by grants HL21088, HL24855, HL44738, AG18734, HL67894 to SCH, a Deseret Foundation grant DF#557 to JFC and Brent Muhlestein, and a University of Utah Pathology Department Young Investigator Grant to BHS.
Research was conducted under University of Utah IRB 00012096 and Intermountain Healthcare IRB RMS#1008366.
Footnotes
Publisher's Disclaimer: This is a PDF file of an unedited manuscript that has been accepted for publication. As a service to our customers we are providing this early version of the manuscript. The manuscript will undergo copyediting, typesetting, and review of the resulting proof before it is published in its final citable form. Please note that during the production process errors may be discovered which could affect the content, and all legal disclaimers that apply to the journal pertain.
References
- 1.Lewington S, Whitlock G, Clarke R, Sherliker P, Emberson J, Halsey J, Qizilbash N, Peto R, Collins R. Blood cholesterol and vascular mortality by age, sex, and blood pressure: a meta-analysis of individual data from 61 prospective studies with 55,000 vascular deaths. Lancet. 2007;370:1829–1839. doi: 10.1016/S0140-6736(07)61778-4. [DOI] [PubMed] [Google Scholar]
- 2.Teslovich TM, Musunuru K, Smith AV, Edmondson AC, Stylianou IM, Koseki M, Pirruccello JP, Ripatti S, Chasman DI, Willer CJ, Johansen CT, Fouchier SW, Isaacs A, Peloso GM, Barbalic M, Ricketts SL, Bis JC, Aulchenko YS, Thorleifsson G, Feitosa MF, Chambers J, Orho-Melander M, Melander O, Johnson T, Li X, Guo X, Li M, Shin Cho Y, Jin Go M, Jin Kim Y, Lee JY, Park T, Kim K, Sim X, Twee-Hee Ong R, Croteau-Chonka DC, Lange LA, Smith JD, Song K, Hua Zhao J, Yuan X, Luan J, Lamina C, Ziegler A, Zhang W, Zee RY, Wright AF, Witteman JC, Wilson JF, Willemsen G, Wichmann HE, Whitfield JB, Waterworth DM, Wareham NJ, Waeber G, Vollenweider P, Voight BF, Vitart V, Uitterlinden AG, Uda M, Tuomilehto J, Thompson JR, Tanaka T, Surakka I, Stringham HM, Spector TD, Soranzo N, Smit JH, Sinisalo J, Silander K, Sijbrands EJ, Scuteri A, Scott J, Schlessinger D, Sanna S, Salomaa V, Saharinen J, Sabatti C, Ruokonen A, Rudan I, Rose LM, Roberts R, Rieder M, Psaty BM, Pramstaller PP, Pichler I, Perola M, Penninx BW, Pedersen NL, Pattaro C, Parker AN, Pare G, Oostra BA, O'Donnell CJ, Nieminen MS, Nickerson DA, Montgomery GW, Meitinger T, McPherson R, McCarthy MI, McArdle W, Masson D, Martin NG, Marroni F, Mangino M, Magnusson PK, Lucas G, Luben R, Loos RJ, Lokki ML, Lettre G, Langenberg C, Launer LJ, Lakatta EG, Laaksonen R, Kyvik KO, Kronenberg F, Konig IR, Khaw KT, Kaprio J, Kaplan LM, Johansson A, Jarvelin MR, Janssens AC, Ingelsson E, Igl W, Kees Hovingh G, Hottenga JJ, Hofman A, Hicks AA, Hengstenberg C, Heid IM, Hayward C, Havulinna AS, Hastie ND, Harris TB, Haritunians T, Hall AS, Gyllensten U, Guiducci C, Groop LC, Gonzalez E, Gieger C, Freimer NB, Ferrucci L, Erdmann J, Elliott P, Ejebe KG, Doring A, Dominiczak AF, Demissie S, Deloukas P, de Geus EJ, de Faire U, Crawford G, Collins FS, Chen YD, Caulfield MJ, Campbell H, Burtt NP, Bonnycastle LL, Boomsma DI, Boekholdt SM, Bergman RN, Barroso I, Bandinelli S, Ballantyne CM, Assimes TL, Quertermous T, Altshuler D, Seielstad M, Wong TY, Tai ES, Feranil AB, Kuzawa CW, Adair LS, Taylor HA, Jr, Borecki IB, Gabriel SB, Wilson JG, Holm H, Thorsteinsdottir U, Gudnason V, Krauss RM, Mohlke KL, Ordovas JM, Munroe PB, Kooner JS, Tall AR, Hegele RA, Kastelein JJ, Schadt EE, Rotter JI, Boerwinkle E, Strachan DP, Mooser V, Stefansson K, Reilly MP, Samani NJ, Schunkert H, Cupples LA, Sandhu MS, Ridker PM, Rader DJ, van Duijn CM, Peltonen L, Abecasis GR, Boehnke M, Kathiresan S. Biological, clinical and population relevance of 95 loci for blood lipids. Nature. 2010;466:707–713. doi: 10.1038/nature09270. [DOI] [PMC free article] [PubMed] [Google Scholar]
- 3.Waterworth DM, Ricketts SL, Song K, Chen L, Zhao JH, Ripatti S, Aulchenko YS, Zhang W, Yuan X, Lim N, Luan J, Ashford S, Wheeler E, Young EH, Hadley D, Thompson JR, Braund PS, Johnson T, Struchalin M, Surakka I, Luben R, Khaw KT, Rodwell SA, Loos RJ, Boekholdt SM, Inouye M, Deloukas P, Elliott P, Schlessinger D, Sanna S, Scuteri A, Jackson A, Mohlke KL, Tuomilehto J, Roberts R, Stewart A, Kesaniemi YA, Mahley RW, Grundy SM, McArdle W, Cardon L, Waeber G, Vollenweider P, Chambers JC, Boehnke M, Abecasis GR, Salomaa V, Jarvelin MR, Ruokonen A, Barroso I, Epstein SE, Hakonarson HH, Rader DJ, Reilly MP, Witteman JC, Hall AS, Samani NJ, Strachan DP, Barter P, van Duijn CM, Kooner JS, Peltonen L, Wareham NJ, McPherson R, Mooser V, Sandhu MS. Genetic Variants Influencing Circulating Lipid Levels and Risk of Coronary Artery Disease. Arterioscler Thromb Vasc Biol. 2010;23:23. doi: 10.1161/ATVBAHA.109.201020. [DOI] [PMC free article] [PubMed] [Google Scholar]
- 4.Ordovas JM. HDL genetics: candidate genes, genome wide scans and gene-environment interactions. Cardiovasc Drugs Ther. 2002;16:273–281. doi: 10.1023/a:1021769523568. [DOI] [PubMed] [Google Scholar]
- 5.Ramagopalan SV, Heger A, Berlanga AJ, Maugeri NJ, Lincoln MR, Burrell A, Handunnetthi L, Handel AE, Disanto G, Orton SM, Watson CT, Morahan JM, Giovannoni G, Ponting CP, Ebers GC, Knight JC. A ChIP-seq defined genome-wide map of vitamin D receptor binding: associations with disease and evolution. Genome Res. 2010;20:1352–1360. doi: 10.1101/gr.107920.110. Epub 2010 Aug 1324. [DOI] [PMC free article] [PubMed] [Google Scholar]
- 6.Jorde R, Grimnes G. Vitamin D and metabolic health with special reference to the effect of vitamin D on serum lipids. Prog Lipid Res. 2011;50:303–312. doi: 10.1016/j.plipres.2011.05.001. Epub 2011 May 2027. [DOI] [PubMed] [Google Scholar]
- 7.Shahar DR, Froom P, Harari G, Yerushalmi N, Lubin F, Kristal-Boneh E. Changes in dietary intake account for seasonal changes in cardiovascular disease risk factors. Eur J Clin Nutr. 1999;53:395–400. doi: 10.1038/sj.ejcn.1600761. [DOI] [PubMed] [Google Scholar]
- 8.Boullata JI. Vitamin D supplementation: a pharmacologic perspective. Curr Opin Clin Nutr Metab Care. 2010;13:677–684. doi: 10.1097/MCO.0b013e32833de911. [DOI] [PubMed] [Google Scholar]
- 9.Williams RR, Hunt SC. Recruitment of members of high-risk Utah pedigrees. Control Clin Trials. 1987;8:105S–114S. doi: 10.1016/0197-2456(87)90013-4. [DOI] [PubMed] [Google Scholar]
- 10.Willett WC, Sampson L, Stampfer MJ, Rosner B, Bain C, Witschi J, Hennekens CH, Speizer FE. Reproducibility and validity of a semiquantitative food frequency questionnaire. Am J Epidemiol. 1985;122:51–65. doi: 10.1093/oxfordjournals.aje.a114086. [DOI] [PubMed] [Google Scholar]
- 11.Shirts BH, Hasstedt SJ, Hopkins PN, Hunt SC. Evaluation of the gene-age interactions in HDL cholesterol, LDL cholesterol, and triglyceride levels: The impact of the SORT1 polymorphism on LDL cholesterol levels is age dependent. Atherosclerosis. 2011;15:15. doi: 10.1016/j.atherosclerosis.2011.03.008. [DOI] [PMC free article] [PubMed] [Google Scholar]
- 12.Heard-Costa NL, Zillikens MC, Monda KL, Johansson A, Harris TB, Fu M, Haritunians T, Feitosa MF, Aspelund T, Eiriksdottir G, Garcia M, Launer LJ, Smith AV, Mitchell BD, McArdle PF, Shuldiner AR, Bielinski SJ, Boerwinkle E, Brancati F, Demerath EW, Pankow JS, Arnold AM, Chen YD, Glazer NL, McKnight B, Psaty BM, Rotter JI, Amin N, Campbell H, Gyllensten U, Pattaro C, Pramstaller PP, Rudan I, Struchalin M, Vitart V, Gao X, Kraja A, Province MA, Zhang Q, Atwood LD, Dupuis J, Hirschhorn JN, Jaquish CE, O'Donnell CJ, Vasan RS, White CC, Aulchenko YS, Estrada K, Hofman A, Rivadeneira F, Uitterlinden AG, Witteman JC, Oostra BA, Kaplan RC, Gudnason V, O'Connell JR, Borecki IB, van Duijn CM, Cupples LA, Fox CS, North KE. NRXN3 is a novel locus for waist circumference: a genome-wide association study from the CHARGE Consortium. PLoS Genet. 2009;5:e1000539. doi: 10.1371/journal.pgen.1000539. [DOI] [PMC free article] [PubMed] [Google Scholar]
- 13.Higgins M, Province M, Heiss G, Eckfeldt J, Ellison RC, Folsom AR, Rao DC, Sprafka JM, Williams R. NHLBI Family Heart Study: objectives and design. Am J Epidemiol. 1996;143:1219–1228. doi: 10.1093/oxfordjournals.aje.a008709. [DOI] [PubMed] [Google Scholar]
- 14.Muhlestein JB, Horne BD, Bair TL, Li Q, Madsen TE, Pearson RR, Anderson JL. Usefulness of in-hospital prescription of statin agents after angiographic diagnosis of coronary artery disease in improving continued compliance and reduced mortality. Am J Cardiol. 2001;87:257–261. doi: 10.1016/s0002-9149(00)01354-0. [DOI] [PubMed] [Google Scholar]
- 15.Vieth R. Vitamin D supplementation, 25-hydroxyvitamin D concentrations, and safety. Am J Clin Nutr. 1999;69:842–856. doi: 10.1093/ajcn/69.5.842. [DOI] [PubMed] [Google Scholar]
- 16.Levy D, Neuhausen SL, Hunt SC, Kimura M, Hwang SJ, Chen W, Bis JC, Fitzpatrick AL, Smith E, Johnson AD, Gardner JP, Srinivasan SR, Schork N, Rotter JI, Herbig U, Psaty BM, Sastrasinh M, Murray SS, Vasan RS, Province MA, Glazer NL, Lu X, Cao X, Kronmal R, Mangino M, Soranzo N, Spector TD, Berenson GS, Aviv A. Genome-wide association identifies OBFC1 as a locus involved in human leukocyte telomere biology. Proc Natl Acad Sci U S A. 2010;107:9293–9298. doi: 10.1073/pnas.0911494107. [DOI] [PMC free article] [PubMed] [Google Scholar]
- 17.Sandelin A, Wasserman WW, Lenhard B. ConSite: web-based prediction of regulatory elements using cross-species comparison. Nucleic Acids Res. 2004;32:W249–W252. doi: 10.1093/nar/gkh372. [DOI] [PMC free article] [PubMed] [Google Scholar]
- 18.Fullerton SM, Buchanan AV, Sonpar VA, Taylor SL, Smith JD, Carlson CS, Salomaa V, Stengard JH, Boerwinkle E, Clark AG, Nickerson DA, Weiss KM. The effects of scale: variation in the APOA1/C3/A4/A5 gene cluster. Hum Genet. 2004;115:36–56. doi: 10.1007/s00439-004-1106-x. [DOI] [PubMed] [Google Scholar]
- 19.Wehmeier K, Beers A, Haas MJ, Wong NC, Steinmeyer A, Zugel U, Mooradian AD. Inhibition of apolipoprotein AI gene expression by 1, 25-dihydroxyvitamin D3. Biochim Biophys Acta. 2005;1737:16–26. doi: 10.1016/j.bbalip.2005.09.004. [DOI] [PubMed] [Google Scholar]
- 20.Hasstedt SJ. jPAP: Document-driven software for genetic analysis. Genet Epidemiol. 2005;29:1. [Google Scholar]
- 21.Jacques PF, Sulsky SI, Sadowski JA, Phillips JC, Rush D, Willett WC. Comparison of micronutrient intake measured by a dietary questionnaire and biochemical indicators of micronutrient status. Am J Clin Nutr. 1993;57:182–189. doi: 10.1093/ajcn/57.2.182. [DOI] [PubMed] [Google Scholar]
- 22.Consortium GP. A map of human genome variation from population-scale sequencing. Nature. 2010;467:1061–1073. doi: 10.1038/nature09534. [DOI] [PMC free article] [PubMed] [Google Scholar]
- 23.Akhter J, Lu Y, Finlay I, Pourgholami MH, Morris DL. 1alpha,25-Dihydroxyvitamin D3 and its analogues, EB1089 and CB1093, profoundly inhibit the in vitro proliferation of the human hepatoblastoma cell line HepG2. ANZ J Surg. 2001;71:414–417. doi: 10.1046/j.1440-1622.2001.02147.x. [DOI] [PubMed] [Google Scholar]
- 24.Nordestgaard BG, Tybjaerg-Hansen A. Genetic determinants of LDL, lipoprotein(a), triglyceride-rich lipoproteins and HDL: concordance and discordance with cardiovascular disease risk. Curr Opin Lipidol. 2011;22:113–122. doi: 10.1097/MOL.0b013e32834477d2. [DOI] [PubMed] [Google Scholar]
- 25.Vergeer M, Holleboom AG, Kastelein JJ, Kuivenhoven JA. The HDL hypothesis: does high-density lipoprotein protect from atherosclerosis? J Lipid Res. 2010;51:2058–2073. doi: 10.1194/jlr.R001610. [DOI] [PMC free article] [PubMed] [Google Scholar]
- 26.National Heart, L., and Blood Institute (NHLBI) NIH News. National Institutes of Health; 2011. NIH stops clinical trial on combination cholesterol treatment. [Google Scholar]
- 27.Tai ES, Ordovas JM. Clinical significance of apolipoprotein A5. Curr Opin Lipidol. 2008;19:349–354. doi: 10.1097/MOL.0b013e328304b681. [DOI] [PMC free article] [PubMed] [Google Scholar]
- 28.Forte TM, Shu X, Ryan RO. The ins (cell) and outs (plasma) of apolipoprotein A-V. J Lipid Res. 2009;50(Suppl):S150–S155. doi: 10.1194/jlr.R800050-JLR200. [DOI] [PMC free article] [PubMed] [Google Scholar]
- 29.Brown CM, Rea TJ, Hamon SC, Hixson JE, Boerwinkle E, Clark AG, Sing CF. The contribution of individual and pairwise combinations of SNPs in the APOA1 and APOC3 genes to interindividual HDL-C variability. J Mol Med. 2006;84:561–572. doi: 10.1007/s00109-005-0037-x. [DOI] [PMC free article] [PubMed] [Google Scholar]
- 30.Hamon SC, Kardia SL, Boerwinkle E, Liu K, Klos KL, Clark AG, Sing CF. Evidence for consistent intragenic and intergenic interactions between SNP effects in the APOA1/C3/A4/A5 gene cluster. Hum Hered. 2006;61:87–96. doi: 10.1159/000093384. [DOI] [PMC free article] [PubMed] [Google Scholar]
- 31.Lai CQ, Corella D, Demissie S, Cupples LA, Adiconis X, Zhu Y, Parnell LD, Tucker KL, Ordovas JM. Dietary intake of n-6 fatty acids modulates effect of apolipoprotein A5 gene on plasma fasting triglycerides, remnant lipoprotein concentrations, and lipoprotein particle size: the Framingham Heart Study. Circulation. 2006;113:2062–2070. doi: 10.1161/CIRCULATIONAHA.105.577296. [DOI] [PubMed] [Google Scholar]
- 32.Guo SW. Gene-environment interaction and the mapping of complex traits: some statistical models and their implications. Hum Hered. 2000;50:286–303. doi: 10.1159/000022931. [DOI] [PubMed] [Google Scholar]
Associated Data
This section collects any data citations, data availability statements, or supplementary materials included in this article.