

Abstract
Exogenous cell therapy aims to replace/repair diseased or dysfunctional cells and promises to revolutionize medicine by restoring tissue and organ function. To develop effective cell therapy, the location, distribution and long-term persistence of transplanted cells must be evaluated. Nanoparticle (NP) based imaging technologies have the potential to track transplanted cells non-invasively. Here we summarize the most recent advances in NP-based cell tracking with emphasis on (1) the design criteria for cell tracking NPs, (2) protocols for cell labeling, (3) a comparison of available imaging modalities and their corresponding contrast agents, (4) a summary of preclinical studies on NP-based cell tracking and finally (5) perspectives and future directions.
Nanobiotechnology, the intersection of nanotechnology and biology, permits the development of new research tools and effective therapies [1]. A great example of nanobiotechnology is the development of drug delivery nanoparticles (NPs) [2–4]. Many biopharmaceuticals including protein, siRNA and DNA suffer from short half-life and poor bioavailability in vivo limiting their therapeutic effect [5]. Consequently, nanosized carriers (e.g. drug nanocrystals, liposomes, polymeric NPs) have emerged as an effective means to control the delivery of multiple classes of drugs and biomolecules [6, 7].
This paper focuses on the use of nanobiotechnology for tracking the fate and function of cells post-transplantation. Exogenous cell therapy utilizes transplanted cells, in particular stem and progenitor cells, to replace or regenerate damaged or diseased tissue [8]. Transplanted cells may home to diseased tissue, regenerate tissues through (trans) differentiation and/or provide regenerative cues that facilitate regeneration through trophic factors and cell–cell interactions [9, 10]. Over the past 50 years, several effective cell therapies have been developed [11, 12]. For example, in 1956, the first successful bone marrow transplant was performed on a leukemia patient by Dr Donnall Thomas in New York [13]. In 1997, the US Food and Drug Administration (FDA) approved autologous cultured chondrocytes for the treatment of cartilage defects in the knee [14, 15]. These successful examples and the failure of current medical practice to treat or reverse disease processes have inspired scientists and clinicians to develop new cell-based therapeutics. Promising approaches include stem cell transplants for myocardial infarction [16] and neurodegenerative disease [17], and dendritic cell vaccinations for cancer therapy [18]. Currently, thousands of clinical trials around the world involve some form of cell therapy [19].
While preclinical results have been very promising, few approaches have been translated into humans. This is likely in part due to the lack of a comprehensive understanding of the fate of transplanted cells, their distribution after injection, and the level of engraftment in local microenvironments [20]. Traditionally, monitoring of therapeutic cells is conducted by histological analysis, which is laborious and invasive, requiring multiple tissue biopsies [21]. Non-invasive imaging methods are urgently needed for qualitatively and quantitatively monitoring transplanted cells to understand their fate and function, which will facilitate prediction of treatment efficacy, reveal optimal transplantation conditions including cell dose, delivery route, and timing of injections, and ultimately improve patient treatment [22, 23].
Recently, approaches using available imaging techniques, particularly optical imaging, magnetic resonance imaging (MRI) and radionuclide imaging, have been utilized for tracking transplanted cells. Contrast agents are typically used to distinguish the cells from the background of the host tissue [24]. Although small molecules such as gadolinium-tetraazacyclododecanetetraacetic acid, an MRI contrast agent, and Fludeoxyglucose (18F), a positron emission tomography (PET) contrast agent, have been widely used in both research and clinical settings, NPs are receiving increased attention as next-generation contrast agents because of their unique properties [24, 25, 2]. NPs can be synthesized to possess tunable sizes, shapes, compositions, and physical properties (i.e. electronic, magnetic, optical, and thermal properties) [26, 27]. For example, semiconductor nanocrystals or quantum dots (QDs) exhibit not only tunable fluorescence emission wavelength (which is size dependent) but also photostability and multicolor capability under single source excitation [28]. In addition, NPs can be readily designed and prepared to include an array of properties including magnetic and optical scattering, absorption or luminescence for use with multiple imaging modalities [29]. Their surfaces can also be easily conjugated with targeting moieties without changing the physical properties, making them feasible for cell labeling in vitro or selective labeling in vivo [30, 31].
Here we highlight the latest developments in NP-based contrast agents for cell tracking. Specifically, we start from an introduction of imaging modalities and the design criteria of NPs, and then discuss cell labeling methods. We then concentrate on applications of NPs currently undergoing preclinical or clinical development and conclude with a discussion of ongoing challenges and future prospects for the use of NP-based contrast agents for cell tracking.
1. Imaging modalities for cell tracking
Imaging modalities for NP-based cell tracking vary greatly in their sensitivity, resolution, penetration depth, cost, quantitative ability and longitudinal tracking abilities (i.e. repeated observations of the same object over long period of time) (see table 1). These imaging modalities could be divided based on their penetration depth into two major groups: shallow tissue and deep tissue modalities [24]. Shallow tissue modalities are generally cost-effective but only suitable for small animal studies and superficial applications while deep tissue modalities permit cell tracking in large animals and humans.
Table 1.
Imaging modalities for tracking NP-labeled cells in animals and humans.
| Modality | NP-based contrast agents | Resolution | Depth | Quantitative | Longitudinal cell tracking | Assessment of cell viability or function | Cost | Representative cases for cell tracking |
|---|---|---|---|---|---|---|---|---|
| Fluorescence | QDs, fluorochrome-labeled NPs | 2–3 μm | <5 cm | Yes | Yes | No | Low | [52–59] |
| Photoacoustic tomography | Au, carbon nanotubes | 10 μm | <1 cm | Yes | Yes | No | Low | No report |
| Optical coherence tomography | Au, Ag, carbon, or melanin NPs | ~10 μm | <2 mm | Yes | Yes | Yes | Low | No report |
| Magnetic resonance imaging | T1 contrast agents: Gd2O3, GdF3, MnO, FeCo, or Gd3+ containing NPs T2 agents: Fe3O4 | 10–100 μm 10–100 μm | No limit No limit | Semi-quantitative Semi-quantitative | Yes Yes | No No | High High | [60, 61] [62–66] |
| Single-photon emission computed tomography | 99mTc- or 111In-labeled NPs | 8–10 mm | No limit | Yes | No | Yes | High | No report |
| Positron emission tomography | 18F-, 64Cu-, or 11C-labeled NPs | 4–5 mm | No limit | Yes | No | Yes | High | [44] |
1.1. Shallow tissue imaging modalities
Shallow tissue imaging usually refers to optical imaging modalities, in which photons penetrate tissue and interact with molecules near the surface. Optical imaging modalities for cell tracking include fluorescence, bioluminescence, photoacoustics, and optical coherence tomography. In general, these techniques are cost-effective, fast, and amenable to repeated measurements in the same animal. However, the limited penetration depth restricts the use of these techniques to small animals and superficial applications.
1.1.1. Fluorescence
Fluorescence is the property of certain molecules to absorb light at a particular wavelength and to emit light of a longer wavelength after a brief interval known as the fluorescence lifetime [32]. The basic components of a fluorescence imaging system include excitation source, light delivery optics, light collection optics, filters for emitted light, and signal detection and collection components. Fluorescence imaging can provide information at different resolutions and depth penetrations ranging from micrometers (microscopy) to centimeters (macroscopy) [33].
1.1.2. Bioluminescence (BL)
BL is released from a chemical reaction in the form of visible light. In contrast to fluorescence imaging, there is no inherent background noise which makes this technique highly sensitive. There are two general types of BL [34]. The first involves a biochemical reaction where the total amount of emitted light is directly proportional to the amount of an organic compound present in the organism. The light-emitting reaction is catalyzed by an enzyme responsible for the oxidation of the organic compound, resulting in the production of light. A particularly useful pair is firefly luciferase–luciferin. A typical doses of luciferin is >100 mg kg−1 body weight administered intraperitoneally in a murine model [35] and injected immediately before data acquisition. The second type of BL is emitted by photoproteins, which also emit light in aqueous solutions when a chemical is added [36]. Unlike the luciferin–luciferase system, the total amount of light emitted is proportional to the amount of the photoprotein present. There are currently three different types of photoproteins including calcium activated aequorin and obelin, peroxide activated photoproteins such as that found in Chaetopterus, and an ATP activated form found in the Luminodesmus millipede [37].
1.1.3. Photoacoustic tomography (PAT)
PAT is a hybrid imaging modality, which is advantageous for its strong optical absorption contrast and high ultrasonic resolution [38]. Pulsed laser light in the near infrared absorbed by sensitive contrast agents (e.g. gold nanorods) creates an acoustic source, whose strength is proportional to the local absorption at the incident optical wavelength. An image is developed by using ultrasound technology, where PAT contrast is directly related to optical absorption. It can sample optical phenomena within tissue to a depth of several centimeters with the cost and convenience of a hand-held scanner [39].
1.1.4. Optical coherence tomography (OCT)
OCT is an optical signal acquisition and processing technique [40]. It captures 3D images by interferometrically detecting backscattered light, typically near-infrared light, and can provide micrometer resolution [41]. However, the imaging depth in OCT is limited by optical scattering because scattering tends to attenuate and randomize the light [24]. With near-infrared light, OCT can achieve an imaging depth of up to 2 mm in most tissues. This technique has been used clinically for some applications such as eye examination (i.e. to detect and monitor retinal diseases and optic neuropathies) [42].
1.2. Deep tissue imaging modalities
The modalities suitable for deep tissue imaging, including MRI, PET, and single-photon emission computed tomography (SPECT), have been used in both preclinical studies and clinical practice. In general, compared with MRI, techniques depending on radioactive isotopes (i.e. PET and SPECT) are relatively quantitative and sensitive (the lowest detectable concentration for radioisotopes is 10−12 M, compared to 10−7 M for Fe in a conventional MRI scanner) [43]. However, isotopes usually have short half-lives, which limit their applications toward longitudinal imaging. A possible solution is to use an injectable label, such as a radiolabeled dextran-coated iron oxide NP [44], which can be repeatedly injected for longitudinal cell tracking. Furthermore, techniques using radioactive isotopes or ionizing radiation may be restricted by exposure limits in human trials (mean lifetime radiation exposure should be ~14.94 mSv with a maximum of 50 mSv allowed in any given year) [45, 46]. By contrast, MRI does not require radiation and is suited for longitudinal tracking. In addition, MRI has high spatial resolution (10–100 μm), tomographic reconstruction ability, and inherent tissue contrast.
1.2.1. PET
PET is a nuclear imaging technique that produces 3D images of functional processes such as blood flow and metabolism [47]. The PET tracer emits positrons which collide with electrons a few millimeters away, providing two gamma photons in opposite directions. Subsequently, the gamma photons are collected by a PET scanner to allow the construction of the 3D distribution of the radiotracers. These radiotracers can be either a molecule or a NP containing the isotopes (e.g. oxygen-15 [15O], nitrogen-13 [13N], carbon-11 [11C], and fluorine-18 [18F]) [48]. PET provides higher-resolution images than SPECT (which has about 1 cm resolution—see below).
1.2.2. SPECT
Similarly to PET, SPECT detects and uses gamma rays to reconstruct true 3D images of the body. However, SPECT directly measures the gamma radiation emitted from the tracer. The advantages of SPECT scans include the lower cost and the longer-lived radioisotopes (e.g. technetium Tc-99m [99mTc], indium-111 [111In], and iodine-123 [123I]) than PET [49].
1.2.3. MRI
MRI is an imaging technique making use of the property of nuclear magnetic resonance to image the nuclei of atoms inside the body [50]. It provides contrast based on the local differences in proton density. It offers great contrast between different soft tissues of the body and provides good anatomical information (resolution <100 μm) [51]. There are two MRI mechanisms, T1-weighted and T2-weighted, which will be discussed in detail in section 4.2. To further improve contrast, contrast agents including iron oxide NPs are used in most MRI experiments.
2. Design criteria of NPs for cell tracking
The potential application of NPs as contrast agents is attributed to their novel electronic, magnetic, optical, and structural properties that cannot be obtained from either individual molecules or bulk materials. Thus it is critical to successfully exploit the unique features of NPs before using them to understand the fate and function of transplanted cells in cell therapy. The following criteria must be considered when designing these cell tracking NPs.
NPs with unique physical properties should be prepared using a reproducible procedure to permit standardization.
The NPs must maintain their physical properties after cellular internalization to provide detectable signals.
The NPs should have minimal influence and toxicity on the biological properties of cells and tissues.
To design a functional and biocompatible system that can meet these requirements, interdisciplinary knowledge from fields including physics, chemistry, material science, and biology are essential. In this section, we discuss how to satisfy these criteria when designing cell tracking NPs using the most widely used MRI contrast agent, magnetic NPs for T2-weighted imaging, as an example.
2.1. Criterion 1: preparation of NPs
Magnetic NPs produce a signal loss in T2-weighted MRI by virtue of susceptibility differences from the adjacent environment [67]. A strong T2 shortening effect is always desired to provide a high signal-to-noise ratio, to permit long-term tracking without significant label dilution due to cell metabolism, and to reduce the requirement of high-field MRI which in turn reduces the cost [27]. Therefore, the pursuit of NPs with high T2 shortening has been a central focus in the development of magnetic NPs.
The T2 shortening effect is closely related to three NP parameters: size, composition, and crystallinity. Commonly used synthetic methods are based on hydrolysis/condensation of M2+ (where M is a 2+ cation of Mn, Fe, Co, or Ni) and Fe3+ ions by a base, usually NaOH or NH3·H2O, in an aqueous solution, or in reverse micelles [68]. Although this co-precipitation method is suitable for mass production of magnetic NPs, it is difficult to control the size distribution and the crystallinity. In recent years, high-temperature decomposition of metal precursors in organic solvents has been developed to solve this problem [69, 70]. For example, Sun et al demonstrated that the size, composition, and crystallinity of bimetallic NPs (FePt) could be controlled by simply tuning the ratio between surfactants and metal precursors [70, 69]. Jun et al used this method to synthesize NPs from 4 to 12 nm and demonstrated that larger iron oxide NPs provided a stronger T2 shortening effect under the same Fe concentration [71]. The T2 shortening effect is highly sensitive to NP size because it arises from the collective interaction of atomic magnetic dipoles. Other parameters of critical importance to the performance of NPs are the composition and the crystallinity. Lee et al investigated a series of metal doped iron oxide NPs of spinel MFe2O4 (M is Mn, Fe, Co or Ni). At similar sizes, MnFe2O4 NPs showed the highest magnetic susceptibility and thus the strongest T2 shortening effect [72]. In addition to the composition, Basti et al showed that iron oxide NPs in the magnetite phase provide a stronger T2 shortening effect than those in the maghemite phase [73]. Finally, the magnetic properties of NPs can be enhanced through the controlled aggregation of NPs into clusters, which induces the magnetic relaxation switch effect [74]. For example, the T2 relaxivity changed from 234 to 512 s−1 mM−1 when the size of the iron oxide NPs clusters increased from 43 to 113 nm, which was controlled via the assembly of amphiphilic mPEG–PLA copolymer with hydrophobic iron oxide NPs in aqueous solution [75].
2.2. Criterion 2: modification and stability of NPs
Regardless of their preparation, NPs for cell labeling should be stable in physiological buffers and biocompatible. This is achieved through coating the surface of the NPs which contacts biological entities such as cells or tissue [76]. The coatings should (i) allow the NPs to be transferred from nonhydrolytic solvents into an aqueous medium if the NPs are synthesized in organic solvents; (ii) increase NP stability in cells and prevent agglomeration; (iii) permit the uptake of NPs by cells via the conjugation of binding ligands. We will discuss these criteria using the modification of magnetic NPs synthesized from the thermal decomposition of metal precursors in organic media as an example.
Magnetic NPs synthesized through thermal decomposition are advantageous in terms of uniform size, well-controlled composition, and high crystallinity, but they are typically synthesized in organic solvents and stabilized by surfactants with hydrophobic tails projecting into the solvent [77]. However, for biomedical applications, NPs have to be soluble and stable in aqueous solution. To address this issue, two types of surface-modification methods have been developed: ligand exchange and biocompatible shells [68].
Ligand exchange: The original surfactants on NPs are replaced by bifunctional ligands that consist of a strong binding moiety to the surface of NPs and hydrophilic groups. This ligand exchange strategy is simple to perform and coats the NP surface with a thin passivating layer, resulting in minimal increase in NP size. For example, Xu et al used dopamine as a binding ligand to immobilize Herceptin on the surface of iron oxide NPs [78, 68] and Huh et al used 2,3-dimercaptosuccinic acid to form water-dispersible iron oxide NPs [79].
Biocompatible shells: Encapsulation is another common method for surface modification. It is simple and allows the encapsulation of multiple types of NPs within one shell. For example, Insin et al was able to co-encapsulate magnetic NPs and QDs in a silica shell, which enabled the live visualization of particle movement in a magnetic field [80]. The coating (especially polymers) not only increases the water solubility of the NPs but also reduces safety and toxicology concerns. Typical shell materials include lipids [81], silica [82], biocompatible polymers [83], and hydrogels [84].
For both methods, electronic repulsion (e.g. 2,3-dimercaptosuccinic acid modified NPs) or steric repulsion in the presence of polymer shells (e.g. PEG or PEO) enables these modified NPs to be well dispersed in aqueous solution without agglomeration, permitting long-term storage of the product [85]. In addition, PEG and PEO can also prevent NPs from protein adsorption, which allows the NPs to bypass the reticuloendothelial system (RES).
Besides preventing agglomeration in aqueous solution, another function of surface coatings is to stabilize the NPs after cellular internalization. As discussed above, the unique properties of NPs are due to their size, composition, and shape. Internalized NPs usually enter the endolysosomal pathway [86] where they are subject to low pH (~4.5) and digestive enzymes, which induce NP clustering [87, 88] and decomposition [89–92]. Particle decomposition is detrimental to the use of NPs for longitudinal tracking of therapeutic cells. To minimize and even prevent these changes, the coating of NPs should be insensitive to low pH and resistant to enzymes. For example, Soenen et al examined four different types of coatings for iron oxide NPs including dextran, carboxy-dextran, citrate, and cationic lipid [88]. At pH 4.5, citrate-coated NPs degraded completely after one week while cationic lipid provided the best protection. The protection by cationic lipid minimized the release of ferrous ion from the NPs allowing MRI imaging of cells for two weeks [88].
When selecting a surface modification, it is critical that the treatment does not prevent NP internalization by cells. An ideal coating material should actually maximize the internalization of NPs. Efforts to increase NP uptake include modulation of surface charge, deposition of transfection agents (e.g. polyethyleneimine), and covalent attachment of protein transduction domains (e.g. TAT peptide) or monoclonal antibodies to the surface [26]. Modulation of NP surface charge is currently the predominant platform to control the cellular internalization of NPs due to its simplicity and low cost. While neutral functional groups are excellent in preventing unwanted biological interactions, charged functional groups are responsible for active NP internalization (e.g. positively charged NPs interact with negatively charged membrane) [93]. For instance, Lorenz et al evaluated the effect of cationic amino groups on the efficient cellular uptake of 200 nm polymeric NPs in various cell types including mesenchymal stem cells (MSCs). Compared with the neutral NPs, the functionalization with cationic amino groups greatly enhanced the uptake of NPs (>70%) without using transfection agents [94]. Similarly Cho et al examined the role of surface charge in the internalization of gold NPs, where neutral and negatively charged NPs adsorbed much less on the plasma membrane and thus showed lower internalizations compared with positively charged NPs [95]. A further study performed by Chung et al revealed that the positive charge on NPs enhanced the cellular internalization but did not alter the mechanism of endocytosis [96]. These studies have enabled the control of the transfection efficiency of cells and the mediation of gene expression in tissues [97–100].
2.3. Criterion 3: biocompatibility/toxicity of NPs
To be suitable for cell tracking in vivo, another important criterion is to ensure that the NPs have minimal impact on the cell phenotype and are non-toxic to the host. NP modification should not negatively impact cell viability, proliferation, differentiation, migration/homing, or cell–cell communication. At high concentrations, almost all current NPs (e.g. iron-oxide-based NPs, QDs) influence cell fate to some degree, due to the release of metal ions (e.g. iron, Cd), induced reactive oxygen species (ROS), disruption of protein conformation, and distorted functioning of cell endosomes [101]. The composition, size, shape, surface chemistry, and dose of NPs all have impact on cell biology and function and must be carefully tuned to minimize biological impact. Here we list a few examples of how magnetic NPs influence cell phenotype and function.
Iron ions released from iron oxide NPs have shown influence over cell growth and differentiation. Kim et al noticed an enhancement of neurite outgrowth in PC12 cells labeled with iron oxide NPs which led to the activation of cell adhesion molecules associated with cell matrix interaction [102]. Chen et al showed the inhibitory effect of Ferucarbotran on osteogenic differentiation of human MSCs, which involved the Fe-mediated Wnt/β-catenin signaling pathway [103]. A genetic study conducted by Kedziorek et al revealed the influence of increased cellular iron concentration on gene expression [104]. Specifically, in the labeling of C17.2 neural stem cells with USPIO (ultrasmall superparamagnetic iron oxide), gene expression profiling revealed that ~1% of genes (49 in total) exhibited greater than two-fold difference in expression relative to unlabeled cells. In particular, transferrin receptor 1 (Tfrc) and heme oxygenase 1 (Hmox1) expression was downregulated early, whereas genes involved in lysosomal function (Sulf1) and detoxification (Clu, Cp, Gstm2, Mgst1) were upregulated at later time points.
Moreover, the surface chemistry of the NPs can influence the host cells. For example, albumin conjugated iron oxide NPs significantly promote proliferation of primary human fibroblasts, whereas uncoated and dextran-coated NPs inhibit their proliferation [105]. Furthermore, a new type of MRI contrast agent, nanodiamonds, were found to cause increased expression of DNA repair proteins, such as p53 and MOGG-1, in embryonic stem cells [106]. The authors proposed that the negatively charged carboxyl coating allowed the nanodiamonds to develop strong noncovalent bonds with cell surface proteins, which resulted in internalization of nanodiamonds by cells and the generation of ROS in the cellular environment leading to DNA damage.
Finally, the concentration of internalized NPs can also impact cell behavior. Soenen et al tested four types of magnetic NPs (i.e. commercially available Endorem and Resovist, very small organic particles, and benchmade magnetoliposomes) on two cell types: murine C17.2 neural progenitor cells and primary human blood outgrowth endothelial cells [107]. They found that all the particles diminish cellular proliferation and affect the actin cytoskeleton, microtubule network architecture, and focal adhesion formation in a dose dependent manner. These phenotypic changes are due to the high load of internalized particles arresting endosomes and thus increasing the total volume of endosomes, which sterically hindered the normal localization of the actin fibers and led to disruption and remodeling of the cytoskeleton.
The biodistribution, half-life, and toxicity after in vivo cell administration are other important aspects of the use of NPs for cell tracking. Although one would assume internalized NPs traffic with the NP loaded cells, the majority of transplanted cells die shortly after administration and the released NPs may circulate and be internalized by phagocytic cells and cleared through the RES, as evidenced by accumulation of NPs in the liver and spleen [108, 109]. Depending on the toxicity mechanism of a particular type of NP, an appropriate coating is typically required to make the NPs less toxic. For instance, biocompatible polymers (e.g. alginate, chitosan) are used to modify Fe3O4 NPs to reduce the toxicity from ROS and released Fe2+ [101]. While some studies have demonstrated that administered NPs have minimal adverse effects on the NP loaded cells, systematic studies have to be conducted with standardized in vitro and in vivo assays to assess the long-term impact of the in vivo use of NPs. In addition, the potential threats or risks of NPs to human health and the environment, defined as nanotoxicity, are emerging and have been a subject of intense research in the past several years. As nanotoxicity is beyond the scope of the current review, we recommend several recent excellent reviews on this topic for interested readers [101, 110, 111].
3. Cell labeling
Once functional and stable NPs with minimal impact on cell phenotype have been designed, the next step is to label the cell of interest. Immune cells may be labeled to gain insight into their trafficking, distribution, and response to inflammation in disease models [112]. Stem and progenitor cells may be labeled to study their engraftment and persistence [1]. Similarly, beta cells in islet transplantation are labeled to examine their viability and proliferation [113]. Finally, cancer cell lines such as HeLa cervical carcinoma cells, C6 tumor cells, liver-metastatic RAW117 cells, and lung-metastatic B16BL6 melanoma cells have also been labeled to study cancer development and tumor metastasis in relevant models [24].
The simplest and most common way of labeling cells is to label cells in vitro before transplantation. Labeling cells in vitro permits the removal of excess label and dead cells as well as detailed analyses on the labeled cells before transplantation. Upon incubation, NPs can be internalized by cells through phagocytosis or endocytosis. NP internalization can be enhanced through the use of transfection agents such as peptides and liposomes or through electroporation [114]. However, with increased labeling comes the risk of decreased viability. For example, Park et al used a commercial transfection agent (lipofectamine) to improve the labeling efficiency of magnetic NPs on adipose derived stem cells [115]. They found that lipofectamine greatly improved the labeling efficiency but led to decreased cell viability. More laborious techniques such as microinjections can also be used to label cells in vitro. Although in vitro labeling is a widely used procedure, it should be used cautiously when labeling cells with radiolabels, given that the common clinically used radioisotopes have half-lives ranging from ~2 to 48 h (hours) restricting the length of time they can be detected in vivo. Therefore, cell labelling with radiolabels needs to be done shortly before transplantation.
In addition to in vitro labeling, it is also possible to label cells in vivo. This labeling technique is performed through injection of labels either systemically or locally. Labels may be taken up non-specifically through phagocytosis or targeted to a specific cell type through antibody-mediated targeting. For example, Shapiro and colleagues injected micrometer sized iron oxide particles into the lateral ventricle or closely into the subventricular zone of rat brain to label progenitor cells and examine their migration [116]. Shaw et al reported high throughput synthesis and screening of NPs decorated with synthetic small molecules, which demonstrates high specificity to endothelial cells, human macrophages, or pancreatic cancer cells [117]. In vivo labeling eliminates the in vitro purification of labeled cells, and is thus not restricted by the short half-life of radiolabels. The agent can be injected before each imaging session and permits longitudinal studies without loss of signal. Furthermore, only viable or functional cells will be able to take up NPs efficiently. For example, Nahrendorf et al imaged macrophages in atherosclerotic plagues in a mouse model through systemically injecting 64Cu-labeled dextran-coated magnetic NPs [44]. Flow cytometric analysis demonstrated that macrophage-associated radioactivity contributed 73.9% of the total radioactivity. Common problems of in vivo labeling, however, include restricting uptake to the target cell populations, accumulation in non-specific areas, the large doses required to allow sufficient uptake by the target cells, clearance of unbound label, and clinical exposure limits for radioisotopes [23].
The appropriate labeling approach should be selected to achieve optimal labeling efficiency for the application. New labeling techniques should be characterized thoroughly to determine their effect on cell phenotype. In addition, labeling for clinical use must be performed in a good manufacturing practices (GMP) facility using compounds that may be approved for human use.
4. Tracking NP-labeled cells with imaging modalities
The goal of cell tracking is to study the distribution and migration of cells following transplantation. There have been numerous developments of NP-based contrast agents that utilize a variety of imaging modalities (table 1). Here we focus on the three most widely used imaging modalities: (1) fluorescent NPs for fluorescent imaging, (2) magnetic NPs for MRI, (3) radioisotope containing NPs for PET or SPECT imaging.
4.1. Fluorescent NPs for optical imaging
Optical imaging, especially fluorescence imaging coupled with contrast agents, is perhaps the most widely used imaging technology in biological science because of its desirable features of rapid frame rates, high temporal resolution, low cost, lack of radiation, and high sensitivity (detection limit as low as 10−12 M of fluorescent tracers) [118].
Traditional fluorophores including small organic molecules (e.g. Rhodamine) and fluorescent proteins (e.g. green fluorescence protein) are cost-effective and easy to use. However, they suffer from photobleaching when subjected to long-term exposure to excitation, which limits their application for the long-term study of cells [119]. One solution to this problem is the usage of QDs consisting of semiconductor NPs (typically 2–5 nm in diameter) with desirable fluorescence properties (broad band absorption spectra, narrow band emission, and high resistance to photobleaching). In contrast to organic fluorophores the emission wavelength of QDs does not depend on their chemical structure but rather on the size of the QDs. QDs in the range of 2–5 nm exhibit discrete energy levels and tunable optical absorption/emission properties that are dependent on their size, shape, and chemical composition. In practice, the smaller the QDs the higher the energy or frequency of the emitted light; hence, as a QD increases in size, the color it emits changes across the visible spectrum from blue to red (figure 1). Since the 1980s, several methods have been developed to precisely synthesize QDs of desired sizes and shapes. We refer the reader to a comprehensive review on QDs by Obonyo et al for details [120]. Compared with organic dyes and fluorescent proteins, QDs offer a broader range of emission spectra that cover both the visible and near-infrared (NIR) wavelengths, exhibit larger absorption coefficients, and have much higher photostability [121].
Figure 1.

Emission maxima and sizes of quantum dots of different compositions. QDs can be synthesized from various types of semiconductor materials (II–VI: CdS, CdSe, CdTe; IV–V: InP, InAs; IV–VI: PbSe) characterized by different bulk band gap energies. The curves represent experimental data from the literature on the dependence of peak emission wavelength on QD diameter. The range of emission wavelength is 400–1350 nm, with size varying from 2 to 9.5 nm (organic passivation/solubilization layer not included). All spectra are typically around 30–50 nm (full width at half maximum). (Reprinted and adapted with permission from AAAS [25].)
One of the early applications of QDs for cell tracking was demonstrated by Lei et al [56], where MSCs labeled with QDs were systematically injected into NOD/SCID beta2 M null mice. The fluorescence of QDs was used to quantify the tissue distribution of the MSCs in different organs after sacrificing the mice. It was found that the MSCs were primarily retained in the liver, the lungs and the spleen, with little or no accumulation in the brain, the heart, or the kidneys. Ohyabu et al further showed that labeling MSCs by internalized QDs did not have adverse side effects on the differentiation potential of MSCs in vitro or in vivo [53]. Recently, Sugiyama et al reported the non-invasive tracking of MSCs labeled with near-infrared QDs (QDs800) after the cells were transplanted into a rat infarct brain [57]. Previously, MSCs had been genetically labeled with green fluorescent protein (GFP) and transplanted into the rat striatum post-infarction; however, follow-up of the GFP-labeled MSCs was limited to rats with a thin cranium or cranial window and suffered bleaching during longitudinal imaging [122]. In contrast, MSCs labeled with QDs800 overcame these disadvantages, enabling long-term, non-invasive imaging. The near-infrared signal of QDs800 could penetrate through the cranium and scalp. QD-labeled MSCs could be observed between one and eight weeks with the highest fluorescence signal recorded four weeks after transplantation.
Another exciting application of fluorescent real-time tracking is to observe the function and migration of dendritic cells (DCs) in vivo. DCs initiate adaptive immunity by presenting antigen to T cells in lymphoid organs [123]. DC therapy seeks to deliver DCs preconditioned with disease-associated antigens (e.g. tumor lysate) back into patients to induce an adaptive immune response. However, limited success has been achieved in DC-based immunotherapies with many unaddressed questions regarding the delivery method, injection frequency, DC phenotype, etc [124]. Thus, a non-invasive imaging method for tracking DCs’ migration to lymphoid tissues would be highly useful to optimize the injection condition, dose, and frequency. Sen et al labeled skin-resident DCs in vivo by subcutaneously injecting QDs [52]. DCs with QDs were then tracked by fluorescence imaging as they migrated to draining lymph nodes. Pre-labeling DCs with QDs in vitro also allows for non-invasive tracking of the migration of therapeutic DCs [55]. Lim et al demonstrated this by tracking DCs labeled with NIR-emitting QDs as they homed to lymph nodes [54]. QD labeling showed minimal influence over viability and maturation, DC phenotype or maturation potential in vitro.
Another example is the tracking of natural killer cells with QDs [54]. By labeling NK92MI cells with anti-CD56 antibody-coated QD705, Lim could track the cells for up to 12 days after intratumoral injection in a tumor (MeWo cells) bearing mouse. The natural killer cells labeled with QDs presented a similar therapeutic effect to the native cells, revealed by a decrease in tumor size compared to untreated mice.
The above preclinical test revealed that labeling cells with QDs provides high quantum yield with a very narrow emission spectrum, high sensitivity, and stable labeling for months. This labeling also allows for the simultaneous tracking of multiple cell populations that are labeled with QDs of different emissions in the same animal [125]. QD labeling is one of the most suited imaging techniques for tracking different cell populations simultaneously. The future direction would be to apply this technology to reveal the interaction of therapeutic cells with the local microenvironment in a particular disease model, e.g. how do systematically injected MSCs transmigrate across the endothelium at sites of ischemia or injury [126]?
Unfortunately, the currently available QDs are not clinically applicable because of toxic cadmium cores or other nondegradable components [127]. This can be solved by developing cadmium-free or biodegradable QDs. One alternative is to use FDA-approved Cornell dots that consist of a core of about 2.2 nm in diameter containing several dye molecules, surrounded by a protective silica shell [128]. Similar to QDs, Cornell dots are many times brighter (20–30 times) than single dye molecules in solution and resist ‘photobleaching’.
4.2. Magnetic resonance imaging
MRI is a non-invasive and non-destructive modality that can reconstruct 2D and 3D images of an internal living structure. Importantly, MRI is not limited by the volume or depth of the object of interest, making it well suited for whole body imaging [129]. Currently, the image acquisition time of the latest MRI scanners is of the order of seconds, which enables fast dynamic imaging. The spatial resolution is around 10 μm (cells usually have sizes around 5–15 μm) [130]. These advantages have made MRI one of the most valuable tools for cell tracking in vivo.
The principle of MRI stems from nuclear magnetic resonance (NMR) together with the relaxation of proton spins in a magnetic field(figure 2). When the nuclei of protons are exposed to an external magnetic field, their spins align either with or against the magnetic field [27]. During their alignment, the spins precess under a specified frequency, known as the Larmor frequency (ω0). When a resonance frequency in the radio-frequency (RF) range is introduced to the nuclei, the protons absorb energy and are excited to the transverse state (figure 2(A)). After the disappearance of the RF pulse, the excited nuclei relax to their initial state. There are two different relaxation pathways. The first is longitudinal or T1 relaxation, involving the decreased net magnetization in the z-direction recovering to the initial state (figure 2(B)). The second is transverse or T2 relaxation, where the induced magnetization on the perpendicular plane (x y plane) decreases by the dephasing of the spins (figure 2(D)) [131].
Figure 2.

(A) Principle of MRI: spins align parallel or antiparallel to the magnetic field and precess under the Larmor frequency; after induction of the RF pulse the magnetization of the spins changes; excited spins undergo both T1 and T2 relaxation processes. (Copyright Wiley–VCH Verlag GmbH & Co., KGaA. Reproduced with permission from [27].) ((B) and (C)) T1 relaxation of protons is shortened under the presence of T1 contrast agents (e.g. Gd3+), which will generate a brighter image; ((D) and (E)) T2 relaxation of protons is shortened under the presence of T2 contrast agents (e.g. Fe3O4 NPs), which will generate a darker image. (Copyright Wiley–VCH Verlag GmbH & Co., KGaA. Reproduced with permission from [78].)
Based on their relaxation processes, contrast agents are classified as T1 or T2 contrast agents, including magnetic NPs for T2-weighted imaging and gadolinium doped NPs for T1-weighted imaging [132]. Magnetic NPs (e.g. iron oxide NPs) shorten the spin–spin relaxation times (T2 and T2*) of the neighboring regions, and produce a decreased signal intensity in T2- and T2*-weighted MR images(figures 2(D) and (E)). And gadolinium doped NPs generate a brighter image in T1- and T1*-weighted MR images due to the shortening of the spin–lattice relaxation time (T1 and T1*) (figures 2(B) and (C)).
4.2.1. Magnetic NPs
Magnetic NPs for applications as contrast agents in MRI range in size from tens of nanometers to 1 μm. They comprise of a magnetic (e.g. iron oxide) core, a coating layer, and functional groups on the particle surface. Such particles act as contrast agents by creating a large dipolar magnetic field gradient that is experienced by protons in close proximity to the particle [133]. One of the effects is the signal dephasing due to the local field inhomogeneity induced in water molecules near NPs [51] (figures 2(D) and (E)). This effect is seen as hypointensity or negative contrast on T2-weighted and T2*-weighted images due to shortening of T2 and T2* relaxation times. To be visualized in vivo, the iron concentrations should reach at least 1 pg to >30 pg of iron per labeled cell, compared with unlabeled cells containing less than approximately 0.1 pg of iron [134].
The applications of magnetic NPs to label and thus monitor cells have been used to understand cell migration, biodistribution, and proliferation in numerous diseases, such as neurological diseases, myocardial infarction, diabetes, and cancer [135]. For example, in a striatal lesion model for Huntington’s disease, rat MSCs secreting neurotrophic factors (NTFs) were labeled with Feridex NPs and were locally transplanted [136] (figure 3). In the 18 days following injection, the migration pathway and local distribution of cells were revealed through 3D axial gradient echo imaging. The NTF secreting MSCs were found to migrate along the internal capsule toward the striatum (figures 3(A)–(C)). The 3D axial gradient imaging also revealed that migration occurred in all three dimensions, first inferiorly, then medially and anteriorly, and finally laterally arriving at the striatum. When MSCs labeled with USPIO were intraaortally administered into an experimental rat model of acute kidney injury, T2 mapping revealed the immediate accumulation of MSCs in the renal cortex (day 0) and their presence for up to 14 days [65]. A further examination of the liver, spleen, and bone marrow through T2 mapping showed delayed migration to the spleen, liver (day 3–7), and bone marrow. This is an indication of the physiological stem cell homing process. In contrast, in the control animals injected with pure USPIO, the maximum signal reduction and shortening of in the liver and spleen was detected immediately after injection (day 0) due to the accumulation of free circulating iron oxide particles in the cells of RES. Efforts have also been made to quantify the cells by examining the transverse relaxation rate (i.e. R2) and apparent diffusion coefficient (ADC). For example, Chopp et al tried to evaluate the concentration of Feridex NP-labeled neural progenitor cells with ΔR2 (difference in R2 values in the ischemic tissue with and without labeled cells) in a rat stroke model [137]. The gradient echo 3D images found the injected cells at the occipital, parietal, and temporal cortex and in the striatal areas of the ischemic hemisphere five days after injection. Moore et al achieved non-invasive imaging of islet grafts in diabetic mice by labeling the beta cells with magnetic NPs before transplantation [138, 139]. A recent report even monitored vascularization following islet transplantation with dynamic MRI [64, 140].
Figure 3.

Migration of NTF secreting MSCs toward a Quinolinic acid (QA) lesion over time visualized by MRI: (A)–(C) axial two-dimensional T2*-weighted images on days 0, 8, and 18 post-transplantation, respectively. (D) Day 18 high-resolution 100 × 100 × 75 μm3 axial three-dimensional–gradient echo images; the slices are not contiguous. (E) Enlargement of the box in (D). The accumulation can be clearly seen next to hyperintense regions in the image, suggesting that the cells accumulated adjacent to more severely damaged regions. Black circles represent the QA injection mark (shown only on one slice of each time point for convenience; the QA injection mark can be seen in all slices). White circles depict the stem cell transplantation site. White arrows and arrowheads depict the pathway and accumulation sites of the stem cells. (Reproduced from [136] with permission.)
The safety and convenience of magnetic NP-based MRI tracking have enabled a few early phase clinical trials, including DCs in stage III melanoma patients, neural stem cells in brain-damaged patients, CD34+ bone marrow stem cells in patients with chronic spinal cord injury, and islet cells in diabetes patients [135, 141]. The first clinical trial with magnetic NP-labeled cells focused on monitoring cellular vaccine therapy with labeled dendritic cells (DCs) [141]. DCs were transplanted directly into lymph nodes of patients with melanoma and the migration of these cells was serially monitored by MRI through adjacent lymph nodes. The investigators were able to delineate whether labeled cells engrafted into lymph nodes or surrounding subcutaneous fat. In addition, the authors indicated that serial MRI demonstrated that ferumoxide-labeled DCs were cleared from the subcutaneous fat by 30 days after injection. The sensitivity could reach ~2000 DCs per voxel. Another exciting application is to monitor the migration of neural stem cells (NSCs) labeled with Feridex NPs [142]. Cells from patients suffering traumatic brain injury with open head trauma were extracted, placed in culture, and labeled with Feridex NPs. In this early phase trial, patients received intracerebral injections of the labeled NSCs around the area of brain injury. Approximately 50 000 cells were implanted at each site in the brain with up to 10 implantations made per patient. Serial MRIs over the following 10 weeks demonstrated the migration of Feridex NP-labeled neural stem cells from the injection sites into white and gray matter that was not observed in the patient receiving unlabeled cells. They also confirmed that the magnetic signal was from implanted NSCs, not from macrophages that engulfed the labeled NSCs, through double-labeling the NSCs with green fluorescent protein (GFP).
4.2.2. Gadolinium doped NPs
Negative contrast agents such as magnetic NPs produce strong hypointensities (dark spots) on T2- or -weighted MR images. Sometimes, it is difficult to distinguish magnetic NPs-labeled cells in tissue with either a low intrinsic MR signal or hemorrhage due to the similar signal intensity characteristics [143]. Hence, the ability of contrast agents to produce bright positive signal intensity in T1-weighted images and to increase the contrast of transplanted cells would be advantageous for tracking such cells in low-signal tissues.
Most available T1-weighted contrasts are gadolinium (III) (Gd3+) chelates because of the high magnetic moment and symmetric electronic ground state of the Gd3+ ion. However, Gd-based compounds are restricted to extracellular space and, in general, lack the ability to accumulate within cells [144]. Considerable efforts have been devoted to improving cellular uptake and optimizing the relaxation effect using Gd containing NPs. Differently from magnetic NPs which create a large dipolar magnetic field gradient that could be experienced by protons in close proximity to the particle, Gd3+ shortens the T1 relaxation times of coordinated H2O molecules, which are in rapid exchange with bulk H2O. Therefore, it is critical to leave at least a free site on the Gd3+ ion for coordination of H2O and to allow the Gd3+ ion to access the H2O molecules in the local environment. One early example synthesized a Gd3+ ion-coated liposome, which enabled the in vitro labeling of tumor cells in 2 hours and the subsequent imaging in vivo 7 days post-inoculation [145]. Inorganic mesoporous silica NPs have also been used to host Gd3+ ions to promote cellular internalization by MSCs, which was visualized under a 1.5 T MRI system in the basal ganglions of nude mice for 14 days [60]. A recent report utilized single-walled carbon nanotubes to encapsulate Gd3+ ions, which surprisingly amplified the relaxivity of the Gd3+ ions by nearly 40-fold [146]. The MSCs were labeled with those nanotubes in 4 hours without affecting cell viability, differentiation, or self-renewal abilities.
The use of Gd3+ ion containing NPs for cell tracking is still in its infancy. The majority of works are still focused on the synthesis of contrast agents and labeling cells. There are very few reports using this type of NP to study biodistribution, migration, or functionality of administered cells in vivo. One of the reasons might be the lack of knowledge about the long-term stability of those materials in cells and their influence over the cell functionality [147]. Thus, more effort should be spent studying the long-term effects of cell labeling with Gd3+ ion containing NPs.
4.3. Radioisotope containing NPs for PET or SPECT imaging
SPECT and PET are radioisotope-based techniques that differ mainly in the radioisotope used and the mechanism for signal generation and detection [148]. SPECT imaging contrast agents are labeled with γ-emitting radioisotopes (e.g. technetium-99m [99mTc], indium-111 [111In], iodine-123 [123I], and iodine-131 [131I]), whereas PET tracers are labeled with positron-emitting radioisotopes (e.g. oxygen-15 [15O], nitrogen-13 [13N], carbon-11 [11C], and fluorine-18 [18F]) [149]. The first group produces gamma rays of different energy levels, which allow the detection by the SPECT camera through lead collimators. The positron-emitting radioisotopes produce signal via annihilation events (figure 4), in which each positron collides with a nearby electron to produce two 511 keV gamma rays 180° apart [150]. The annihilation causes the emission of a pair of gamma rays which can then be coincidentally detected by a PET scanner. The high-energy gamma rays are able to penetrate through the body, which allows these techniques to be performed in both small animals and humans. One of the biggest advantages of PET and SPECT is the high sensitivity (SPECT 10−10–10−11 M; PET 10−11–10−12 M), which allows the administration of small, nonpharmacological doses (nanograms) for imaging purposes [151]. Therefore, the radiotracer is administered in such a small amount that it does not impact the biological system. With the presence of several FDA-regulated contrast agents (e.g. 2-[F-18]-fluoro-2-deoxy-D-glucose for PET, [In-111]oxine for SPECT), there have been numerous preclinical trials to track radioisotope-labeled cells in animal disease models and even clinical trials [152]. For example, Blocklet et al assessed myocardial-labeled CD34+ cell homing after intracoronary implantation in patients with acute myocardial infarction through PET and SPECT [153].
Figure 4.

Illustration of PET and SPECT. (A) Positron annihilation in PET: the emitted positron from the isotope travels in tissue for a short distance (typically less than 1 mm, but dependent on the isotope), during which time it loses kinetic energy, until it decelerates to a point where it can interact with an electron. When an electron and positron collide, they produce two gamma photons to be emitted in opposite directions. Multi-headed gamma cameras detect these emissions ‘coincident’ in time. (B) The radioisotope emits the gamma photon that is detected by a simple gamma camera.
However, any technique has its problems. The main disadvantages of nuclear imaging include the low spatial resolution (clinical SPECT 7–15 mm; clinical PET 6–10 mm; microSPECT 0.5–2 mm; microPET 1–2 mm), patient exposure to radiation, and short half-life of radioisotopes that limit the duration of cell tracking [148]. Therefore, attempts are being made to combine other imaging modalities with PET/SPECT, including PET–CT and PET–MRI while eliminating or reducing their disadvantages [154]. NPs are ideal scaffolds on which to build contrast agents that integrate multiple imaging modalities into a single platform.
These radioisotope containing NPs for PET/SPECT imaging are usually prepared through one-step chelating radioisotope ions onto the pre-synthesized NPs, which decreases the potential exposure of researchers to the radiation and also maximizes the lifespan of detection. The pre-synthesized NPs could be polymeric NPs (e.g. latex beads [155]) or inorganic NPs (e.g. QDs [156]) that are conjugated with the isotope chelators. The types of chelators include tetraazamacrocyclic ligands with pendant arms that utilize both the macrocyclic and chelate effects to enhance stability (e.g. DOTA (1,4,7,10-tetraazacyclododecane-1,4,7,10-tetraacetic acid), TETA (1,4,8,11-tetraazacyclotetradecane-1,4,8,11-tetraacetic acid)) and the cross-bridged tetraamine ligands (TE2A, CB-4,11-bis(carboxymethyl)-1,4,8,11 -tetraazabicyclo[6.6.2]hexadecane). More specific details about the chelates can be found in other reviews [157].
The deposition of a radioisotope chelator onto a QD or magnetic NP surface would provide a dual-function contrast agent to combine the high sensitivity of PET with the high spatial resolution of MRI or fluorescent imaging [156, 158]. Stelter et al showed that an aminosilane-coated magnetic NP could be functionalized with a fluorescent dye (fluorescein) and a positron-emitting radioisotope (gallium-68) [159]. Hepatogenic HuH7 cells labeled with these particles were intravenously administered and could be followed through the sensitive γ-ray measurements. The imaging results revealed the predominant localization of the labeled cells in the lungs 2 hours after injection and the even distribution throughout the animal’s body 48 hours later. Nahrendorf et al designed a PET–MRI–fluorescence trimodality contrast agent through chelating 64Cu onto the dextranated and DTPA-modified magnetofluorescent NPs [44]. This kind of NP was used to image the macrophages and to identify the atherosclerotic lesions in an Apolipoprotein E deficiency (apoE−/−) mouse model. The combination of PET, MRI and fluorescence combined the individual advantages of each imaging modality. After in vivo distribution of the NPs, all the imaged apoE−/− mice showed a robust PET signal in the aortic root and arch, which showed significant differences between accumulated dose in excised aortas and carotids in apoE−/− versus wild-type mice (figure 5).
Figure 5.
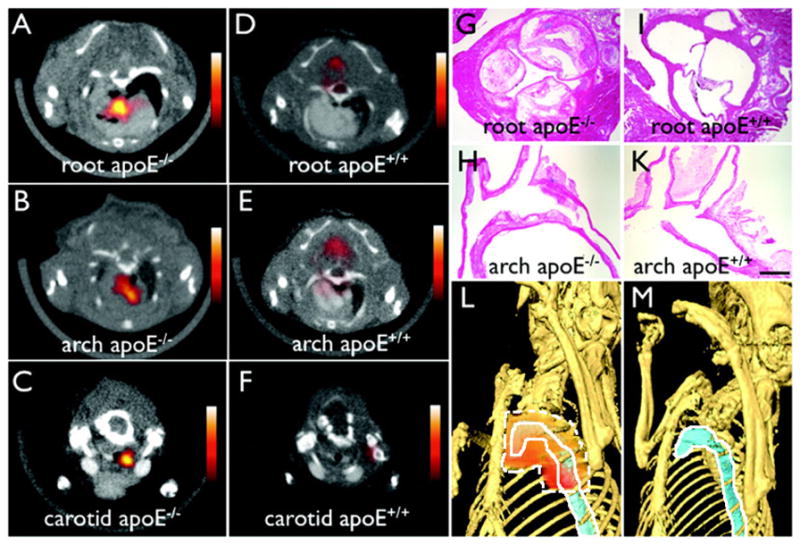
64Cu-fluorescent magnetic NPs facilitate PET–CT imaging of inflammatory atherosclerosis in apoE−/− mice. Fused PET–CT images of the (A) aortic root, (B) arch, and (C) carotid artery of aged apoE−/− mice show a strong PET signal in these vascular territories with high plaque burden, whereas no activity is observed in the same vasculature of wild-type mice (D)–(F). (G)–(H) Hematoxylin and eosin histology of respective vascular regions, which carry a high plaque burden in apoE−/− but not in wild-type mice (I)–(K) (magnification: 400× for (G) and (I), 200× for (H) and (K); bar = 0.4 mm). The three-dimensional maximum intensity reconstruction of the fused data set (L) demonstrates the focal PET signal area surrounded by dashed white line in the proximal thoracic aorta area surrounded by solid white line of an apoE−/− mouse but not in a wild-type mouse (M). (Reproduced from [44] with permission.)
5. Concerns and perspectives
Although NP-based contrast agents have been widely investigated and used for cell tracking in numerous preclinical and clinical trials, there are concerns that should be considered before they become broadly used. Specifically, issues concerning contrast agent transfer, label dilution during cell proliferation and migration, and lack of information about cell functions must be addressed (table 2) [23, 135].
Table 2.
Problems facing NP-based cell tracking and potential solutions.
| Problems | Solutions |
|---|---|
| Contrast agent transfer | Fully characterize the clearance pathways of NP labels and the fate of cells |
| Signal dilution | Genetically modify cells with NP-producing gene |
| Single particle/cell imaging | |
| Lack of information about cell function | Genetically modify cells with reporter gene containing NP-producing gene |
| Present molecular sensor on the cell surface |
5.1. Contrast agent transfer
A major concern about NP-based contrast agents is their transfer from labeled cells to surrounding cells due to normal cell processes (e.g. exocytosis and cell death). For example, Florence et al showed that magnetic NPs could be released by cells upon stress through vesicles, which are subsequently internalized by naive macrophages and trigger an intercellular transfer of magnetic labels [160]. The agent transfer phenomenon is especially important in longer living, dividing, and migratory cells that are pre-labeled before transplantation. Imaging modalities can only detect the contrast agents, without knowing whether the labels are still associated with the host cells. When NP-labeled cells divide or die in vivo, the NPs may be transferred to neighboring cells or to the extracellular matrix. Therefore, the clearance pathways and timelines of the contrast agents should be examined. A good example is the tracking of MSCs in vivo [161]. When MSCs were labeled with an MRI contrast agent (i.e. SPION) and transplanted in Matrigel to areas of inflammation or angiogenesis in a mouse model, ~10% of cells were found to be both CD11b and dextran positive 7 days later. Since CD11b is a marker for macrophage and dextran is a marker for NPs, there was obviously agent transfer from MSCs to macrophages. Another example is the study of iron-labeled cells in the ischemic myocardium in mice [66]. The authors found that there was no change in the signal voids observed in MRI scans in terms of their number, size or location regardless of whether the transferred cells were alive or dead at the time of transplant. These studies show that the fate of NP labels must be carefully characterized, generally using conventional histological techniques or flow cytometry, before valid conclusions can be drawn regarding cell numbers or even localization from in vivo imaging data alone [23, 162].
5.2. Signal dilution
Besides the transfer of particles to surrounding cells, NPs internalized within the injected cells are also subject to dilution due to cell division and exocytosis. One unavoidable consequence of this dilution is the decrease and eventual loss of signal, which is a major limitation for long-term tracking of rapidly dividing cells [163]. For example, Neri et al found that after the third subculturing passage of NP-labeled cells, the number of NP-positive cells decreased by more than 80% [164].
One approach is to genetically engineer the cells to produce NP probes, which is similar to engineering cells to express green fluorescence protein. While transfection of a cell with long-term expression of the gene is complicated, it can avoid the dilution of NPs during cell division. There are only a few available reported genes for generating NP-based contrast agents [165]. One example is the iron storage protein ferritin, which could store up to 4500 Fe(III) atoms in a ferrihydrite core resulting in shortened T2* in MRI [166]. Naumova et al overexpressed ferritin in mouse skeletal myoblasts (C2C12 cells), without compromising normal cell function, they observed a 25% decrease in T2 relaxation time in vitro compared to wild-type cells. Transgenic grafts were detected in vivo three weeks after transplantation into infarcted hearts of syngeneic mice. Another NP-producing gene is magA, a gene in magnetotactic bacteria known to be involved with iron transport into 293 cells. magA produces iron oxide NPs containing 2064 iron atoms [167]. Zurkiya revealed that magnetic NPs were formed in the multivesicular bodies of the cells (293FT) three days after transfection, which improved the iron accumulation (4× compared with untransfected cells) and permitted the visualization of the cells in the mouse brain by MRI five days after transfection [168].
Genetic engineering of cells with NP-producing genes allows the stable expression of imaging probes and prevents the dilution of signal, which enables longitudinal tracking of cells in animal models. However, it is still an open question whether genetic engineering of cells will have any long-term consequence on cell phenotype or function, which may compromise the potential clinical translation [169]. Another approach to address the signal dilution problem is to achieve single particle/single cell detection [170]. For instance, by labeling cells with small iron oxide NPs, the Fe concentration per cell can be 10–30 pg, which permits the tracking of cells up to 10 divisions given that the current detection sensitivity of a typical MRI scanner is 0.1 pg per cell [171]. After 10 divisions, the Fe concentration per cell becomes lower than 0.1pg and thus not detectable.
5.3. Lack of information about cell function
While tracking cells in vivo can provide insight into the efficacy of a therapy, the function of the cells in those locations is equally important. Currently NP-based contrast agents only allow for localization of cells and observation of their temporal–spatial dynamics. It would, however, be of great interest to go beyond this mere localization of labeled cells and observe cellular functions (e.g. the differentiation of stem cells) [172]. For example, during islet transplantation, magnetic NPs could be used to label islets and monitor islet graft in diabetic mice in real time [139]. However, this labeling would not report the survival of the transplanted islets and the level of insulin secretion. Transplant success is still gauged by measuring blood glucose levels. Even if there is loss of some transplanted islets, the upregulation of insulin production from the remaining islets will not be useful to determine whether only a few or many cells exhibit potential for insulin secretion. Thus there is a significant need for contrast agents and related in vivo assays to study the functions of transplanted cells [23].
One potential solution may be to genetically engineer cells with a reporter gene containing a contrast agent-producing gene. When a cell changes from one functional state to another new state, the intrinsic contrast mechanism will be upregulated by activation of the corresponding promoter. Reporter gene methods have been widely explored for radionuclide applications [173]. One related example is an endogenous reporter gene comprising enhanced green fluorescent protein (EGFP), and influenza hemagglutinin (HA)-tagged ferritin that is tightly coregulated by tetracycline. C6 cells stably expressing this construct enabled the detection of tetracycline-regulated gene expression by MRI. The withdrawal of tetracycline induced expression of ferritin and increased intracellular iron content, which elevated the MR relaxation rates both in vivo and in vitro [174]. Recently, our group published another exciting strategy, in which we modified the cell surface with molecular sensors (e.g. anti-PDGF-BB aptamer) [175]. When the administered cells migrated/homed to a specific organ/tissue, the molecular sensors could report the local expression of chemokine/cytokine (e.g. PDGF-BB) in real time.
6. Conclusion
In this paper, we have summarized several typical NP-based approaches for cell tracking. To enable sensitive detection with high spatial resolution in vivo, the physical and chemical properties of the NPs should be precisely controlled during synthesis. To elucidate the complex spatial–temporal dynamics of the transplanted cells, the NPs and the cell labeling process should have minimal impact on the biological functions of the transplanted cells. Current techniques for cell tracking include fluorescence tracking with QDs, MRI tracking using magnetic NPs, and PET imaging with radioisotope containing NPs. The next generation of smart imaging agents should be amenable to multiple imaging modalities and permit reporting on cell function as well as location. Finally, we conclude that more characterization must be performed to elucidate and mitigate agent transfer, signal dilution, and any detrimental effect labeling agents have on cells. The generation of new materials together with a more thorough understanding of cell–label interactions will greatly improve the applicability of NP-based cell tracking and prevent over-interpretation of imaging results.
Acknowledgments
This work was supported by National Institute of Health grants HL097172, HL095722, and DE019191 to JMK and by the American Heart Association grant #0970178N to JMK. WZ is supported by an International Human Frontier Science Program Organization postdoctoral fellowship. DMN is supported by the MIT-UROP program and John Reed Fund.
References
- 1.Ferreira L, Karp JM, Nobre L, Langer R. New opportunities: the use of nanotechnologies to manipulate and track stem cells. Cell Stem Cell. 2008;3:136–46. doi: 10.1016/j.stem.2008.07.020. [DOI] [PubMed] [Google Scholar]
- 2.Mahmoudi M, Hosseinkhani H, Hosseinkhani M, Boutry S, Simchi A, Journeay WS, Subramani K, Laurent S. Magnetic resonance imaging tracking of stem cells in vivo using iron oxide nanoparticles as a tool for the advancement of clinical regenerative medicine. Chem Rev. 2010;111:253–80. doi: 10.1021/cr1001832. [DOI] [PubMed] [Google Scholar]
- 3.Hosseinkhani H, Hosseinkhani M. Biodegradable polymer–metal complexes for gene and drug delivery. Curr Drug Saf. 2009;4:79–83. doi: 10.2174/157488609787354477. [DOI] [PubMed] [Google Scholar]
- 4.Subramani K, Hosseinkhani H, Khraisat A, Hosseinkhani M, Pathak Y. Targeting nanoparticles as drug delivery systems for cancer treatment. Curr Nanosci. 2009;5:134–40. [Google Scholar]
- 5.Saini R, Saini S, Sugandha R. Biotechnology: the novel drug delivery system. Int J Nutr Pharmacol Neurol Dis. 2011;1:82–3. [Google Scholar]
- 6.Peer D, Karp JM, Hong S, FaroKhzad OC, Margalit R, Langer R. Nanocarriers as an emerging platform for cancer therapy. Nat Nanotechnol. 2007;2:751–60. doi: 10.1038/nnano.2007.387. [DOI] [PubMed] [Google Scholar]
- 7.Davis ME, Zuckerman JE, Choi CHJ, Seligson D, Tolcher A, Alabi CA, Yen Y, Heidel JD, Ribas A. Evidence of RNAi in humans from systemically administered siRNA via targeted nanoparticles. Nature. 2010;464:1067–70. doi: 10.1038/nature08956. [DOI] [PMC free article] [PubMed] [Google Scholar]
- 8.Passier R, van Laake LW, Mummery CL. Stem-cell-based therapy and lessons from the heart. Nature. 2008;453:322–9. doi: 10.1038/nature07040. [DOI] [PubMed] [Google Scholar]
- 9.Glotzbach JP, Wong VW, Gurtner GC, Longaker MT. Regenerative medicine. Curr Probl Surg. 2011;48:148–212. doi: 10.1067/j.cpsurg.2010.11.002. [DOI] [PubMed] [Google Scholar]
- 10.Connick P, Patani R, Chandran S. Stem cells as a resource for regenerative neurology. Pract Neurol. 2011;11:29–36. doi: 10.1136/jnnp.2010.235184. [DOI] [PubMed] [Google Scholar]
- 11.Fodor WL. Tissue engineering and cell based therapies, from the bench to the clinic: the potential to replace, repair and regenerate. Reprod Biol Endocrinol. 2003;1:102. doi: 10.1186/1477-7827-1-102. [DOI] [PMC free article] [PubMed] [Google Scholar]
- 12.Jenq RR, van den Brink MR. Allogeneic haematopoietic stem cell transplantation: individualized stem cell and immune therapy of cancer. Nat Rev Cancer. 2010;10:213–21. doi: 10.1038/nrc2804. [DOI] [PubMed] [Google Scholar]
- 13.Powles R. 50 years of allogeneic bone-marrow transplantation. Lancet Oncol. 2010;11:305–6. doi: 10.1016/S1470-2045(10)70001-2. [DOI] [PubMed] [Google Scholar]
- 14.Brittberg M, Lindahl A, Nilsson A, Ohlsson C, Isaksson O, Peterson L. Treatment of deep cartilage defects in the knee with autologous chondrocyte transplantation. N Engl J Med. 1994;331:889–95. doi: 10.1056/NEJM199410063311401. [DOI] [PubMed] [Google Scholar]
- 15.Hunziker EB. Articular cartilage repair: basic science and clinical progress. A review of the current status and prospects. Osteoarthritis Cartilage. 2002;10:432–63. doi: 10.1053/joca.2002.0801. [DOI] [PubMed] [Google Scholar]
- 16.Dai W, Hale SL, Kloner RA. Stem cell transplantation for the treatment of myocardial infarction. Transpl Immunol. 2005;15:91–7. doi: 10.1016/j.trim.2005.09.004. [DOI] [PubMed] [Google Scholar]
- 17.Shihabuddin LS, Aubert I. Stem cell transplantation for neurometabolic and neurodegenerative diseases. Neuropharmacology. 2010;58:845–54. doi: 10.1016/j.neuropharm.2009.12.015. [DOI] [PubMed] [Google Scholar]
- 18.Nencioni A, Grunebach F, Schmidt SM, Muller MR, Boy D, Patrone F, Ballestrero A, Brossart P. The use of dendritic cells in cancer immunotherapy. Crit Rev Oncol Hematol. 2008;65:191–9. doi: 10.1016/j.critrevonc.2007.10.002. [DOI] [PubMed] [Google Scholar]
- 19.2011. www.clinicaltrials.gov
- 20.Nguyen PK, Nag D, Wu JC. Methods to assess stem cell lineage, fate and function. Adv Drug Deliv Rev. 2010;62:1175–86. doi: 10.1016/j.addr.2010.08.008. [DOI] [PMC free article] [PubMed] [Google Scholar]
- 21.Villa C, Erratico S, Razini P, Fiori F, Rustichelli F, Torrente Y, Belicchi M. Stem cell tracking by nanotechnologies. Int J Mol Sci. 2010;11:1070–81. doi: 10.3390/ijms11031070. [DOI] [PMC free article] [PubMed] [Google Scholar]
- 22.Lee Z, Dennis JE, Gerson SL. Imaging stem cell implant for cellular-based therapies. Exp Biol Med. 2008;233:930–40. doi: 10.3181/0709-MR-234. [DOI] [PubMed] [Google Scholar]
- 23.Srinivas M, Aarntzen E, Bulte JWM, Oyen WJ, Heerschap A, de Vries IJM, Figdor CG. Imaging of cellular therapies. Adv Drug Deliv Rev. 2010;62:1080–93. doi: 10.1016/j.addr.2010.08.009. [DOI] [PubMed] [Google Scholar]
- 24.Cho EC, Glaus C, Chen J, Welch MJ, Xia Y. Inorganic nanoparticle-based contrast agents for molecular imaging. Trends Mol Med. 2010;16:561–73. doi: 10.1016/j.molmed.2010.09.004. [DOI] [PMC free article] [PubMed] [Google Scholar]
- 25.Michalet X, Pinaud FF, Bentolila LA, Tsay JM, Doose S, Li JJ, Sundaresan G, Wu AM, Gambhir SS, Weiss S. Quantum dots for live cells, in vivo imaging, and diagnostics. Science. 2005;307:538–44. doi: 10.1126/science.1104274. [DOI] [PMC free article] [PubMed] [Google Scholar]
- 26.Laurent S, Forge D, Port M, Roch A, Robic C, Elst LV, Muller RN. Magnetic iron oxide nanoparticles: synthesis, stabilization, vectorization, physicochemical characterizations, and biological applications. Chem Rev. 2008;108:2064–110. doi: 10.1021/cr068445e. [DOI] [PubMed] [Google Scholar]
- 27.Na HB, Song IC, Hyeon T. Inorganic nanoparticles for MRI contrast agents. Adv Mater. 2009;21:2133–48. [Google Scholar]
- 28.Yin Y, Alivisatos AP. Colloidal nanocrystal synthesis and the organic–inorganic interface. Nature. 2005;437:664–70. doi: 10.1038/nature04165. [DOI] [PubMed] [Google Scholar]
- 29.Gao JH, Gu HW, Xu B. Multifunctional magnetic nanoparticles: design, synthesis, and biomedical applications. Acc Chem Res. 2009;42:1097–107. doi: 10.1021/ar9000026. [DOI] [PubMed] [Google Scholar]
- 30.Medintz IL, Uyeda HT, Goldman ER, Mattoussi H. Quantum dot bioconjugates for imaging, labelling and sensing. Nat Mater. 2005;4:435–46. doi: 10.1038/nmat1390. [DOI] [PubMed] [Google Scholar]
- 31.Katz E, Willner I. Integrated nanoparticle–biomolecule hybrid systems: synthesis, properties, and applications. Angew Chem Int Edn. 2004;43:6042–108. doi: 10.1002/anie.200400651. [DOI] [PubMed] [Google Scholar]
- 32.Weissleder R, Pittet MJ. Imaging in the era of molecular oncology. Nature. 2008;452:580–9. doi: 10.1038/nature06917. [DOI] [PMC free article] [PubMed] [Google Scholar]
- 33.Weissleder R, Ntziachristos V. Shedding light onto live molecular targets. Nat Med. 2003;9:123–8. doi: 10.1038/nm0103-123. [DOI] [PubMed] [Google Scholar]
- 34.Roda A. Chemiluminescence and Bioluminescence: Past, Present and Future. Cambridge: Royal Society of Chemistry; 2011. [Google Scholar]
- 35.Greer LF, Szalay AA. Imaging of light emission from the expression of luciferases in living cells and organisms: a review. Luminescence. 2002;17:43–74. doi: 10.1002/bio.676. [DOI] [PubMed] [Google Scholar]
- 36.Ohmiya Y, Hirano T. Shining the light: the mechanism of the bioluminescence reaction of calcium-binding photoproteins. Chem Biol. 1996;3:337–47. doi: 10.1016/s1074-5521(96)90116-7. [DOI] [PubMed] [Google Scholar]
- 37.Shimomura O. Protein Science Encyclopedia. New York: Wiley–VCH; 2008. [Google Scholar]
- 38.Li C, Wang LV. Photoacoustic tomography and sensing in biomedicine. Phys Med Biol. 2009;54:R59–97. doi: 10.1088/0031-9155/54/19/R01. [DOI] [PMC free article] [PubMed] [Google Scholar]
- 39.Gamelin J, Maurudis A, Aguirre A, Huang F, Guo P, Wang LV, Zhu Q. A real-time photoacoustic tomography system for small animals. Opt Express. 2009;17:10489–98. doi: 10.1364/oe.17.010489. [DOI] [PMC free article] [PubMed] [Google Scholar]
- 40.Huang D, et al. Optical coherence tomography. Science. 1991;254:1178–81. doi: 10.1126/science.1957169. [DOI] [PMC free article] [PubMed] [Google Scholar]
- 41.Podoleanu AG. Optical coherence tomography. Br J Radiol. 2005;78:976–88. doi: 10.1259/bjr/55735832. [DOI] [PubMed] [Google Scholar]
- 42.Bezerra HG, Costa MA, Guagliumi G, Rollins AM, Simon DI. Intracoronary optical coherence tomography: a comprehensive review: clinical and research applications. J Am Coll Cardiol Intv. 2009;2:1035–46. doi: 10.1016/j.jcin.2009.06.019. [DOI] [PMC free article] [PubMed] [Google Scholar]
- 43.Dimarakis I, Menasche P, Habib NA, Gordon MY. Handbook of Cardiac Stem Cell Therapy. London: Imperial College Press; 2008. [Google Scholar]
- 44.Nahrendorf M, Zhang H, Hembrador S, Panizzi P, Sosnovik DE, Aikawa E, Libby P, Swirski FK, Weissleder R. Nanoparticle PET-CT imaging of macrophages in inflammatory atherosclerosis. Circulation. 2008;117:379–87. doi: 10.1161/CIRCULATIONAHA.107.741181. [DOI] [PMC free article] [PubMed] [Google Scholar]
- 45.The 2007 recommendations of the international commission on radiological protection. ICRP publication 103. Ann ICRP. 2007;37:1–332. doi: 10.1016/j.icrp.2007.10.003. [DOI] [PubMed] [Google Scholar]
- 46.Wrixon AD. New ICRP recommendations. J Radiol Prot. 2008;28:161–8. doi: 10.1088/0952-4746/28/2/R02. [DOI] [PubMed] [Google Scholar]
- 47.Phelps ME. PET Physics, Instrumentation, and Scanners. Berlin: Springer; 2006. [Google Scholar]
- 48.Knuuti J, Bengel FM. Positron emission tomography and molecular imaging. Heart. 2008;94:360–7. doi: 10.1136/hrt.2007.118992. [DOI] [PubMed] [Google Scholar]
- 49.Brooks DJ. Positron emission tomography and single-photon emission computed tomography in central nervous system drug development. NeuroRx. 2005;2:226–36. doi: 10.1602/neurorx.2.2.226. [DOI] [PMC free article] [PubMed] [Google Scholar]
- 50.Basilion JP, Yeon S, Botnar R. Current Topics in Developmental Biology. San Diego, CA: Elsevier Academic Press Inc; 2005. [DOI] [PubMed] [Google Scholar]
- 51.Rogers WJ, Meyer CH, Kramer CM. Technology insight: in vivo cell tracking by use of MRI. Nat Clin Pract Cardiovasc Med. 2006;3:554–62. doi: 10.1038/ncpcardio0659. [DOI] [PubMed] [Google Scholar]
- 52.Sen D, Deerinck TJ, Ellisman MH, Parker I, Cahalan MD. Quantum dots for tracking dendritic cells and priming an immune response in vitro and in vivo. PLoS ONE. 2008;3:e3290. doi: 10.1371/journal.pone.0003290. [DOI] [PMC free article] [PubMed] [Google Scholar]
- 53.Ohyabu Y, Kaul Z, Yoshioka T, Inoue K, Sakai S, Mishima H, Uemura T, Kaul SC, Wadhwa R. Stable and nondisruptive in vitro/in vivo labeling of mesenchymal stem cells by internalizing quantum dots. Hum Gene Ther. 2009;20:217–24. doi: 10.1089/hum.2008.100. [DOI] [PubMed] [Google Scholar]
- 54.Lim YT, Cho MY, Noh YW, Chung JW, Chung BH. Near-infrared emitting fluorescent nanocrystals-labeled natural killer cells as a platform technology for the optical imaging of immunotherapeutic cells-based cancer therapy. Nanotechnology. 2009;20:475102. doi: 10.1088/0957-4484/20/47/475102. [DOI] [PubMed] [Google Scholar]
- 55.Noh YW, Lim YT, Chung BH. Noninvasive imaging of dendritic cell migration into lymph nodes using near-infrared fluorescent semiconductor nanocrystals. Faseb J. 2008;22:3908–18. doi: 10.1096/fj.08-112896. [DOI] [PubMed] [Google Scholar]
- 56.Lei Y, Tang H, Yao L, Yu R, Feng M, Zou B. Applications of mesenchymal stem cells labeled with Tat peptide conjugated quantum dots to cell tracking in mouse body. Bioconjug Chem. 2008;19:421–7. doi: 10.1021/bc0700685. [DOI] [PubMed] [Google Scholar]
- 57.Sugiyama T, Kuroda S, Osanai T, Shichinohe H, Kuge Y, Ito M, Kawabori M, Iwasaki Y. Near-infrared fluorescence labeling allows noninvasive tracking of bone marrow stromal cells transplanted into rat infarct brain. Neurosurgery. 2011;68:1036–47. doi: 10.1227/NEU.0b013e318208f891. [DOI] [PubMed] [Google Scholar]
- 58.Cheng LA, Yang K, Zhang SA, Shao MW, Lee ST, Liu ZA. Highly-sensitive multiplexed in vivo imaging using PEGylated upconversion nanoparticles. Nano Res. 2010;3:722–32. [Google Scholar]
- 59.Dupont KM, Sharma K, Stevens HY, Boerckel JD, Garcia AJ, Guldberg RE. Human stem cell delivery for treatment of large segmental bone defects. Proc Natl Acad Sci USA. 2010;107:3305–10. doi: 10.1073/pnas.0905444107. [DOI] [PMC free article] [PubMed] [Google Scholar]
- 60.Hsiao JK, Tsai CP, Chung TH, Hung Y, Yao M, Liu HM, Mou CY, Yang CS, Chen YC, Huang DM. Mesoporous silica nanoparticles as a delivery system of gadolinium for effective human stem cell tracking. Small. 2008;4:1445–52. doi: 10.1002/smll.200701316. [DOI] [PubMed] [Google Scholar]
- 61.Kim T, et al. Mesoporous silica-coated hollow manganese oxide nanoparticles as positive T1 contrast agents for labeling and MRI tracking of adipose-derived mesenchymal stem cells. J Am Chem Soc. 2011;133:2955–61. doi: 10.1021/ja1084095. [DOI] [PMC free article] [PubMed] [Google Scholar]
- 62.Loebinger MR, Kyrtatos PG, Turmaine M, Price AN, Pankhurst Q, Lythgoe MF, Janes SM. Magnetic resonance imaging of mesenchymal stem cells homing to pulmonary metastases using biocompatible magnetic nanoparticles. Cancer Res. 2009;69:8862–7. doi: 10.1158/0008-5472.CAN-09-1912. [DOI] [PMC free article] [PubMed] [Google Scholar]
- 63.Kim YJ, Huh YM, Choe KO, Choi BW, Choi EJ, Jang Y, Lee JM, Suh JS. In vivo magnetic resonance imaging of injected mesenchymal stem cells in rat myocardial infarction; simultaneous cell tracking and left ventricular function measurement. Int J Cardiovasc Imag. 2009;25:99–109. doi: 10.1007/s10554-008-9407-0. [DOI] [PubMed] [Google Scholar]
- 64.Hathout E, Chan NK, Tan A, Sakata N, Mace J, Pearce W, Peverini R, Chinnock R, Sowers L, Obenaus A. In vivo imaging demonstrates a time-line for new vessel formation in islet transplantation. Pediatr Transpl. 2009;13:892–7. doi: 10.1111/j.1399-3046.2008.01088.x. [DOI] [PMC free article] [PubMed] [Google Scholar]
- 65.Ittrich H, Lange C, Togel F, Zander AR, Dahnke H, Westenfelder C, Adam G, Nolte-Ernsting C. In vivo magnetic resonance imaging of iron oxide-labeled, arterially-injected mesenchymal stem cells in kidneys of rats with acute ischemic kidney injury: detection and monitoring at 3 T. J Magn Reson Imag. 2007;25:1179–91. doi: 10.1002/jmri.20925. [DOI] [PubMed] [Google Scholar]
- 66.Amsalem Y, et al. Iron-oxide labeling and outcome of transplanted mesenchymal stem cells in the infarcted myocardium. Circulation. 2007;116:I38–45. doi: 10.1161/CIRCULATIONAHA.106.680231. [DOI] [PubMed] [Google Scholar]
- 67.Pankhurst QA, Connolly J, Jones SK, Dobson J. Applications of magnetic nanoparticles in biomedicine. J Phys D: Appl Phys. 2003;36:R167–81. [Google Scholar]
- 68.Xu CJ, Sun S. Superparamagnetic nanoparticles as targeted probes for diagnostic and therapeutic applications. Dalton Trans. 2009;29:5583–91. doi: 10.1039/b900272n. [DOI] [PMC free article] [PubMed] [Google Scholar]
- 69.Chen M, Liu JP, Sun S. One-step synthesis of FePt nanoparticles with tunable size. J Am Chem Soc. 2004;126:8394–5. doi: 10.1021/ja047648m. [DOI] [PubMed] [Google Scholar]
- 70.Sun S, Murray CB, Weller D, Folks L, Moser A. Monodisperse FePt nanoparticles and ferromagnetic FePt nanocrystal superlattices. Science. 2000;287:1989–92. doi: 10.1126/science.287.5460.1989. [DOI] [PubMed] [Google Scholar]
- 71.Jun YW, et al. Nanoscale size effect of magnetic nanocrystals and their utilization for cancer diagnosis via magnetic resonance imaging. J Am Chem Soc. 2005;127:5732–3. doi: 10.1021/ja0422155. [DOI] [PubMed] [Google Scholar]
- 72.Lee JH, et al. Artificially engineered magnetic nanoparticles for ultra-sensitive molecular imaging. Nat Med. 2007;13:95–9. doi: 10.1038/nm1467. [DOI] [PubMed] [Google Scholar]
- 73.Basti H, Ben Tahar L, Smiri LS, Herbst F, Vaulay MJ, Chau F, Ammar S, Benderbous S. Catechol derivatives-coated Fe3O4 and gamma-Fe2O3 nanoparticles as potential MRI contrast agents. J Colloid Interface Sci. 2010;341:248–54. doi: 10.1016/j.jcis.2009.09.043. [DOI] [PubMed] [Google Scholar]
- 74.Perez JM, Josephson L, O’Loughlin T, Hogemann D, Weissleder R. Magnetic relaxation switches capable of sensing molecular interactions. Nat Biotechnol. 2002;20:816–20. doi: 10.1038/nbt720. [DOI] [PubMed] [Google Scholar]
- 75.Xie X, Zhang C. Controllable assembly of hydrophobic superparamagnetic iron oxide nanoparticle with mPEG-PLA copolymer and its effect on MR transverse relaxation rate. J Nanomater. 2011:1–7. [Google Scholar]
- 76.Veiseh O, Gunn JW, Zhang M. Design and fabrication of magnetic nanoparticles for targeted drug delivery and imaging. Adv Drug Deliv Rev. 2010;62:284–304. doi: 10.1016/j.addr.2009.11.002. [DOI] [PMC free article] [PubMed] [Google Scholar]
- 77.Xu C, Sun S. Monodisperse magnetic nanoparticles for biomedical applications. Polym Int. 2007;6:821–6. [Google Scholar]
- 78.Xu C, Xie J, Ho D, Wang C, Kohler N, Walsh EG, Morgan JR, Chin YE, Sun S. Au–Fe3O4 dumbbell nanoparticles as dual-functional probes. Angew Chem—Int Edn. 2008;47:173–6. doi: 10.1002/anie.200704392. [DOI] [PMC free article] [PubMed] [Google Scholar]
- 79.Huh Y-M, et al. In vivo magnetic resonance detection of cancer by using multifunctional magnetic nanocrystals. J Am Chem Soc. 2005;127:12387–91. doi: 10.1021/ja052337c. [DOI] [PubMed] [Google Scholar]
- 80.Insin N, Tracy JB, Lee H, Zimmer JP, Westervelt RM, Bawendi MG. Incorporation of iron oxide nanoparticles and quantum dots into silica microspheres. ACS Nano. 2008;2:197–202. doi: 10.1021/nn700344x. [DOI] [PubMed] [Google Scholar]
- 81.Xie J, Peng S, Brower NP, Wang S, Sun S. One-pot synthesis of monodisperse iron oxide nanoparticles for potential biomedical applications. Pure Appl Chem. 2006;78:1003–14. [Google Scholar]
- 82.Huang DM, et al. Highly efficient cellular labeling of mesoporous nanoparticles in human mesenchymal stem cells: implication for stem cell tracking. FASEB J. 2005;19:2014–6. doi: 10.1096/fj.05-4288fje. [DOI] [PubMed] [Google Scholar]
- 83.Nkansah MK, Thakral D, Shapiro EM. Magnetic poly(lactide-co-glycolide) and cellulose particles for MRI-based cell tracking. Magn Reson Med. 2011;65:1776–85. doi: 10.1002/mrm.22765. [DOI] [PMC free article] [PubMed] [Google Scholar]
- 84.Lee ES, et al. Microgel iron oxide nanoparticles for tracking human fetal mesenchymal stem cells through magnetic resonance imaging. Stem Cells. 2009;27:1921–31. doi: 10.1002/stem.112. [DOI] [PubMed] [Google Scholar]
- 85.Xie J, Xu C, Kohler N, Hou Y, Sun S. Controlled PEGylation of monodisperse Fe3O4 nanoparticles for reduced non-specific uptake by macrophage cells. Adv Mater. 2007;19:3163–6. [Google Scholar]
- 86.Petros RA, DeSimone JM. Strategies in the design of nanoparticles for therapeutic applications. Nat Rev Drug Discov. 2010;9:615–27. doi: 10.1038/nrd2591. [DOI] [PubMed] [Google Scholar]
- 87.Murphy RJ, Pristinski D, Migler K, Douglas JF, Prabhu VM. Dynamic light scattering investigations of nanoparticle aggregation following a light-induced pH jump. J Chem Phys. 2010;132:194903. doi: 10.1063/1.3425883. [DOI] [PubMed] [Google Scholar]
- 88.Soenen SJ, Himmelreich U, Nuytten N, Pisanic TR, II, Ferrari A, De Cuyper M. Intracellular nanoparticle coating stability determines nanoparticle diagnostics efficacy and cell functionality. Small. 2010;6:2136–45. doi: 10.1002/smll.201000763. [DOI] [PubMed] [Google Scholar]
- 89.Xu C, Yuan Z, Kohler N, Kim J, Chung MA, Sun S. FePt nanoparticles as an Fe reservoir for controlled Fe release and tumor inhibition. J Am Chem Soc. 2009;131:15346–51. doi: 10.1021/ja905938a. [DOI] [PMC free article] [PubMed] [Google Scholar]
- 90.Mahendra S, Zhu H, Colvin VL, Alvarez PJ. Quantum dot weathering results in microbial toxicity. Environ Sci Technol. 2008;42:9424–30. doi: 10.1021/es8023385. [DOI] [PubMed] [Google Scholar]
- 91.Chang E, Thekkek N, Yu WW, Colvin VL, Drezek R. Evaluation of quantum dot cytotoxicity based on intracellular uptake. Small. 2006;2:1412–7. doi: 10.1002/smll.200600218. [DOI] [PubMed] [Google Scholar]
- 92.Derfus AM, Chan WCW, Bhatia SN. Probing the cytotoxicity of semiconductor quantum dots. Nano Lett. 2004;4:11–8. doi: 10.1021/nl0347334. [DOI] [PMC free article] [PubMed] [Google Scholar]
- 93.Verma A, Stellacci F. Effect of surface properties on nanoparticle–cell interactions. Small. 2010;6:12–21. doi: 10.1002/smll.200901158. [DOI] [PubMed] [Google Scholar]
- 94.Lorenz MR, Holzapfel V, Musyanovych A, Nothelfer K, Walther P, Frank H, Landfester K, Schrezenmeier H, Mailänder V. Uptake of functionalized, fluorescent-labeled polymeric particles in different cell lines and stem cells. Biomaterials. 2006;27:2820–8. doi: 10.1016/j.biomaterials.2005.12.022. [DOI] [PubMed] [Google Scholar]
- 95.Cho EC, Xie J, Wurm PA, Xia Y. Understanding the role of surface charges in cellular adsorption versus internalization by selectively removing gold nanoparticles on the cell surface with a I2/KI etchant. Nano Lett. 2009;9:1080–4. doi: 10.1021/nl803487r. [DOI] [PubMed] [Google Scholar]
- 96.Chung T-H, Wu S-H, Yao M, Lu C-W, Lin Y-S, Hung Y, Mou C-Y, Chen Y-C, Huang D-M. The effect of surface charge on the uptake and biological function of mesoporous silica nanoparticles in 3T3-L1 cells and human mesenchymal stem cells. Biomaterials. 2007;28:2959–66. doi: 10.1016/j.biomaterials.2007.03.006. [DOI] [PubMed] [Google Scholar]
- 97.Abdullah S, Wendy-Yeo WY, Hosseinkhani H, Hosseinkhani M, Masrawa E, Ramasamy R, Rosli R, Rahman SA, Domb AJ. Gene transfer into the lung by nanoparticle dextran-spermine/plasmid DNA complexes. J Biomed Biotechnol. 2010:284840. doi: 10.1155/2010/284840. [DOI] [PMC free article] [PubMed] [Google Scholar]
- 98.Hosseinkhani H. DNA nanoparticles for gene delivery to cells and tissue. Int J Nanotechnol. 2006;3:416–61. [Google Scholar]
- 99.Hosseinkhani H, Tabata Y. Self assembly of DNA nanoparticles with polycations for the delivery of genetic materials into cells. J Nanosci Nanotechnol. 2006;6:2320–8. doi: 10.1166/jnn.2006.507. [DOI] [PubMed] [Google Scholar]
- 100.Hosseinkhani H, Hosseinkhani M, Gabrielson NP, Pack DW, Khademhosseini A, Kobayashi H. DNA nanoparticles encapsulated in 3D tissue-engineered scaffolds enhance osteogenic differentiation of mesenchymal stem cells. J Biomed Mater Res A. 2008;85A:47–60. doi: 10.1002/jbm.a.31327. [DOI] [PubMed] [Google Scholar]
- 101.Nel AE, Madler L, Velegol D, Xia T, Hoek EM, Somasundaran P, Klaessig F, Castranova V, Thompson M. Understanding biophysicochemical interactions at the nano-bio interface. Nat Mater. 2009;8:543–57. doi: 10.1038/nmat2442. [DOI] [PubMed] [Google Scholar]
- 102.Kim JA, Lee NH, Kim BH, Rhee WJ, Yoon S, Hyeon T, Park TH. Enhancement of neurite outgrowth in PC12 cells by iron oxide nanoparticles. Biomaterials. 2011;32:2871–7. doi: 10.1016/j.biomaterials.2011.01.019. [DOI] [PubMed] [Google Scholar]
- 103.Chen YC, Hsiao JK, Liu HM, Lai IY, Yao M, Hsu SC, Ko BS, Yang CS, Huang DM. The inhibitory effect of superparamagnetic iron oxide nanoparticle (Ferucarbotran) on osteogenic differentiation and its signaling mechanism in human mesenchymal stem cells. Toxicol Appl Pharmacol. 2010;245:272–9. doi: 10.1016/j.taap.2010.03.011. [DOI] [PubMed] [Google Scholar]
- 104.Kedziorek DA, Muja N, Walczak P, Ruiz-Cabello J, Gilad AA, Jie CC, Bulte JW. Gene expression profiling reveals early cellular responses to intracellular magnetic labeling with superparamagnetic iron oxide nanoparticles. Magn Reson Med. 2010;63:1031–43. doi: 10.1002/mrm.22290. [DOI] [PMC free article] [PubMed] [Google Scholar]
- 105.Shubayev VI, Pisanic TR, Ii, Jin S. Magnetic nanoparticles for theragnostics. Adv Drug Deliv Rev. 2009;61:467–77. doi: 10.1016/j.addr.2009.03.007. [DOI] [PMC free article] [PubMed] [Google Scholar]
- 106.Xing Y, Xiong W, Zhu L, Osawa E, Hussin S, Dai LM. DNA damage in embryonic stem cells caused by nanodiamonds. ACS Nano. 2011;5:2376–84. doi: 10.1021/nn200279k. [DOI] [PubMed] [Google Scholar]
- 107.Soenen SJH, Nuytten N, De Meyer SF, De Smedt SC, De Cuyper M. High intracellular iron oxide nanoparticle concentrations affect cellular cytoskeleton and focal adhesion kinase-mediated signaling. Small. 2010;6:832–42. doi: 10.1002/smll.200902084. [DOI] [PubMed] [Google Scholar]
- 108.Lee RH, Pulin AA, Seo MJ, Kota DJ, Ylostalo J, Larson BL, Semprun-Prieto L, Delafontaine P, Prockop DJ. Intravenous hMSCs improve myocardial infarction in mice because cells embolized in lung are activated to secrete the anti-inflammatory protein TSG-6. Cell Stem Cell. 2009;5:54–63. doi: 10.1016/j.stem.2009.05.003. [DOI] [PMC free article] [PubMed] [Google Scholar]
- 109.Kidd S, Spaeth E, Dembinski JL, Dietrich M, Watson K, Klopp A, Battula VL, Weil M, Andreeff M, Marini FC. Direct evidence of mesenchymal stem cell tropism for tumor and wounding microenvironments using in vivo bioluminescent imaging. Stem Cells. 2009;27:2614–23. doi: 10.1002/stem.187. [DOI] [PMC free article] [PubMed] [Google Scholar]
- 110.Khlebtsov N, Dykman L. Biodistribution and toxicity of engineered gold nanoparticles: a review of in vitro and in vivo studies. Chem Soc Rev. 2010;40:1647–71. doi: 10.1039/c0cs00018c. [DOI] [PubMed] [Google Scholar]
- 111.Dobrovolskaia MA, Germolec DR, Weaver JL. Evaluation of nanoparticle immunotoxicity. Nat Nanotechnol. 2009;4:411–4. doi: 10.1038/nnano.2009.175. [DOI] [PubMed] [Google Scholar]
- 112.Ottobrini L, Martelli C, Trabattoni DL, Clerici M, Lucignani G. In vivo imaging of immune cell trafficking in cancer. Eur J Nucl Med Mol Imag. 2011;38:949–68. doi: 10.1007/s00259-010-1687-7. [DOI] [PubMed] [Google Scholar]
- 113.Saudek F, Brogren CH, Manohar S. Imaging the beta-cell mass: why and how. Rev Diabet Stud. 2008;5:6–12. doi: 10.1900/RDS.2008.5.6. [DOI] [PMC free article] [PubMed] [Google Scholar]
- 114.Suzuki Y, Zhang S, Kundu P, Yeung AC, Robbins RC, Yang PC. In vitro comparison of the biological effects of three transfection methods for magnetically labeling mouse embryonic stem cells with ferumoxides. Magn Reson Med. 2007;57:1173–9. doi: 10.1002/mrm.21219. [DOI] [PubMed] [Google Scholar]
- 115.Park B-H, Jung J-C, Lee G-H, Kim T-J, Lee Y-J, Kim J-Y, Kim Y-W, Jeong J-H, Chang Y. Comparison of labeling efficiency of different magnetic nanoparticles into stem cell. Colloids Surf A. 2008;313/314:145–9. [Google Scholar]
- 116.Shapiro EM, Sharer K, Skrtic S, Koretsky AP. In vivo detection of single cells by MRI. Magn Reson Med. 2006;55:242–9. doi: 10.1002/mrm.20718. [DOI] [PubMed] [Google Scholar]
- 117.Shaw SY, Westly EC, Pittet MJ, Subramanian A, Schreiber SL, Weissleder R. Perturbational profiling of nanomaterial biologic activity. Proc Natl Acad Sci USA. 2008;105:7387–92. doi: 10.1073/pnas.0802878105. [DOI] [PMC free article] [PubMed] [Google Scholar]
- 118.Sutton EJ, Henning TD, Pichler BJ, Bremer C, Daldrup-Link HE. Cell tracking with optical imaging. Eur Radiol. 2008;18:2021–32. doi: 10.1007/s00330-008-0984-z. [DOI] [PubMed] [Google Scholar]
- 119.Fujimoto JG, Farkas DL. Biomedical Optical Imaging. Oxford: Oxford University Press; 2009. [Google Scholar]
- 120.Obonyo O, Fisher E, Edwards M, Douroumis D. Quantum dots synthesis and biological applications as imaging and drug delivery systems. Crit Rev Biotechnol. 2010;30:283–301. doi: 10.3109/07388551.2010.487184. [DOI] [PubMed] [Google Scholar]
- 121.Fu A, Gu W, Larabell C, Alivisatos AP. Semiconductor nanocrystals for biological imaging. Curr Opin Neurobiol. 2005;15:568–75. doi: 10.1016/j.conb.2005.08.004. [DOI] [PubMed] [Google Scholar]
- 122.Kubis N, et al. Vascular fate of adipose tissue-derived adult stromal cells in the ischemic murine brain: a combined imaging-histological study. Neuroimage. 2007;34:1–11. doi: 10.1016/j.neuroimage.2006.09.014. [DOI] [PubMed] [Google Scholar]
- 123.Trombetta ES, Mellman I. Cell biology of antigen processing in vitro and in vivo. Annu Rev Immunol. 2005;23:975–1028. doi: 10.1146/annurev.immunol.22.012703.104538. [DOI] [PubMed] [Google Scholar]
- 124.Tavare R, et al. Monitoring of in vivo function of superparamagnetic iron oxide labelled murine dendritic cells during anti-tumour vaccination. PLoS ONE. 2011:6. doi: 10.1371/journal.pone.0019662. [DOI] [PMC free article] [PubMed] [Google Scholar]
- 125.Bentolila LA, Ebenstein Y, Weiss S. Quantum dots for in vivo small-animal imaging. J Nucl Med. 2009;50:493–6. doi: 10.2967/jnumed.108.053561. [DOI] [PMC free article] [PubMed] [Google Scholar]
- 126.Yagi H, Soto-Gutierrez A, Parekkadan B, Kitagawa Y, Tompkins RG, Kobayashi N, Yarmush ML. Mesenchymal stem cells: mechanisms of immunomodulation and homing. Cell Transpl. 2010;19:667–79. doi: 10.3727/096368910X508762. [DOI] [PMC free article] [PubMed] [Google Scholar]
- 127.Hardman R. A toxicologic review of quantum dots: toxicity depends on physicochemical and environmental factors. Environ Health Perspect. 2006;114:165–72. doi: 10.1289/ehp.8284. [DOI] [PMC free article] [PubMed] [Google Scholar]
- 128.Ow H, Larson DR, Srivastava M, Baird BA, Webb WW, Wiesner U. Bright and stable core–shell fluorescent silica nanoparticles. Nano Lett. 2005;5:113–7. doi: 10.1021/nl0482478. [DOI] [PubMed] [Google Scholar]
- 129.Buxton RB. Introduction to Functional Magnetic Resonance Imaging: Principles and Techniques. Cambridge: Cambridge University Press; 2009. [Google Scholar]
- 130.Uecker M, Zhang S, Voit D, Karaus A, Merboldt K-D, Frahm J. Real-time MRI at a resolution of 20 ms. NMR Biomed. 2010;23:986–94. doi: 10.1002/nbm.1585. [DOI] [PubMed] [Google Scholar]
- 131.Levitt MH. Spin Dynamics: Basics of Nuclear Magnetic Resonance. Chichester: Wiley; 2008. [Google Scholar]
- 132.Waters E, Wickline S. Contrast agents for MRI. Basic Res Cardiol. 2008;103:114–21. doi: 10.1007/s00395-008-0711-6. [DOI] [PubMed] [Google Scholar]
- 133.Hao R, Xing R, Xu Z, Hou Y, Gao S, Sun S. Synthesis, functionalization, and biomedical applications of multifunctional magnetic nanoparticles. Adv Mater. 2010;22:2729–42. doi: 10.1002/adma.201000260. [DOI] [PubMed] [Google Scholar]
- 134.Bos C, et al. In vivo MR imaging of intravascularly injected magnetically labeled mesenchymal stem cells in rat kidney and liver. Radiology. 2004;233:781–9. doi: 10.1148/radiol.2333031714. [DOI] [PubMed] [Google Scholar]
- 135.Bulte JW. In vivo MRI cell tracking: clinical studies. AJR Am J Roentgenol. 2009;193:314–25. doi: 10.2214/AJR.09.3107. [DOI] [PMC free article] [PubMed] [Google Scholar]
- 136.Sadan O, Shemesh N, Barzilay R, Bahat-Stromza M, Melamed E, Cohen Y, Offen D. Migration of neurotrophic factors-secreting mesenchymal stem cells toward a quinolinic acid lesion as viewed by magnetic resonance imaging. Stem Cells. 2008;26:2542–51. doi: 10.1634/stemcells.2008-0240. [DOI] [PubMed] [Google Scholar]
- 137.Athiraman H, et al. Investigation of relationships between transverse relaxation rate, diffusion coefficient, and labeled cell concentration in ischemic rat brain using MRI. Magn Reson Med. 2009;61:587–94. doi: 10.1002/mrm.21480. [DOI] [PMC free article] [PubMed] [Google Scholar]
- 138.Jirak D, Kriz J, Herynek V, Andersson B, Girman P, Burian M, Saudek F, Hajek M. MRI of transplanted pancreatic islets. Magn Reson Med. 2004;52:1228–33. doi: 10.1002/mrm.20282. [DOI] [PubMed] [Google Scholar]
- 139.Evgenov NV, Medarova Z, Dai G, Bonner-Weir S, Moore A. In vivo imaging of islet transplantation. Nat Med. 2006;12:144–8. doi: 10.1038/nm1316. [DOI] [PubMed] [Google Scholar]
- 140.Hathout E, Sowers L, Wang R, Tan A, Mace J, Peverini R, Chinnock R, Obenaus A. In vivo magnetic resonance imaging of vascularization in islet transplantation. Transpl Int. 2007;20:1059–65. doi: 10.1111/j.1432-2277.2007.00550.x. [DOI] [PMC free article] [PubMed] [Google Scholar]
- 141.de Vries IJ, et al. Magnetic resonance tracking of dendritic cells in melanoma patients for monitoring of cellular therapy. Nat Biotechnol. 2005;23:1407–13. doi: 10.1038/nbt1154. [DOI] [PubMed] [Google Scholar]
- 142.Zhu J, Zhou L, Xing Wu F. Tracking neural stem cells in patients with brain trauma. N Engl J Med. 2006;355:2376–8. doi: 10.1056/NEJMc055304. [DOI] [PubMed] [Google Scholar]
- 143.Brown MA, Semelka RC. MRI: Basic Principles and Applications. New York: Wiley–Liss; 1999. [Google Scholar]
- 144.Modo MMJJ, Bulte JWM. Molecular and Cellular MR Imaging. Boca Raton, FL: CRC Press; 2007. [Google Scholar]
- 145.Vuu K, Xie JW, McDonald MA, Bernardo M, Hunter F, Zhang YT, Li K, Bednarski M, Guccione S. Gadolinium–rhodamine nanoparticles for cell labeling and tracking via magnetic resonance and optical imaging. Bioconjug Chem. 2005;16:995–9. doi: 10.1021/bc050085z. [DOI] [PubMed] [Google Scholar]
- 146.Tran LA, Krishnamurthy R, Muthupillai R, Cabreira-Hansen MD, Willerson JT, Perin EC, Wilson LJ. Gadonanotubes as magnetic nanolabels for stem cell detection. Biomaterials. 2010;31:9482–91. doi: 10.1016/j.biomaterials.2010.08.034. [DOI] [PMC free article] [PubMed] [Google Scholar]
- 147.Ishibashi H, Hirao K, Yamaguchi J, Nabekura J. Inhibition of chloride outward transport by gadolinium in cultured rat spinal cord neurons. Neurotoxicology. 2009;30:155–9. doi: 10.1016/j.neuro.2008.10.003. [DOI] [PubMed] [Google Scholar]
- 148.Chen IY, Wu JC. Cardiovascular molecular imaging: focus on clinical translation. Circulation. 2011;123:425–43. doi: 10.1161/CIRCULATIONAHA.109.916338. [DOI] [PMC free article] [PubMed] [Google Scholar]
- 149.Weaner LE, Hoerr DC. Fundamentals of Early Clinical Drug Development. New York: Wiley; 2006. pp. 189–214. [Google Scholar]
- 150.Lewellen TK. Recent developments in PET detector technology. Phys Med Biol. 2008;53:R287–317. doi: 10.1088/0031-9155/53/17/R01. [DOI] [PMC free article] [PubMed] [Google Scholar]
- 151.Massoud TF, Gambhir SS. Molecular imaging in living subjects: seeing fundamental biological processes in a new light. Genes Develop. 2003;17:545–80. doi: 10.1101/gad.1047403. [DOI] [PubMed] [Google Scholar]
- 152.Welling MM, Duijvestein M, Signore A, van der Weerd L. In vivo biodistribution of stem cells using molecular nuclear medicine imaging. J Cell Physiol. 2011;226:1444–52. doi: 10.1002/jcp.22539. [DOI] [PubMed] [Google Scholar]
- 153.Blocklet D, et al. Myocardial homing of nonmobilized peripheral-blood CD34(+) cells after intracoronary injection. Stem Cells. 2006;24:333–6. doi: 10.1634/stemcells.2005-0201. [DOI] [PubMed] [Google Scholar]
- 154.Townsend DW. Multimodality imaging of structure and function. Phys Med Biol. 2008;53:R1–39. doi: 10.1088/0031-9155/53/4/R01. [DOI] [PubMed] [Google Scholar]
- 155.Rossin R, Muro S, Welch MJ, Muzykantov VR, Schuster DP. In vivo imaging of Cu-64-labeled polymer nanoparticles targeted to the lung endothelium. J Nucl Med. 2008;49:103–11. doi: 10.2967/jnumed.107.045302. [DOI] [PubMed] [Google Scholar]
- 156.Cai WB, Chen K, Li ZB, Gambhir SS, Chen XY. Dual-function probe for PET and near-infrared fluorescence imaging of tumor vasculature. J Nucl Med. 2007;48:1862–70. doi: 10.2967/jnumed.107.043216. [DOI] [PubMed] [Google Scholar]
- 157.Shokeen M, Anderson CJ. Molecular imaging of cancer with copper-64 radiopharmaceuticals and positron emission tomography (PET) Acc Chem Res. 2009;42:832–41. doi: 10.1021/ar800255q. [DOI] [PMC free article] [PubMed] [Google Scholar]
- 158.Patel D, Kell A, Simard B, Xiang B, Lin HY, Tian G. The cell labeling efficacy, cytotoxicity and relaxivity of copper-activated MRI/PET imaging contrast agents. Biomaterials. 2011;32:1167–76. doi: 10.1016/j.biomaterials.2010.10.013. [DOI] [PubMed] [Google Scholar]
- 159.Stelter L, et al. Modification of aminosilanized superparamagnetic nanoparticles: feasibility of multimodal detection using 3 T MRI, small animal PET, and fluorescence imaging. Mol Imag Biol. 2009;12:25–34. doi: 10.1007/s11307-009-0237-9. [DOI] [PubMed] [Google Scholar]
- 160.Luciani N, Wilhelm C, Gazeau F. The role of cell-released microvesicles in the intercellular transfer of magnetic nanoparticles in the monocyte/macrophage system. Biomaterials. 2010;31:7061–9. doi: 10.1016/j.biomaterials.2010.05.062. [DOI] [PubMed] [Google Scholar]
- 161.Pawelczyk E, Jordan EK, Balakumaran A, Chaudhry A, Gormley N, Smith M, Lewis BK, Childs R, Robey PG, Frank JA. In vivo transfer of intracellular labels from locally implanted bone marrow stromal cells to resident tissue macrophages. PLoS ONE. 2009;4:e6712. doi: 10.1371/journal.pone.0006712. [DOI] [PMC free article] [PubMed] [Google Scholar]
- 162.Berman SC, Galpoththawela C, Gilad AA, Bulte JWM, Walczak P. Long-term MR cell tracking of neural stem cells grafted in immunocompetent versus immunodeficient mice reveals distinct differences in contrast between live and dead cells. Magn Reson Med. 2011;65:564–74. doi: 10.1002/mrm.22613. [DOI] [PMC free article] [PubMed] [Google Scholar]
- 163.Cromer Berman SM, Walczak P, Bulte JWM. Tracking stem cells using magnetic nanoparticles. WIREs Nanomed Nanobiotechnol. 2011;3:343–55. doi: 10.1002/wnan.140. [DOI] [PMC free article] [PubMed] [Google Scholar]
- 164.Neri M, Maderna C, Cavazzin C, Deidda-Vigoriti V, Politi LS, Scotti G, Marzola P, Sbarbati A, Vescovi AL, Gritti A. Efficient in vitro labeling of human neural precursor cells with superparamagnetic iron oxide particles: relevance for in vivo cell tracking. Stem Cells. 2008;26:505–16. doi: 10.1634/stemcells.2007-0251. [DOI] [PubMed] [Google Scholar]
- 165.Kraitchman DL, Bulte JWM. Imaging of stem cells using MRI. Basic Res Cardiol. 2008;103:105–13. doi: 10.1007/s00395-008-0704-5. [DOI] [PMC free article] [PubMed] [Google Scholar]
- 166.Harrison PM, Arosio P. The ferritins: molecular properties, iron storage function and cellular regulation. Biochim Biophys Acta (BBA)-Bioenerg. 1996;1275:161–203. doi: 10.1016/0005-2728(96)00022-9. [DOI] [PubMed] [Google Scholar]
- 167.Bazylinski DA, Frankel RB. Magnetosome formation in prokaryotes. Nat Rev Microbiol. 2004;2:217–30. doi: 10.1038/nrmicro842. [DOI] [PubMed] [Google Scholar]
- 168.Zurkiya O, Chan AWS, Hu X. MagA is sufficient for producing magnetic nanoparticles in mammalian cells, making it an MRI reporter. Magn Reson Med. 2008;59:1225–31. doi: 10.1002/mrm.21606. [DOI] [PMC free article] [PubMed] [Google Scholar]
- 169.Tokar B. Redesigning Life?: The Worldwide Challenge to Genetic Engineering. London: Zed Books; 2001. [Google Scholar]
- 170.Shapiro EM, Skrtic S, Sharer K, Hill JM, Dunbar CE, Koretsky AP. MRI detection of single particles for cellular imaging. Proc Natl Acad Sci USA. 2004;101:10901–6. doi: 10.1073/pnas.0403918101. [DOI] [PMC free article] [PubMed] [Google Scholar]
- 171.Bulte JWM, et al. Magnetodendrimers allow endosomal magnetic labeling and in vivo tracking of stem cells. Nat Biotech. 2001;19:1141–7. doi: 10.1038/nbt1201-1141. [DOI] [PubMed] [Google Scholar]
- 172.Hoehn M, Wiedermann D, Justicia C, Ramos-Cabrer P, Kruttwig K, Farr T, Himmelreich U. Cell tracking using magnetic resonance imaging. J Physiol. 2007;584:25–30. doi: 10.1113/jphysiol.2007.139451. [DOI] [PMC free article] [PubMed] [Google Scholar]
- 173.Cao F, et al. In vivo visualization of embryonic stem cell survival, proliferation, and migration after cardiac delivery. Circulation. 2006;113:1005–14. doi: 10.1161/CIRCULATIONAHA.105.588954. [DOI] [PMC free article] [PubMed] [Google Scholar]
- 174.Cohen B, Dafni H, Meir G, Harmelin A, Neeman M. Ferritin as an endogenous MRI reporter for noninvasive imaging of gene expression in C6 glioma tumors. Neoplasia. 2005;7:109–17. doi: 10.1593/neo.04436. [DOI] [PMC free article] [PubMed] [Google Scholar]
- 175.Zhao W, et al. Cell surface sensors for real-time probing of cellular environments. Nat Nanotechnol. 2011 doi: 10.1038/NNANO.2011.101. [DOI] [PMC free article] [PubMed] [Google Scholar]