

Current automatic genomic screens for noncoding RNAs (ncRNAs) predict a large number of genomic regions containing potential structural ncRNAs because they rely on sequence-based multiple sequence alignments, which regularly misalign RNA structure and therefore do not support identification of structural similarities. The authors compute columnwise and global reliabilities of alignments based on sequence and structure similarity and provide a versatile tool for the manual and automatic analysis of ncRNAs. The ready-to-use software tool LocARNA-P produces structure-based multiple RNA alignments, a web server, and the software package.
Keywords: de novo prediction of RNA, reliability of structural alignment, simultaneous alignment and folding
Abstract
Current genomic screens for noncoding RNAs (ncRNAs) predict a large number of genomic regions containing potential structural ncRNAs. The analysis of these data requires highly accurate prediction of ncRNA boundaries and discrimination of promising candidate ncRNAs from weak predictions. Existing methods struggle with these goals because they rely on sequence-based multiple sequence alignments, which regularly misalign RNA structure and therefore do not support identification of structural similarities. To overcome this limitation, we compute columnwise and global reliabilities of alignments based on sequence and structure similarity; we refer to these structure-based alignment reliabilities as STARs. The columnwise STARs of alignments, or STAR profiles, provide a versatile tool for the manual and automatic analysis of ncRNAs. In particular, we improve the boundary prediction of the widely used ncRNA gene finder RNAz by a factor of 3 from a median deviation of 47 to 13 nt. Post-processing RNAz predictions, LocARNA-P's STAR score allows much stronger discrimination between true- and false-positive predictions than RNAz's own evaluation. The improved accuracy, in this scenario increased from AUC 0.71 to AUC 0.87, significantly reduces the cost of successive analysis steps. The ready-to-use software tool LocARNA-P produces structure-based multiple RNA alignments with associated columnwise STARs and predicts ncRNA boundaries. We provide additional results, a web server for LocARNA/LocARNA-P, and the software package, including documentation and a pipeline for refining screens for structural ncRNA, at http://www.bioinf.uni-freiburg.de/Supplements/LocARNA-P/.
INTRODUCTION
Starting with findings of catalytic RNA (Guerrier-Takada et al. 1983) and taking off with the discovery of microRNAs (Lagos-Quintana et al. 2001; Lau et al. 2001; Lee and Ambros 2001) and the advent of genome-wide transcriptomics (Bertone et al. 2004; Cheng et al. 2005; The FANTOM Consortium et al. 2005), it has become obvious that RNA's crucial role in living cells extends far beyond being a mere template for protein biosynthesis. Indeed, the majority of transcripts might have primarily regulatory functions (Mattick et al. 2009). Elucidating the functional roles of many newly discovered noncoding RNAs (ncRNAs) has thus become a central research interest in molecular biology.
The function of many ncRNAs is determined by their secondary structure rather than their sequence. Such structural ncRNAs can therefore be detected by their stable and evolutionarily conserved secondary structures. Recent advances in computational RNomics originated numerous approaches for this purpose (Rivas and Eddy 2001; Coventry et al. 2004; Washietl and Hofacker 2004; Washietl et al. 2005a; Pedersen et al. 2006; Torarinsson et al. 2006; Uzilov et al. 2006; Yao et al. 2006; Bompfünewerer et al. 2008). Among these methods, EvoFold (Pedersen et al. 2006) and RNAz (Washietl et al. 2005a,b; Gruber et al. 2010) are efficient enough to be applied to genome-wide surveys in mammals (Washietl et al. 2005b; Pedersen et al. 2006) and other metazoan clades (Missal et al. 2005, 2006).
The fast approaches EvoFold and RNAz rely on the given sequence-based whole-genome alignment; they cannot correct potential misalignments, which prevent them from identifying conserved RNA structure. The idea of revising the alignment for ncRNA prediction, pioneered by MSARi (Coventry et al. 2004), is also realized in the EM-based approach CMfinder (Yao et al. 2006), which extends the idea from local sequence motif finders such as MEME to the problem of finding local RNA structure motifs. Due to its high computational demands, CMfinder has never been applied to whole eukaryotic genomes; for example, in (Torarinsson et al. 2008), it has been applied to the ENCODE region, covering only 1% of the human genome.
Whereas EvoFold applies stochastic context-free grammars (SCFGs), an approach pioneered by qrna (Rivas and Eddy 2001), RNAz is based on the evaluation of folding thermodynamics and covariance. Both approaches classify input alignments either as nonstructural or as possessing a common RNA secondary structure.
Mainly motivated by efficiency reasons, both approaches rely on sequence-based multiple alignments. However, because RNA structure is often more conserved than sequence, sequence similarity can be weak even within well-established RNA families. Thus, many ncRNAs cannot be aligned well by pure sequence-based techniques, which fail for structural RNAs at pairwise sequence identities <60% (Gardner et al. 2005). Various algorithmic approaches have been introduced to determine structural similarities and to derive consensus structure patterns for structural RNAs with low sequence identity (Sankoff 1985; Gorodkin et al. 1997; Mathews and Turner 2002; Höchsmann et al. 2003; Hofacker and Stadler 2004; Havgaard et al. 2005; Siebert and Backofen 2005; Will et al. 2007; Bradley et al. 2008).
The first practical approaches for structure-based multiple alignment, e.g., RNAforester (Höchsmann et al. 2003) and MARNA (Siebert and Backofen 2005), depend on predicted or known secondary structures. In practice, however, these approaches are limited by the low accuracy of structure prediction from single sequences. This dilemma is overcome only by simultaneously computing an alignment and the common secondary structure of two aligned sequences; the general problem was first solved by Sankoff (1985). The high complexity of the general problem is prohibitive for practical applications of this algorithm. Therefore, variants of Sankoff's algorithm introduce simplifications of the general problem; there are two main classes. Programs such as FoldAlign (Havgaard et al. 2005), dynalign (Mathews and Turner 2002), and Stemloc-AMA (Bradley et al. 2008) evaluate a loop-based energy model for RNA during the alignment; the expensive energy evaluation has to be compensated by strong, usually sequence-based heuristics.
In contrast, PMcomp (Hofacker and Stadler 2004) and LocARNA (Will et al. 2007) evaluate a more lightweight energy model during the alignment. To obtain good accuracy, the base-pair weights in the lightweight energy model are derived from base-pair probabilities in the single sequences (due to McCaskill's algorithm from McCaskill 1990). By moving the expensive evaluation of the full-featured energy model to the pre-computation phase, the total computational cost is reduced significantly. Furthermore, one can ignore very unlikely base pairs without compromising the alignment accuracy. This reduces the complexity of these approaches effectively without requiring sequence-based heuristics, since most of the potential base pairs in RNA ensembles are improbable. This is called “sparsity at the structure level” since RNA base-pair probability matrices are sparse, i.e., they have only few significant entries.
We see the largest potential benefits of structure-based multiple alignment in its application to de novo prediction of structural ncRNA. There, it can overcome the fundamental limitations of ncRNA prediction approaches that rely on sequence-based alignment. However, there have been two caveats that prevented its application. First, many approaches need to use a sliding-window technique because the boundaries of the ncRNAs are not known in advance. This technique can result in poor structure models due to an inaccurate folding context. Second, structure-based alignment has been computationally too demanding for genome-wide screens.
To overcome these limitations, we propose a new pipeline for structural ncRNA gene finding that uses fast ncRNA finders like RNAz as a first filter. The coarsely predicted loci are then extended by genomic context and further analyzed using the novel multiple sequence–structure alignment approach LocARNA-P. LocARNA-P enables automated analyses of multiple sequence–structure alignments that as of yet have required manual inspection by experts; typically such analysis tasks are assessing the overall alignment quality or finding the most reliably structurally aligned regions for locating putative ncRNAs. For the purpose of automated analysis, LocARNA-P provides fine-grained as well as total reliability measures for structure-based alignments, which we call STARs (structure-based alignment reliabilities). STARs can be used for several important tasks in this pipeline, namely, for (1) detecting clusters of structural ncRNAs predicted as putative ncRNA-containing regions by the ncRNA gene finder, (2) determining accurate ncRNA boundaries using alignment reliabilities based on sequence and structural similarity, and (3) improving the predictive power of ncRNA gene finding.
While more conventional RNA alignment methods, including LocARNA, compute “only” a multiple alignment based on sequence and structure similarity, LocARNA-P additionally computes columnwise and global STARs based on sequence and structural match probabilities. This enables various further analysis and can even improve the multiple alignment quality. From LocARNA, LocARNA-P inherits its accurate scoring model and parts of its algorithmic structure. To allow large-scale applicability, a major design goal of the LocARNA-P algorithm has been to preserve the low time and space demands of LocARNA for the more involved task of computing STARs. We emphasize that the time for computing STARs by a straightforward, non-optimized algorithm grows with the sixth power of the sequence length, which is prohibitive for most applications. Therefore, our approach is feasible for large-scale applications, only because we reduce the complexity by a quadratic factor.
While approaches like RAF (Do et al. 2005) and ExpaRNA (Heyne et al. 2009) aim at speeding up Sankoff-style alignment by means of further heuristics, the novelty of LocARNA-P is the efficient calculation of match probabilities and reliabilities (STARs), which introduces a novel quality to Sankoff-style alignment.
Note that pairwise match probabilities for sequence–structure alignments have been computed previously by Hofacker and Stadler (Hofacker et al. 2004) and Harmanci et al. (2008). However, we go far beyond these approaches in terms of LocARNA-P's efficiency and the novel use of match probability for RNA analysis. In contrast to the previous approaches, which have not been evaluated on real-life data, LocARNA-P has been thoroughly benchmarked and is readily applicable to large-scale data sets.
For evaluating our approach, we predicted the gene boundaries on a data set of 287 RNAz predictions in fly (Rose et al. 2007) that coincide with the FlyBase structural ncRNA annotations of Drosophila melanogaster. In this data set, we improved the boundary prediction of RNAz significantly. Note that, for the purpose of this article, we refrained from predicting boundaries for the unannotated loci, since this would not strengthen our evaluation. Our boundary predictions reveal additional information about the genomic context of the ncRNAs. For instance, it detects 3′ or 5′ sequence–structure conservation in flanking regions. Notably, by examples and in a systematic study on all tRNA loci, we observe that predictions covering flanking regions reveal true signals in the majority of cases. Furthermore, the visualization of the STAR profiles that underlie our automatic predictions supports the interpretation by an expert. Finally, STAR profiles and boundary prediction produce a powerful measure for discriminating false and true positives in an ncRNA screen. We show that this measure significantly increases the specificity and sensitivity when post-processing an RNAz screen. Due to the large number of ncRNA predictions from a genomic screen, filtering ncRNA candidates for subsequent expensive experimental analysis is a highly relevant application.
RESULTS
Sequence–structure-based alignment reliability (STAR)
We define structure-based multiple alignment reliabilities based on pairwise match probabilities. For the case of sequence alignment, a probability-based reliability measure was introduced by the authors of Probcons (Do et al. 2008). Here, we extend this idea to structure-based alignment.
Initially, we consider two sequences, A and B, with their corresponding base-pair probability matrices. These matrices are usually calculated from the respective sequence by McCaskill's partition function approach (McCaskill 1990). We are going to compute a high-quality alignment of the two sequences, based on sequence and structure similarity, together with additional information on the confidence in the individual alignment columns and the predicted consensus structure; this confidence is expressed by columnwise STARs. These STARs facilitate the interpretation of the sequence–structure alignment and allow for further automated analysis. Technically, the computed sequence–structure alignment is a pair consisting of a sequence alignment  of A and B and a secondary structure
  of
of  . It is evaluated by a scoring function composed of sequence similarity and structure similarity.
  consists of a set of base matches written as i ∼ k, where i is a position in A, and k a position in B. The consensus secondary structure
  for an alignment
  consists of a set of arc matches (i, j) ∼ (k, l), where i ∼ k ∈
  and j ∼ l ∈
  are matches in A, and (i, j) and (k, l) are base pairs of respective sequences A and B.
We assign a similarity score to a pair ( ). It combines a log-odds score for the probabilities of matched base pairs with a Ribosum-like scoring of sequential matches (Klein and Eddy 2003) and uses affine gap cost. This scoring function provides substantial improvements over the original scoring function of LocARNA, which has been applied in Will et al. (2007). We call this function the LocARNA scoring function, since it is shared with the current version of LocARNA (see the Appendix for the formal definition).
Match probabilities
We are going to define probabilities of single base matches and arc matches in sequence–structure alignments. For this purpose, we define probabilities of pairs ( ) of alignment and consensus structure. Such probabilities are defined under the assumption of a Boltzmann distribution over pairs (
 ) that is based on the scoring of LocARNA.
Computing match probabilities via a statistical mechanics model has been introduced for sequence-based pairwise alignment by Probalign (Roshan and Livesay 2006). However, the analogous approach has not been considered for structure-based multiple alignment. By assuming a Boltzmann distribution, our approach differs from methods that obtain probabilities from generative models such as hidden Markov models (HMMs) or stochastic context-free grammars (SCFGs). Such methods produce structures with probabilities determined by given transition probabilities. The main advantage of the nongenerative approach taken here is that the underlying similarity scores have a more intuitive semantic.
The probability Pr[( )|A,B] of a pair of alignment and consensus structures (
 ) is calculated by dividing its Boltzmann weight by the total partition function. The Boltzmann weight is obtained as exp[−β Sc(
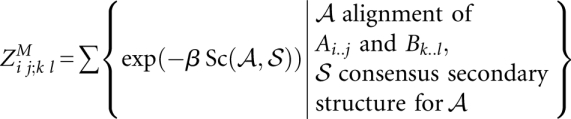
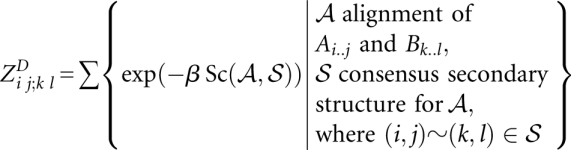
 )], where we apply the LocARNA scoring function Sc and control the distribution by the inverse temperature β. As usual, the total partition function ZAB is the sum over the Boltzmann weights of all pairs (
 ). Once the probability of a pair of alignment and consensus structures is defined, we can introduce base match and arc match probabilities. The probability of an arc match (i, j) ∼ (k, l), where (i, j) and (k, l) are respective base pairs of A and B, is defined as the sum of all probabilities of pairs (
 ) that contain this match. Similarly, the probability Pr[i ∼ k|A,B] of a base match i ∼ k is defined as the sum of the probabilities of all alignment consensus structure pairs matching the two bases Ai and Bk. For later use, we introduce an exclusive base match probability Pr[i ∼s
k|A,B] of a match i ∼ k that is not part of a structural match. Since a naive inside/outside algorithm could compute such probabilities only with prohibitively high complexity, it is crucial for our approach that we reduce this complexity significantly. Further details are provided in Materials and Methods and in the Appendix.
) that contain this match. Similarly, the probability Pr[i ∼ k|A,B] of a base match i ∼ k is defined as the sum of the probabilities of all alignment consensus structure pairs matching the two bases Ai and Bk. For later use, we introduce an exclusive base match probability Pr[i ∼s
k|A,B] of a match i ∼ k that is not part of a structural match. Since a naive inside/outside algorithm could compute such probabilities only with prohibitively high complexity, it is crucial for our approach that we reduce this complexity significantly. Further details are provided in Materials and Methods and in the Appendix.
Columnwise STARs, boundary prediction, and global STAR scores
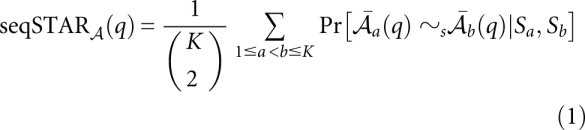
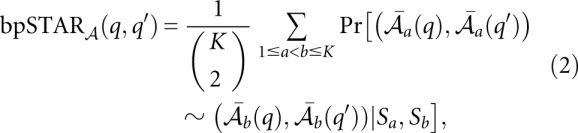
Based on the pairwise match probabilities, we define columnwise STARs for a multiple alignment  of K sequences S1,…,SK. The sequence reliability seqSTAR
 (q) of a column q and the base-pair reliability bpSTAR
 (q, q′) of a pair of columns q and q′ are defined as the average of all pairwise base match probabilities associated with column q, and the arc match probabilities for columns q and q′, respectively:
 |
 |
where  is defined as the position in sequence Sa associated with column q; we implicitly ignore terms in the equations where there is no such position. Finally, in addition to the columnwise sequence reliability, we define a columnwise structure reliability indicating how reliably the column is aligned and part of a base pair in the consensus structure:
 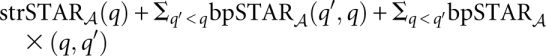 . Finally, the sum seqSTAR
 (q) + ω strSTAR
 (q) defines the columnwise STAR for each column q; this results in the STAR profile of an alignment. The factor ω controls the weight of structure reliability (against sequence reliability). At a weight of ω = 2, sequence and structure have the same influence, since each structure reliability contribution consumes two alignment columns. In LocARNA-P, we use a default of ω = 3 to emphasize the structural component.
We use STAR profiles to predict the boundaries of local regions of conserved sequence and structure, which potentially indicate ncRNAs, in alignments of longer sequences. For that purpose, we separate the structural reliability of the putative ncRNA from the reliability of the background. This is performed by fitting a two-step function to the reliability profile, where the higher value is the reliability of the ncRNA (i.e., the signal) and the lower value the average reliability of the background (Materials and Methods).
Furthermore, columnwise STARs allow us to define a global reliability score for an alignment. For a pair ( ) of an alignment and a consensus structure, we add all associated structural and nonstructural column reliabilities. Thus, STARS
 (
( ) is the sum of reliabilities ω bpSTAR
 (q, q′) over all column pairs (q, q′) in
  and seqSTAR
 (q) over all columns q that are not paired in
  . Finally, we define the STAR Score STARS
 of the multiple alignment
 as maximum STARS
 (
( ) over all structures
  divided by the length of the alignment. The efficient computation of the score is reported in the Supplemental Material.
STAR plots
Visualized as STAR (profile) plots, columnwise STARs provide an intuitive view of the local reliability of the alignment. For the ease of interpretation, we project the STAR profile to one particular reference sequence of interest. This proved useful in all studied applications, particularly when the annotation is known or is to be generated for the particular sequence.
Figure 1A demonstrates how STAR profiles can support the manual curation of ncRNA alignments. We show sequence and structure reliability along an automatic alignment of nine 7SK ncRNAs generated by LocARNA-P. The STAR plot is projected to the RNA of Xenopus laevis and complemented by a mountain plot of the consensus structure. The consensus structure was obtained from a large hand-curated alignment of 7SK ncRNAs. It fits the predicted structure reliabilities well, which is visible by the good agreement of the flanks of the mountain plot and the peaks of structure reliability. The general shape of the STAR profile is in agreement with the experiences from hand-curating the alignment, where the 5′ and 3′ ends of the sequences align very well and columns between positions 150 and 250 are extremely variable (Gruber et al. 2008a; Marz et al. 2009).
FIGURE 1.

STAR profile plots with annotations. In each profile plot, the dark regions indicate structure reliability, the light regions represent sequence reliability, and the thin line shows the combined column-reliability. The thick lines on top of B and C show the automatic prediction based on the STAR profile; below we indicate the known annotation by thinner lines. (A) STAR plot of an alignment of nine ncRNAs from the 7SK ncRNA family projected to the X. laevis sequence. The profile is annotated with a mountain plot of the consensus structure. (B) STAR plot for the LocARNA-P-alignment of the miRNA cluster hg18, chr13, positions 90800800–90801699, projected to the human sequence; the known microRNAs are easily detected using our method. (C) STAR plot for the LocARNA-P alignment of the human gene gas5 (hg18, chr1, 172,099,662–172,103,748); the gene is aligned with four other mammalian sequences; the introns of human gas5 host 10 C/D-box snoRNAs.
Locating structural ncRNAs using STAR profiles
Given a STAR profile projected to the sequence of the reference genome, we computationally predict the location of putative ncRNAs by fitting a two-step function as described before.
Figure 1B shows the STAR plot for the microRNA cluster from position 90,800,800–90,801,699 of human chromosome 13, generated from aligning 10 mammalian sequences. In particular, the structural component of the STAR profile (dark region) correlates well with the annotated microRNAs, which are indicated by thin lines. Fitting the two-step function results in a good prediction of the microRNA locations (thick line on top). A larger example from five mammalian sequences with lengths ∼5000 is given in Figure 1C. The figure profiles the human gene gas5, whose introns contain 10 C/D-box snoRNAs (Smith and Steitz 1998). Identifying the C/D-box snoRNAs in this large genomic context is challenging due to their weak conservation signal for both sequence and structure. Consequently, C/D-box snoRNAs have proven to be particularly hard to discover using de novo structural ncRNA predictors like RNAz. However, we correctly predicted eight of the 10 snoRNAs. We emphasize that LocARNA-P nontrivially supports the computation of these very large instances due to optimally exploiting local folding (Supplemental Material).
Accurate boundaries of structural ncRNA
A common problem in the de novo prediction of ncRNAs is that only approximate locations of structural RNAs can be identified. This problem is shared even by experimental approaches for ncRNA detection such as tiling arrays and short read sequencing. We show that the STAR profile plot combined with automated detection of high-reliability regions yields accurate boundaries of structural RNA.
To verify this claim, we generated a data set of true-positive predictions of a recent RNAz (Washietl et al. 2005a) screen (Rose et al. 2007) in Drosophila melanogaster, which is based on a whole-genome alignment of the 12 Drosophila genomes (Clark et al. 2007). In this screen, 120-nt-long alignment slices of the whole-genome alignment, called “windows,” at every 40 nt are evaluated with RNAz; the latter estimates a “class probability” P of containing structural RNA. Each set of overlapping windows with RNAz P ≥ 0.5 in either orientation is combined into a “locus.” As true positives, we selected 287 out of the about predicted 42,000 loci that overlap with at least one of the FlyBase-annotated structural noncoding RNAs in D. melanogaster. For each of the loci, we selected all sequences that have at most 25% gaps in the whole-genome alignment slice of the locus region. This filter criterion was proposed by Rose et al. (2007) to remove weakly aligned sequences. To enable prediction of ncRNA boundaries that exceed the RNAz prediction and to add background signal, each sequence was extended by genomic context. While large context increases the computational cost of the subsequent realignment, its size should significantly exceed the expected deviation between true ncRNA boundaries and RNAz prediction, which can be estimated from the annotation (cf. Fig. 2A). Thus, we added 100 nt upstream and downstream, as long as we stay in the same syntenic block. For only nine of the 287 loci, only a shorter context was available. These extended locus alignments consist of at average 8.5 sequences where the sequences have an average length of ∼325 and a maximal length of 560 nt.
FIGURE 2.

Accurate ncRNA boundaries for Drosophilids RNAz screen. (A) Deviation from annotated boundaries. We compare the deviation of RNAz (red) with the deviation of the boundaries as determined with our method (green). When the notches around the medians do not overlap, there is strong evidence that the medians differ. We show results of our method in three variants, since the alignment quality could be expected to depend on the sequence orientation: first, always aligning the sequences in forward orientation (+); second, in reverse orientation (−); third, in the orientation of the ncRNA annotation (annotated). (B–D) STAR plots with LocARNA-P predictions (thick green lines on top), RNAz predictions (red lines below), and annotated regions, RNAz predictions (red), and LocARNA-P predictions (green). (B) LocARNA-P precisely locates the snoRNA:U5:38ABa annotated in FlyBase. (C) For tRNA:H:48F, our prediction is well correlated with the precursor (cyan line) as described by Frendewey et al. (1985) (FlyBase annotation). (D) In the case of tRNA:N5:42Af, the magenta line shows the tRNA precursor, including the flanking region given by Lofquist and Sharp (1986). Here, RNAz indicates a 3′ extension, whereas LocARNA-P indicates the structure in the 5′ part of the precursor. As shown by Lofquist and Sharp (1986), the 5′-flanking regions of the tRNA5Asn genes differentially arrest RNA polymerase III.
For each locus, we realigned its extended sequences in both orientations and calculated according STARs, both performed simultaneously by LocARNA-P. This resulted in a STAR profile per locus, which we projected to the D. melanogaster sequence. For predicting boundaries by fitting the two-step function to the profile, we constrained the fit to predict exactly one range. The predicted boundaries were then compared with the boundaries of both the annotated ncRNA and the RNAz locus region.
We compare our predictions with the annotation in FlyBase for the assembly used by the RNAz screen. Notably, we make a single exception to this rule for microRNAs. Since we expect to identify their structural precursors instead of the (nonstructural) mature miRNA, we compared our predictions with the pre-miRNA annotations from miRBase.
Figure 2A shows the deviation of the boundaries determined by LocARNA-P from the annotated boundaries in a notched box plot. We measure this deviation as a sum of differences between the predicted and annotated 3′ end and 5′ end. Non-overlapping notches indicate a significant difference in the median because a notch represents the approximate 95% confidence interval of the median (Chambers et al. 1983). For understanding the dependency on the strand orientation, we show medians for analyzing the plus and minus strands or even the annotated strand, finding no significant differences. In particular, boundary prediction does not rely on knowing the correct orientation of the RNA. However, there is a significant difference between the RNAz boundaries and the boundaries detected by LocARNA-P. The median for RNAz is 47, whereas the median for our method is between 10 and 13 (depending on the strand orientation). This indicates that significant improvements of the boundary prediction, as shown in Figure 2B, are common. We emphasize that this improvement is even more important for practical applications because RNA folding is well known to be very context-sensitive.
We investigated cases in which the LocARNA-P prediction differs from the given annotation to a greater extent. Some of these cases are plainly due to incomplete or incorrect annotation. For example, for snoRNA U3 (FlyBase ID snoRNA:U3:54Aa) and smnRNA:331, only partial genes are annotated. In the case of SnoRNA:3, the annotation is incorrect for the 2004 assembly used for the RNAz screen (Rose et al. 2007). In the current assembly, however, the annotation matches the predicted signal.
In many cases, the predicted extended signals may correspond to precursors with conserved structure, as in the case of miRNAs. For tRNAs, we analyzed this source of incongruence between prediction and annotation in more detail. The tRNAs are known to undergo processing after being transcribed as precursors. The annotated tRNA “genes” are always the mature tRNAs. In contrast, the precursor is in almost all cases unknown. There is no agreement in the literature as to the exact extent of the precursor. Morl and Marchfelder (2001) estimate a length of only 5–15 nt for the 3′ trailer, while recent deep sequencing data show that this length often exceeds 20 nt (e.g., Lee et al. 2009). Consistent with these findings, it is not surprising that our method very often predicts a signal that not only covers the complete mature tRNA, but also extends in both the 5′ and 3′ direction, indicating that the putative precursors may also form structures outside of the range of the mature products of functional importance. In the two examples given in Figure 2, C and D (respective FlyBase IDs tRNA:H:48F and tRNA:N5:42Af), we compare the predictions with precursors described in the literature. In the case of tRNA:N5:42Af, RNAz predicts a 3′ extension, whereas LocARNA-P unveils a signal in the 5′-flanking region. The latter is consistent with the observation (Lofquist and Sharp 1986) that the 5′-flanking regions of the tRNA5Asn genes differentially arrest RNA polymerase III.
This disagreement between RNAz and LocARNA-P concerning the 5′- and 3′-flanking regions motivated us to look at the length distributions of 5′- and 3′-flanking regions of tRNAs as predicted by LocARNA-P. If these extensions were only due to random fluctuations, then one would assume the same distribution for both 5′ and 3′ regions. However, Figure 3A shows that the distributions are significantly different. Whereas the predicted 3′ ends coincide well with the mature tRNA, LocARNA-P tends to detect an additional structure signal in the 5′ region. The nonrandomness of this signal strongly suggests that LocARNA-P detects a true signal for structural conservation in the 5′ part of the tRNA precursors.
FIGURE 3.

(A) Distribution of predicted lengths of 5′ and 3′ flanking regions for tRNAs. The figure omits four outliers with 3′-trailers longer than 100. (B) Discriminating ncRNAs. ROC curves for discriminating RNAz loci, which are positives of an RNAz screen, by RNAz itself (using RNAz max P) and after rescoring with LocARNA-P by the STAR discriminator.
Improving discrimination power of ncRNA screens
All current predictors of structural RNA suffer from a high false discovery rate. In many cases, e.g., for experimental analysis, one is interested in selecting a small set of high-confidence predictions. In an RNAz screen, the most straightforward and common method for this purpose is to rely on RNAz's own evaluation and increase the threshold for positive predictions. Note that RNAz evaluates a locus by the maximal ncRNA class probability “RNAz max P” of the contributing windows, since RNAz originally predicts probabilities that each single window contains “structural RNA” and then combines overlapping windows with P ≥ 0.5 into a “locus.”
We propose an alternative strategy that rescores each RNAz prediction based on its LocARNA-P STAR profile and boundary prediction. We compared the resulting LocARNA-P discriminator with the currently used RNAz max P discriminator for discriminating RNAz loci, which themselves are predictions of the RNAz screen. To avoid confusion, we emphasize that this differs from estimating the false discovery rates of either tool RNAz or LocARNA-P.
For our experiment, we select a positive data set consisting of the 287 annotated RNAz loci in fly determined for the previous experiment. For the negative set, we generated 250 RNAz decoy alignments that consist of windows with RNAz P-score ≥ 0.5 by shuffling. For shuffling, we apply a greedy strategy based on the tool rnazRandomizeAln.pl of RNAz. The details are described in Materials and Methods. We preferred this strategy over a generate-and-test approach, which is computationally expensive since shuffling a large locus consisting of several windows will rarely result in a RNAz decoy locus.
The resulting Figure 3B shows that the novel strategy retains significantly more true positives for a given improvement in specificity. The lower ROC curve displays the effect of using a higher RNAz threshold between 0.5 and 1.0, as commonly used to reduce the false discovery rate. The upper curve shows the characteristic of the STAR-based discriminator. For the negative set, we furthermore extended the decoy loci alignments by their shuffled original alignment context and obtained the context-extended sequences as described in the previous section for the positive locus alignments. For positive and negative examples, we computed the LocARNA-P STAR profile of the corresponding locus. From these profiles, we predicted boundaries and determined the average columnwise STAR inside and outside of the predicted boundaries. The “STAR discriminator” is defined as the difference between average inside and outside reliability.
The discriminative power of the two measures, given as the area under the curve (AUC), is estimated at 0.71 for RNAz max P compared with 0.87 for the new STAR-based measure. This suggests that LocARNA-P significantly improves the discriminative power over RNAz alone when post-processing de novo ncRNA screens by RNAz.
Correlation of the STAR score
The structure-based alignment reliability STAR is a novel feature that has not been used in ncRNA screens before.11 Thus, we compared the STAR score with features that have been previously applied to measure the quality of sequence–structure alignment within the prediction of ncRNAs. To this end, we investigated how well certain features—including the average pairwise sequence identity (APSI), the structural conservation index (SCI) (Washietl et al. 2005a), and the STAR score—correlate with alignment quality on a benchmark set of 10-way (reference) alignments from the Rfam database. For each benchmark alignment, we realigned the sequences using LocARNA-P and compared the produced alignment with the reference alignment using the compalign score. The latter measures the similarity between two multiple alignments; it refers to the sum-of-pairs score (SPS) introduced with Bralibase 2.1 (Wilm et al. 2006).
Correlation plots are provided as Supplemental Figure 1. We observed that the SCI does not correlate well with the quality of the alignments as measured by the compalign score. APSI shows better correlation (0.69), which is expected because sequences with high APSI are much easier to align than sequences with low APSI. However, the highest correlation (0.78) is achieved by the STAR score. To rule out the possibility that this correlation is observed only in LocARNA-P-generated alignments, we also calculated the STAR scores for alignments that were produced by a second sequence–structure alignment method (Lara) (Bauer et al. 2007). We found a very strong correlation (0.99) between the STAR scores for the alignments of the different methods. This finding indicates that LocARNA-P STARs yield a very good general model of sequence–structure alignment.
DISCUSSION
Finding structurally conserved regions is one of the main tasks in the analysis of noncoding RNA. Approaches using sequence alignments as input heavily rely on alignment quality and are thus strongly limited by the low availability of high-quality alignments. Sankoff-style methods for the simultaneous alignment and folding of the homologous RNA sequences overcome this limitation and are thus considered the gold standard for that purpose. However, the biological interpretation of such alignments poses major problems because straightforward resampling methods, which are routine in assessing the significance of pairwise sequence alignments, are precluded by their extensive resource consumption.
By defining the sequence and structure similarity-based alignment reliabilities STARs, we introduced novel measures of the local and global quality of sequence–structure alignments. The STAR score can even be used to analyze the quality of alignments computed by independent methods. Furthermore, they improve the prediction of ncRNAs. Columnwise STARs, which capture the confidence in specific alignment columns, are calculated from match probabilities. In addition, we distinguish STARs for nonstructural and structural columns, as well as STARs for structurally aligned column pairs; we have shown that this efficiently discriminates structural regions from nonstructural regions of the alignment. The STAR profile plots allow visual inspection and interpretation.
The STAR score, based on columnwise STARs, turned out to be highly correlated with the alignment quality of sequence–structure alignments, where quality is understood in terms of similarity to reference alignments measured by the compalign score. The correlation is independent of whether these alignments were generated by LocARNA-P or other tools. This result shows that STARs capture general properties of correct sequence–structure alignments. Remarkably, the structural conservation index (SCI), reported in Gruber et al. (2008b) as the best method for detecting conserved secondary structure in sequence alignments, is a much worse measure of the alignment quality of sequence–structure alignments.
Furthermore, the STAR profiles can even be used to improve the computational prediction of ncRNA transcripts. We evaluated the two most important tasks of such an analysis. Albeit we performed this study for a de novo ncRNA prediction by RNAz, the suggested refinement would as well work for other RNA predictors. In addition, the method enables further analysis of deep-sequencing experiments (RNA-seq); for example, it can detect structural motifs in discovered transcripts, whereas RNA-seq cannot distinguish between structural and unstructural RNA. Furthermore, it is not straightforward to define the exact boundaries of transcripts from RNA-seq data (Langenberger et al. 2009); among the reasons are processing of ncRNA precursors, degradation products, and sequencing artifacts. Here, LocARNA-P provides additional hints on the true boundaries.
In our study, we determined accurate ncRNA boundaries for RNAz predictions from the projected STAR profiles; in particular, we improved the boundary accuracy by a factor of 3 from a median deviation of 47 to 13 nt. Boundary prediction is of particular importance because incorrect boundaries compromise all subsequent analysis steps that require a model of the secondary structure. Furthermore, based on the profile combined with the predicted boundaries, we computed a new discriminator for ncRNAs. Applied in the post-processing step of an RNAz screen, this discriminator is significantly stronger in distinguishing true RNAz predictions from false-positive predictions than the max P discriminator that is currently proposed by RNAz for this purpose. This improvement is of particular relevance because it reduces the number of ncRNA candidates for subsequent, more expensive, analysis steps.
MATERIALS AND METHODS
Efficient calculation of match probabilities
The match probabilities are efficiently calculated by LocARNA-P using dynamic programming for computing partition functions inside and outside of subsequence pairs Ai … Aj and Bk … Bl. Finally, these partition functions are combined for obtaining probabilities. The use of inside and outside algorithms for this purpose is well known from stochastic context-free grammars. However, a naive application of this algorithm results in a very high time complexity of O(n6) and space complexity of O(n4), where n is the length of the input sequence. This rapid growth of space and time requirements with the input size would limit the algorithm to only small instances. As we describe in detail in the Appendix, we calculate the match probabilities in a much lower complexity of O(n4) time and O(n2) space, which is essential for the applicability of the approach in practice. This low complexity of LocARNA-P, as well as of LocARNA, results from the use of sparsity at the structure level. LocARNA (Will et al. 2007) introduced this use of sparsity to Sankoff-style approaches. The same idea is found in FoldAlignM (Torarinsson et al. 2007) and was later picked up by RAF (Do et al. 2005). Interestingly, RAF (Do et al. 2005) combines sparsity at the structure and sequence level, a combination first seen in Stemloc (Bradley et al. 2008), which further improves the efficiency of Sankoff-style methods at the cost of strong sequence-based heuristics.
Predicting boundaries from a STAR profile
We predict the regions of conserved secondary structure from a STAR profile by fitting a two-step function to the profile. Extending the idea of least-squares fitting, the quality of a fit is the sum of square deviations plus a penalty Δ for each switch between the values a and b. For a given a and b, the optimal fit is calculated by an exact approach using dynamic programming. Instead of fitting all profiles with the same a and b values, we determine optimal values of a and b for each STAR profile using gradient descent optimization.
Formally, let f:{1, …, n} → ℝ denote a STAR profile of length n, i.e., f(q) = seqSTAR (q) + ω strSTAR
 (q). We fit a two-step function g to f, such that g approximates f as well as possible. Therefore, we determine constants a and b, such that
is minimal for all g: 1, …, n → {a, b}, where δ(x, x) = 0 and δ(x, y) = 1 for x ≠ y, Δ ∈ ℝ is a penalty for switching between the values of g, and g(0): = a. Basically, we perform a least-square distance approximation of f extended by a penalty term. The larger value of a and b represents the signal level, whereas the smaller value represents the background.
For given constants a and b, an optimal function g can be computed by dynamic programming. For this purpose, we solve the recursion equations
 |
with initialization A(0) = 0 and B(0) = 0 for A(n) and B(n) and obtain g by traceback.
For finding optimal constants a and b, we formulate a partition function variant of these equations. Minimizing the partition function ZA(n) + ZB(n) by gradient descent optimization, we determine optimal constants a and b. Note that we choose to optimize ZA(n) + ZB(n) instead of the cost A(n) + B(n), because for the partition function recursions, one can calculate partial derivatives. At sufficiently low temperature, such constants will also minimize the cost A(n) + B(n). More details are given in the Supplemental Material.
Generating decoy locus alignments
Rose et al. (2007) define an “RNAz locus alignment” as a slice of the 12-flies whole-genome alignment that is covered by window alignments of at most 120 columns with RNAz probability of P ≥ 0.5 for either the + or − strand. A “decoy locus alignment” is covered by windows with RNAz probability P ≥ 0.5 and has identical length, base composition, and gap pattern and similar conservation pattern to an existing RNAz locus alignment. However, a decoy locus alignment is not contained in any genome alignment and therefore cannot be a true positive.
We generate such decoys from true RNAz locus alignments by gentle shuffling as described in Rose et al. (2007). Gentle shuffling randomly permutes alignment columns but exchanges only columns with identical gap pattern and similar sequence conservation. We apply gentle shuffling to successive non-overlapping windows in the locus alignment but do not shuffle overlapping windows to maintain the locality of the base composition and conservation pattern. To speed up the approach for larger loci, we apply a greedy strategy and allow several attempts per window (at most 25 times) until RNAz evaluates to P ≥ 0.5. Each window of the resulting alignment is tested for coverage by RNAz P ≥ 0.5 windows in exactly the way of Rose et al. (2007). Finally, decoy context is generated by gentle shuffling of the original context in the whole-genome alignment.
Benchmarks
We measure the performance of LocARNA-P using the Bralibase 2.1 (Wilm et al. 2006) benchmark set. We have shown (Supplemental Fig. 4) that there is a significant improvement in the quality of multiple alignment compared with competing methods (Supplemental Material).
Running LocARNA-P
Information on obtaining the LocARNA-P software can be found under Supplemental Material. The Supplemental Material provides extensive documentation of the software. The core functionality of LocARNA-P is accessible via parameters of LocARNA's multiple alignment tool mlocarna. mlocarna provides a high-level interface to the low-level C++ tools for computing pairwise alignments and match probabilities in the LocARNA package. Reading multiple input sequences in fasta format, mlocarna with option “probabilistic” computes a multiple alignment and columnwise STARs. All results, including columnwise sequence and structure reliabilities, are written to text files. Further functionality, like computing the STAR score and estimating ncRNA boundaries, is accessible via scripts. In particular, we provide scripts and documentation for running the refinement of an RNAz screen, including the generation of reliability profile plots.
SUPPLEMENTAL MATERIAL
Supplemental Material is available for this article on both the journal site and at http://www.bioinf.uni-freiburg.de/Supplements/LocARNA-P/. LocARNA-P can be downloaded as part of the LocARNA software package, which is freely available under the GNU general public license.
ACKNOWLEDGMENTS
This work was supported by the German Research Foundation (grants BA 2168/3-1 as well as BA 2168/2-2, STA 850/7-1 [under the auspices of SPP-1258 “Sensory and Regulatory RNAs in Prokaryotes”], the Excellence Initiative of the German Federal and State Governments [EXC 294 to R.B.], and WI 3628/1-1); ESF grant no. 14494 (administered by the Sächsische AufbauBank); the German Federal Ministry of Education and Research (BMBF grant 0313921 FRISYS); and the Austrian Gen-AU project “Regulatory ncRNAs.” We thank the anonymous reviewers for their valuable comments.
APPENDIX: THE LocARNA-P ALGORITHM
In this Appendix, we explain the dynamic programming algorithm of LocARNA-P and the necessary foundations due to LocARNA in formal detail. Recall that in the Results, we defined probabilities for matches in the alignment of two RNA sequences A and B with associated base-pair probability matrices PA and PB, respectively. Suitable matrices are usually obtained from the respective RNA sequence using McCaskill's algorithm (RNAfold -p). The probabilities are defined on the basis of the alignment score of LocARNA, by assuming a Boltzmann distribution of alignment consensus structure pairs. This allows building on the established LocARNA score. After describing the LocARNA score and the algorithm of LocARNA, we present the algorithm of LocARNA-P, which efficiently computes these probabilities. The use of these probabilities in a probabilistic consistency transformation for progressive multiple alignment and iterative alignment refinement is discussed in the Supplemental Material.
Preliminaries: RNA alignment by LocARNA
LocARNA is a Sankoff-style algorithm, which simultaneously folds and aligns RNA sequences. The original Sankoff algorithm (Sankoff 1985) provides a general solution to the problem of simultaneously computing an alignment and a common secondary structure of the two aligned sequences. Without heuristic restrictions, the problem requires O(n6) CPU time and O(n4) memory, where n is length of the RNA sequences to be aligned. In contrast to Sankoff-style methods like FoldAlign (Havgaard et al. 2005) and dynalign (Mathews and Turner 2002), PMcomp (Hofacker and Stadler 2004) and LocARNA use structure models of the RNAs, which are reasonably obtained using McCaskill's algorithm (McCaskill 1990) on the basis of a full-featured energy model.
Alignment score
Define the single-stranded part of the alignment, denoted by  , by: if i ∼ k ∈
  , then there is no pair j ∼l such that (i, j) ∼ (k, l) ∈
  or (j, i) ∼ (l, k) ∈
  .
.
LocARNA determines the pair ( ,
,  ) that maximizes the score function:
 |
where τ(i, j; k, l) is the score for matching the arcs (i, j) and (k, l), σ(i, k) is the similarity score for a (mis)match of positions i and k in A and B, respectively, γ is the gap score parameter, and Ngap is the number of insertions and deletions in the alignment  . Although we define and henceforth discuss only linear gap cost to ease presentation, the actual LocARNA score features affine gap cost, which is supported by LocARNA, as well as by our implementation of LocARNA-P, with very moderate space and time overhead.
We use arc-match scores
where  and
and  are base-pair scores that are derived from the base-pairing probability matrices of the two individual sequences. More precisely, we define:
 |
where  is the equilibrium pairing probability for sequence X ∈ {A, B} as computed by McCaskill's algorithm (McCaskill 1990),
  is the expected probability for a pairing to occur at random in sequence X, and p* is the cut-off probability, below which the arcs are ignored. Formally, this is expressed by assigning −∞ as weight in this case. We call base pairs with probability ≥p* “significant.” The term
 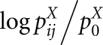 is the log-odds score for having a specific base-pairing against the null model of a random pairing, and
  is a normalization factor that transforms the weights to a maximum of 1. This normalization is introduced to ease balancing the sequence score against the structure score.
LocARNA-P uses exactly the same scoring function as LocARNA. However, it does not maximize the score according to this function but computes match probabilities based on this scoring function. How match probabilities relate to the scoring function is detailed in the “Match Probabilities” section of Results.
Efficient alignment using base-pair probabilities
LocARNA maximizes its score by efficiently evaluating a recursion equation using dynamic programming. The essential improvement of LocARNA over PMcomp is due to considering only significant base pairs in predicted structures. As we argued earlier (Will et al. 2007), by filtering we keep only O(n) significant base pairs in each sequence and only O(1) that share a given right end. Consequently, LocARNA improves the time complexity of PMcomp from O(n6) to O(n4) and, even more importantly, the space complexity from O(n4) to O(n2). The favorable time and space complexity of LocARNA is retained when extending the approach for the computation of match probabilities in LocARNA-P. Because of this structural analogy of the algorithms, we review the recursion structure of LocARNA in detail.
Both PMcomp and LocARNA define two four-dimensional (4D) matrices M and D that are filled recursively. Mij;kl is defined as the maximal score of an alignment of subsequences Ai..j and Bk..l. Dij;kl is the best score of an alignment of Ai..j and Bk..l with the additional condition that the base pairs (i, j) and (k, l) are matched. The LocARNA/PMcomp recursion can be written in the form:
 |
In contrast to PMcomp, LocARNA evaluates this recursion keeping only O(n2) entries in memory at any time. Due to the restriction to significant base pairs, the fourth case of the M recursion runs over only O(1) pairs of significant base pairs; consequently, the total algorithm has O(n4) time complexity.
For space complexity, we first observe that D-entries are needed only for matches (i, j) ∼ (k, l) of significant base pairs, which are only O(n2) many matches. Thus, the D-matrix can be easily represented by a two-dimensional (2D) matrix indexed by base pairs. Second, due to the special structure of the M recursion, which fixes the left subsequence ends i and k, we can compute all entries Di•;k• recursing only to entries Mi+1•;k+1•.12 Thus, a single O(n2) sized M matrix is sufficient for the computation of all Di•;k•, since the matrix can be reused for all left ends i and k.
An extension that explicitly incorporates base-pair stacking without increasing complexity is described by Bompfünewerer et al. (2008).
LocARNA-P's core algorithm: Partition function version of LocARNA
The calculation of alignment match probabilities by LocARNA-P is based on partition functions. Recall that the probability of a pair of alignment and consensus structure ( ,
,  ) is given by
where the partition function ZAB for sequences A and B is defined as
and β is a parameter that controls the distribution, called the “inverse temperature.”
Calculating match probabilities in LocARNA-P consists of three phases, which are comparable to the algorithm of Hofacker and Stadler (Hofacker et al. 2004) but go beyond this algorithm in terms of complexity. First, an inside dynamic programming algorithm computes inside partition functions. This part of the LocARNA-P algorithm has the same recursion structure as the LocARNA algorithm. Second, a corresponding outside algorithm calculates outside partition functions. We devise a dynamic programming algorithm that computes these values in the given complexity envelope. Finally, we show how to obtain the single-base and base-pair match probabilities. Again, this phase remains within the complexity bounds.
Inside algorithm
We define two 4D matrices:
 |
and
 |
Note that  is valid (and later has to be computed) only for significant13 base pairs (i, j) and (k, l).
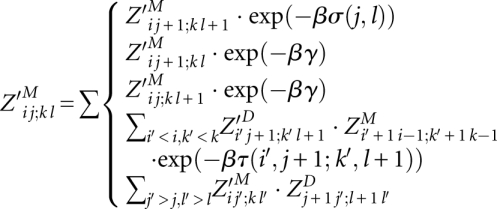
The matrix entries are recursively computed by the following equations (cf. Fig. 4A):
 |
These equations are a direct translation of the LocARNA recursion to its partition function variant. The translation is straightforward because the decomposition of the LocARNA recursion is unambiguous. Finally, the total partition function is obtained as 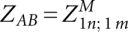 .
.
FIGURE 4.

Inside and outside decomposition by the recursions. (A) Inside. The gray inside regions correspond to the matrix ZM and the white inside region to ZD. (B) Outside. The gray outside regions correspond to entries in Z′M; the white outside region represents an entry of Z′D.
A good space and time complexity is achieved using the same ideas as in the original LocARNA recursion for maximizing the score. When evaluating the recursion for  , we compute and store the entries
  for significant base pairs (i, j) and (k, l). A computation order of increasing j − i avoids dependency conflicts. The entries require O(n2) space due to the number of significant base pairs. Note that the matrix ZD is conveniently implemented as a 2D array that is indexed with base pairs. One entry
  depends only on entries of the matrix slice
  and other values in ZD. Therefore, efficient computation requires only O(n2) additional space for the matrix slice. The matrix slice is implemented as a 2D array, which is reused for the computation of each ZD entry. Time complexity is only O(n4), since computing one entry in ZM is performed in time O(1/p*) = O(1), when only significant base pairs are considered.
The outside algorithm needs to access ZD, hence this matrix is kept in memory throughout.
Outside algorithm
The outside algorithm computes partition functions of alignments outside of subsequences Ai..j and Bk..l and corresponding consensus structures. An alignment of A and B outside i..j and k..l contains only matches i′ ∼ k′, where i′ < i and k′ < k or j < i′ and l < k′.
We define
 |
 is valid only for i, j, k, and l, where significant base pairs (i, j) and (k, l) exist for PA and PB, respectively. Then, it is defined as
 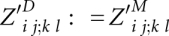 and is understood as the partition function outside of the match of base pairs (i, j) and (k, l). Note that we introduce the extra matrix Z′D for preparing the space optimization.
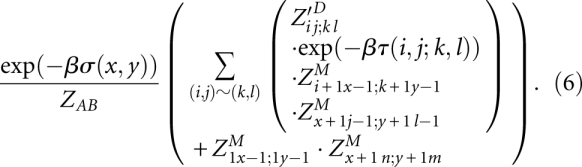
The matrix entries are recursively computed after initialization  by
by
 |
and 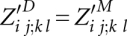 . An illustration of the underlying decomposition is given in Figure 4B.
So far, the recursion follows the lines of Hofacker and Stadler (Hofacker et al. 2004). However, we restructure the evaluation of these recursions in LocARNA-P in order to maintain the complexity bounds. For initialization, we use the inside matrix slice  , which can be recomputed in O(n2) time.14
Then, we compute all entries  for significant base pairs (i, j) and (k, l) in the order from outside to inside, i.e., for decreasing distances j − i. As in the case of the inside partition functions, Z′D is implemented as a 2D array of size O(n2). For obtaining all entries
  , we fill a matrix slice
  . During this computation for fixed i and k, we recurse to four different kinds of matrix entries. First and second, we recurse to entries of matrices Z′D and ZD. Both are maintained in O(n2) space, and dependencies are resolved due to computation order. The same holds for the third kind of entries in the matrix slice
  , where dependencies are resolved by computation of entries
  in the order of decreasing j and l. However, there is a fourth kind of entry, namely, those of the form
  . This matrix slice is recomputed in O(n2) time each time before we start filling a matrix slice
  . Clearly, this slice adds another space of O(n2). The space for the matrix slices
  and
and  is reused for each left end i and k of significant base pairs.
Despite the necessary recomputation of slices  , the time complexity is O(n4). Here, we argue again that summations run only over pairs of significant arcs and, consequently, take constant time.
Calculation of alignment match probabilities
The probability of a structural alignment match is easily computed as
 |
from the efficiently computed matrices ZD and Z′D.
Computing the probabilities of base matches requires a case distinction on the “immediately enclosing” arc match (i, j) ∼ (k, l) of a base match x ∼ y. P(x ∼ y|A, B) is efficiently computed as
 |
Note that we need to cover the case of no enclosing arc match explicitly.
The quadratic space envelope requires recomputation of  and
and  , for each (i, j) ∼ (k, l). Given ZD, all
  can be clearly recomputed in O(n2). Note that also all
  can be recomputed in O(n2) by a right-reducing variant of the given left-reducing recursion for the matrix ZM.
For efficient evaluation, one regroups the computation by iterating over all (i, j) ∼ (k, l) and accumulating the probability contributions of each arc pair to all P(x ∼ y|A, B). In this way, recomputation causes a time complexity of O(n4) for the computation of all base match probabilities. However, this computation is still an expensive step of the entire algorithm. Considering only pairs of arcs with a match probability ≥p* (or some independently chosen cut-off probability) is a reasonable, easily applicable heuristic that reduces the cost of this computation step in practice.
Interestingly, the term reliability has been used in the related context of RNA structure prediction before, albeit obviously with a very different definition (Knudsen and Hein 2003).
We introduce notation using index • as a wildcard. For example, Mi+1•;k+1• refers to the matrix slice of entries Mi+1j;k+1l, where i + 1 ≤ j ≤ n and k + 1 ≤ l ≤ m. We freely use analogous notation in the following.
That is, significant according to respective base-pair probability matrices PA and PB.
In our implementation, we skip this recomputation, since the matrix is still available from the last step of the inside algorithm.
Article published online ahead of print. Article and publication date are at http://www.rnajournal.org/cgi/doi/10.1261/rna.029041.111.
REFERENCES
- Bauer M, Klau GW, Reinert K 2007. Accurate multiple sequence–structure alignment of RNA sequences using combinatorial optimization. BMC Bioinformatics 8: 271 doi: 10.1186/1471-2105-8-271 [DOI] [PMC free article] [PubMed] [Google Scholar]
- Bertone P, Stoc V, Royce TE, Rozowsky JS, Urban AE, Zhu X, Rinn JL, Tongprasit W, Samanta M, Weissman S, et al. 2004. Global identification of human transcribed sequences with genome tiling arrays. Science 306: 2242–2246 [DOI] [PubMed] [Google Scholar]
- Bompfünewerer AF, Backofen R, Bernhart SH, Hertel J, Hofacker IL, Stadler PF, Will S 2008. Variations on RNA folding and alignment: Lessons from Benasque. J Math Biol 56: 129–144 [DOI] [PubMed] [Google Scholar]
- Bradley RK, Pachter L, Holmes I 2008. Specific alignment of structured RNA: Stochastic grammars and sequence annealing. Bioinformatics 24: 2677–2683 [DOI] [PMC free article] [PubMed] [Google Scholar]
- Chambers JM, Cleveland WS, Kleiner B, Tukey PA 1983. Graphical methods for data analysis. Wadsworth/Cengage Learning, Florence, KY [Google Scholar]
- Cheng J, Kapranov P, Drenkow J, Dike S, Brubaker S, Patel S, Long J, Stern D, Tammana H, Helt G, et al. 2005. Transcriptional maps of 10 human chromosomes at 5-nucleotide resolution. Science 308: 1149–1154 [DOI] [PubMed] [Google Scholar]
- Clark AG, Eisen MB, Smith DE, MacCallum I 2007. Evolution of genes and genomes on the Drosophila phylogeny. Nature 450: 203–218 [DOI] [PubMed] [Google Scholar]
- Coventry A, Kleitman DJ, Berger B 2004. MSARI: Multiple sequence alignments for statistical detection of RNA secondary structure. Proc Natl Acad Sci 101: 12102–12107 [DOI] [PMC free article] [PubMed] [Google Scholar]
- Do CB, Mahabhashyam MSP, Brudno M, Batzoglou S 2005. ProbCons: Probabilistic consistency-based multiple sequence alignment. Genome Res 15: 330–340 [DOI] [PMC free article] [PubMed] [Google Scholar]
- Do CB, Foo C-S, Batzoglou S 2008. A max-margin model for efficient simultaneous alignment and folding of RNA sequences. Bioinformatics 24: i68–i76 [DOI] [PMC free article] [PubMed] [Google Scholar]
- The FANTOM Consortium and RIKEN Genome Exploration Research Group and Genome Science Group 2005. The transcriptional landscape of the mammalian genome. Science 309: 1559–1563 [DOI] [PubMed] [Google Scholar]
- Frendewey D, Dingermann T, Cooley L, Soll D 1985. Processing of precursor tRNAs in Drosophila. Processing of the 3′ end involves an endonucleolytic cleavage and occurs after 5′ end maturation. J Biol Chem 260: 449–454 [PubMed] [Google Scholar]
- Gardner PP, Wilm A, Washietl S 2005. A benchmark of multiple sequence alignment programs upon structural RNAs. Nucleic Acids Res 33: 2433–2439 [DOI] [PMC free article] [PubMed] [Google Scholar]
- Gorodkin J, Heyer L, Stormo G 1997. Finding the most significant common sequence and structure motifs in a set of RNA sequences. Nucleic Acids Res 25: 3724–3732 [DOI] [PMC free article] [PubMed] [Google Scholar]
- Gruber AR, Kilgus C, Mosig A, Hofacker IL, Hennig W, Stadler PF 2008a. Arthropod 7SK RNA. Mol Biol Evol 25: 1923–1930 [DOI] [PubMed] [Google Scholar]
- Gruber AR, Bernhart SH, Hofacker IL, Washietl S 2008b. Strategies for measuring evolutionary conservation of RNA secondary structures. BMC Bioinformatics 9: 122 doi: 10.1186/1471-2105-9-122 [DOI] [PMC free article] [PubMed] [Google Scholar]
- Gruber AR, Findeiss S, Washietl S, Hofacker IL, Stadler PF 2010. RNAZ 2.0: Improved noncoding RNA detection. Pac Symp Biocomput 15: 69–79 [PubMed] [Google Scholar]
- Guerrier-Takada C, Gardiner K, Marsh T, Pace N, Altman S 1983. The RNA moiety of ribonuclease P is the catalytic subunit of the enzyme. Cell 35: 849–857 [DOI] [PubMed] [Google Scholar]
- Harmanci AO, Sharma G, Mathews DH 2008. PARTS: Probabilistic alignment for RNA joint secondary structure prediction. Nucleic Acids Res 36: 2406–2417 [DOI] [PMC free article] [PubMed] [Google Scholar]
- Havgaard JH, Lyngso RB, Stormo GD, Gorodkin J 2005. Pairwise local structural alignment of RNA sequences with sequence similarity less than 40%. Bioinformatics 21: 1815–1824 [DOI] [PubMed] [Google Scholar]
- Heyne S, Will S, Beckstette M, Backofen R 2009. Lightweight comparison of RNAs based on exact sequence–structure matches. Bioinformatics 25: 2095–2102 [DOI] [PMC free article] [PubMed] [Google Scholar]
- Höchsmann M, Töller T, Giegerich R, Kurtz S 2003. Local similarity in RNA secondary structures. In Proceedings of Computational Systems Bioinformatics (CSB 2003), Vol. 2, pp. 159–168. IEEE Computer Society, Washington, DC [PubMed] [Google Scholar]
- Hofacker IL, Stadler PF 2004. The partition function variant of Sankoff's algorithm. In Computational science–ICCS 2004: 4th international conference, Kraków, Poland, June 6–9, 2004, proceedings, part IV (ed. M Bubak et al.), pp. 728–735. Springer Verlag, Heidelberg [Google Scholar]
- Hofacker IL, Bernhart SH, Stadler PF 2004. Alignment of RNA base pairing probability matrices. Bioinformatics 20: 2222–2227 [DOI] [PubMed] [Google Scholar]
- Klein RJ, Eddy SR 2003. RSEARCH: Finding homologs of single structured RNA sequences. BMC Bioinformatics 4: 44 doi: 10.1186/1471-2105-4-44 [DOI] [PMC free article] [PubMed] [Google Scholar]
- Knudsen B, Hein J 2003. Pfold: RNA secondary structure prediction using stochastic context-free grammars. Nucleic Acids Res 31: 3423–3428 [DOI] [PMC free article] [PubMed] [Google Scholar]
- Lagos-Quintana M, Rauhut R, Lendeckel W, Tuschl T 2001. Identification of novel genes coding for small expressed RNAs. Science 294: 853–857 [DOI] [PubMed] [Google Scholar]
- Langenberger D, Bermudez-Santana C, Hertel J, Hoffmann S, Khaitovich P, Stadler PF 2009. Evidence for human microRNA-offset RNAs in small RNA sequencing data. Bioinformatics 25: 2298–2301 [DOI] [PubMed] [Google Scholar]
- Lau NC, Lim LP, Weinstein EG, Bartel DP 2001. An abundant class of tiny RNAs with probable regulatory roles in Caenorhabditis elegans. Science 294: 858–862 [DOI] [PubMed] [Google Scholar]
- Lee R, Ambros V 2001. An extensive class of small RNAs in Caenorhabditis elegans. Science 294: 862–864 [DOI] [PubMed] [Google Scholar]
- Lee YS, Shibata Y, Malhotra A, Dutta A 2009. A novel class of small RNAs: tRNA-derived RNA fragments (tRFs). Genes Dev 23: 2639–2649 [DOI] [PMC free article] [PubMed] [Google Scholar]
- Lofquist A, Sharp S 1986. The 5′-flanking sequences of Drosophila melanogaster tRNA5Asn genes differentially arrest RNA polymerase III. J Biol Chem 261: 14600–14606 [PubMed] [Google Scholar]
- Marz M, Donath A, Verstaete N, Nguyen VT, Stadler PF, Bensaude O 2009. Evolution of 7SK RNA and its protein partners in metazoa. Mol Biol Evol 26: 2821–2830 [DOI] [PubMed] [Google Scholar]
- Mathews DH, Turner DH 2002. Dynalign: An algorithm for finding the secondary structure common to two RNA sequences. J Mol Biol 317: 191–203 [DOI] [PubMed] [Google Scholar]
- Mattick JS, Taft RJ, Faulkner GJ 2009. A global view of genomic information—moving beyond the gene and the master regulator. Trends Genet 26: 21–28 [DOI] [PubMed] [Google Scholar]
- McCaskill JS 1990. The equilibrium partition function and base pair binding probabilities for RNA secondary structure. Biopolymers 29: 1105–1119 [DOI] [PubMed] [Google Scholar]
- Missal K, Rose D, Stadler PF 2005. Non-coding RNAs in Ciona intestinalis. Bioinformatics (Suppl 2) 21: ii77–ii78 [DOI] [PubMed] [Google Scholar]
- Missal K, Zhu X, Rose D, Deng W, Skogerbo G, Chen R, Stadler PF 2006. Prediction of structured non-coding RNAs in the genomes of the nematodes Caenorhabditis elegans and Caenorhabditis briggsae. J Exp Zoolog B Mol Dev Evol 306: 379–392 [DOI] [PubMed] [Google Scholar]
- Morl M, Marchfelder A 2001. The final cut. The importance of tRNA 3′-processing. EMBO Rep 2: 17–20 [DOI] [PMC free article] [PubMed] [Google Scholar]
- Pedersen JS, Bejerano G, Siepel A, Rosenbloom K, Lindblad-Toh K, Lander ES, Kent J, Miller W, Haussler D 2006. Identification and classification of conserved RNA secondary structures in the human genome. PLoS Comput Biol 2: e33 doi: 10.1371/journal.pcbi.0020033 [DOI] [PMC free article] [PubMed] [Google Scholar]
- Rivas E, Eddy SR 2001. Noncoding RNA gene detection using comparative sequence analysis. BMC Bioinformatics 2: 8 doi: 10.1186/1471-2105-2-8 [DOI] [PMC free article] [PubMed] [Google Scholar]
- Rose D, Hackermuller J, Washietl S, Reiche K, Hertel J, Findeiss S, Stadler PF, Prohaska SJ 2007. Computational RNomics of drosophilids. BMC Genomics 8: 406 doi: 10.1186/1471-2164-8-406 [DOI] [PMC free article] [PubMed] [Google Scholar]
- Roshan U, Livesay DR 2006. Probalign: Multiple sequence alignment using partition function posterior probabilities. Bioinformatics 22: 2715–2721 [DOI] [PubMed] [Google Scholar]
- Sankoff D 1985. Simultaneous solution of the RNA folding, alignment and protosequence problems. SIAM J Appl Math 45: 810–825 [Google Scholar]
- Siebert S, Backofen R 2005. MARNA: Multiple alignment and consensus structure prediction of RNAs based on sequence structure comparisons. Bioinformatics 21: 3352–3359 [DOI] [PubMed] [Google Scholar]
- Smith CM, Steitz JA 1998. Classification of gas5 as a multi-small-nucleolar-RNA (snoRNA) host gene and a member of the 5′-terminal oligopyrimidine gene family reveals common features of snoRNA host genes. Mol Cell Biol 18: 6897–6909 [DOI] [PMC free article] [PubMed] [Google Scholar]
- Torarinsson E, Sawera M, Havgaard JH, Fredholm M, Gorodkin J 2006. Thousands of corresponding human and mouse genomic regions unalignable in primary sequence contain common RNA structure. Genome Res 16: 885–889 [DOI] [PMC free article] [PubMed] [Google Scholar]
- Torarinsson E, Havgaard JH, Gorodkin J 2007. Multiple structural alignment and clustering of RNA sequences. Bioinformatics 23: 926–932 [DOI] [PubMed] [Google Scholar]
- Torarinsson E, Yao Z, Wiklund ED, Bramsen JB, Hansen C, Kjems J, Tommerup N, Ruzzo WL, Gorodkin J 2008. Comparative genomics beyond sequence-based alignments: RNA structures in the ENCODE regions. Genome Res 18: 242–251 [DOI] [PMC free article] [PubMed] [Google Scholar]
- Uzilov AV, Keegan JM, Mathews DH 2006. Detection of non-coding RNAs on the basis of predicted secondary structure formation free energy change. BMC Bioinformatics 7: 173 doi: 10.1186/1471-2105-7-173 [DOI] [PMC free article] [PubMed] [Google Scholar]
- Washietl S, Hofacker IL 2004. Consensus folding of aligned sequences as a new measure for the detection of functional RNAs by comparative genomics. J Mol Biol 342: 19–30 [DOI] [PubMed] [Google Scholar]
- Washietl S, Hofacker IL, Stadler PF 2005a. Fast and reliable prediction of noncoding RNAs. Proc Natl Acad Sci 102: 2454–2459 [DOI] [PMC free article] [PubMed] [Google Scholar]
- Washietl S, Hofacker IL, Lukasser M, Huttenhofer A, Stadler PF 2005b. Mapping of conserved RNA secondary structures predicts thousands of functional noncoding RNAs in the human genome. Nat Biotechnol 23: 1383–1390 [DOI] [PubMed] [Google Scholar]
- Will S, Reiche K, Hofacker IL, Stadler PF, Backofen R 2007. Inferring noncoding RNA families and classes by means of genome-scale structure-based clustering. PLoS Comput Biol 3: e65 doi: 10.1371/journal.pcbi.0030065 [DOI] [PMC free article] [PubMed] [Google Scholar]
- Wilm A, Mainz I, Steger G 2006. An enhanced RNA alignment benchmark for sequence alignment programs. Algorithms Mol Biol 1: 19 doi: 10.1186/1748-7188-1-19 [DOI] [PMC free article] [PubMed] [Google Scholar]
- Yao Z, Weinberg Z, Ruzzo WL 2006. CMfinder—a covariance model based RNA motif finding algorithm. Bioinformatics 22: 445–452 [DOI] [PubMed] [Google Scholar]