

SUMMARY
The substantia nigra pars reticulata (SNr) is thought to serve as the output of the basal ganglia, whereby associative information from striatum influences behavior via disinhibition of downstream motor areas to motivate behavior. Unfortunately, few studies have examined activity in SNr in rats making decisions based on the value of predicted reward similar to those conducted in primates. To fill this void, we recorded from single neurons in SNr while rats performed a choice task in which different odor cues indicated what reward was available on the left or on the right. The value of reward associated with a left or rightward movement was manipulated by varying the size of and delay to reward in separate blocks of trials. Rats were faster or slower depending on whether the expected reward value was high or low, respectively. The number of neurons that increased firing during performance of the task outnumbered those that decreased firing. Both increases and decreases were modulated by expected value and response direction. Neurons that fired more or less strongly for larger reward tended to fire more or less strongly for immediate reward, reflecting their common motivational output. Finally, value selectivity was present prior to presentation of cues indicating the nature of the upcoming behavioral response for both increasing- and decreasing-type neurons, reflecting the internal bias or preparatory set of the rat. These results emphasize the importance of increasing-type neurons on behavioral output when animals are making decisions based on predicted reward value.
Keywords: substantia nigra, response bias, motivation, decision-making, reward, single unit, rat
INTRODUCTION
Substantia nigra pars reticulata (SNr) has traditionally been referred to as the output of the basal ganglia, a conglomerate of areas critical in guiding motivated behavior (Albin et al., 1989; Hikosaka & Wurtz, 1989; Kawagoe et al., 1998; Kandel et al., 2000; Deniau et al., 2007). SNr receives reward-related information from striatum and outputs directly to motor-related structures such as superior colliculus as well as to thalamus, which projects to cortical areas such as motor cortex and prefrontal cortex (Deniau et al., 1994; Hoover & Strick, 1999; Middleton & Strick, 2002). Thus, SNr is in a strategic position to process reward-related information to guide motor responding to secure future reward (Yoshida & Precht, 1971; Selemon & Goldman-Rakic, 1990; Hedreen & DeLong, 1991; Hikosaka et al., 1993; Heimer, 1995; Hoover & Strick, 1999; Kandel et al., 2000; Hikosaka et al., 2006; Deniau et al., 2007).
It has been suggested that there are at least two parallel pathways through the basal ganglia. One pathway sends inhibitory projections from striatum directly to SNr and reflects decreases in SNr activity. The second pathway, known as the indirect pathway, travels from striatum through globus pallidus external (GPe) and subthalamic nucleus (STN) to SNr (Alexander & Crutcher, 1990). Activation of this pathway causes elevated firing in SNr (Alexander & Crutcher, 1990; Mink & Thach, 1993; Levy et al., 1997; Maurice et al., 1999; Kandel et al., 2000; Gurney et al., 2001; Gulley et al., 2002a; Sato & Hikosaka, 2002; Kolomiets et al., 2003). It is common for behavioral neurophysiology studies in primates and rats to divide neurons into either increasing- or decreasing-type neurons based on firing rates during task performance (Handel & Glimcher, 2000; Gulley et al., 2002b; Sato & Hikosaka, 2002; Joshua et al., 2009). It is still unclear what function these different types of neurons serve during goal-directed behavior. Since SNr is primarily GABAergic, it has been suggested that increases in activity inhibit unwanted movements whereas decreases in activity allow movement via disinhibition (Mink & Thach, 1993; Mink, 1996; Gulley et al., 2002b; Sato & Hikosaka, 2002). In primates, attention has mostly been given to decreasing-type neurons which are strongly modulated by expected reward value and are thought to bias behavior toward rewarded targets (Sato & Hikosaka, 2002).
Recent work in rats has suggested that increasing-type neurons may be more important than previously thought (Gulley et al., 2002b). In fact, these studies show that increasing-type neurons significantly outnumber decreasing-type neurons. However, no rat study has examined firing in SNr in a task comparable to those performed in primates, thus it is unclear whether similar mechanisms exist in the rat. Further, few studies have examined modulation of activity in SNr in reward tasks that involve goal-directed movements other than eye movements. To address these issues we recorded from single neurons in SNr of rats performing a task in which they chose, in separate blocks of trials, between differently sized or delayed rewards (Roesch et al., 2009; Roesch et al., 2010; Stalnaker et al., 2010). Across blocks, rats biased behavior toward the direction (left or right) of the more valued reward (i.e. short over long delay and big over small reward).
In congruence with previously reported data, we found that SNr neurons either increased or decreased activity prior to and during motor acts (Hikosaka & Wurtz, 1983a; b; Gulley et al., 1999; Handel & Glimcher, 2000; Ono et al., 2000; Gulley et al., 2002b; a; Meyer-Luehmann et al., 2002; Sato & Hikosaka, 2002; Rebec, 2006) and that increasing-type neurons significantly outnumbering decreasing-types (Gulley et al., 1999; Gulley et al., 2002b; a; Meyer-Luehmann et al., 2002; Joshua et al., 2009). Across the entire population, SNr neurons showed an interaction between response direction and expected reward value, firing more strongly when the higher value reward was at stake. Value signals were present prior to cues signaling the direction of the response, indicating the rats’ response bias or preparatory set. These effects did not significantly differ between increasing- and decreasing-type neurons. Our results emphasize the importance of increasing-type neurons in goal-directed behavior.
METHODS
Subjects
Twelve male Long-Evans rats were obtained at 175–200g (~2 months old) from Charles River Labs, Wilmington, MA. Rats were individually housed on a 12h light/dark cycle and tested during the light phase. Rats were tested at the University of Maryland under university and NIH guidelines.
Surgical procedures and histology
Surgical procedures followed guidelines for aseptic technique. Electrodes were manufactured and implanted as in prior recording experiments. Rats had a drivable bundle of 10 25-μm diameter FeNiCr wires (Stablohm 675, California Fine Wire, Grover Beach, CA) chronically implanted in the left hemisphere dorsal to SNr (n = 12; 5.6 mm posterior to bregma, 1.8 mm laterally, and 6.5 mm ventral to the brain surface). Immediately prior to implantation, these wires were freshly cut with surgical scissors to extend ~1 mm beyond the cannula and electroplated with platinum (H2PtCl6, Aldrich, Milwaukee, WI) to an impedance of ~300 kOhms. Cephalexin (15 mg/kg p.o.) was administered twice daily for two weeks postoperatively to prevent infection. Rats were ~3 months of age at the time of surgery. The final electrode position was marked by passing a 15-mA current through each electrode. The rats were then perfused and their brains removed and processed for histology (Roesch et al., 2007b).
Behavioral task
Training and recording was conducted in aluminum chambers approximately 18″ on each side with sloping walls narrowing to an area of 12″ × 12″ at the bottom. A central odor port was located above two adjacent fluid wells on a panel in the right wall of each chamber. Two lights were located above the panel. The odor port was connected to an air flow dilution olfactometer to allow the rapid delivery of olfactory cues. Task control was implemented via computer. Port entry, well entry, and licking were monitored by disruption of photobeams.
The basic design of a trial is illustrated in Figure 1A. Trials were signaled by illumination of the panel lights inside the box. When these lights were on, nosepoke into the odor port resulted in delivery of the odor cue for 500 ms to a small hemicylinder located behind this opening starting 500 ms after entry into the odor port. One of three different odors was delivered to the port on each trial, in a pseudorandom order. At odor offset, the rat had 3 seconds to make a response at one of the two fluid wells located below the port. Reaction times were calculated as the time between the offset of the odor stimulus and the exit of the snout from the odor port. One odor (Verbena Oliffac) instructed the rat to go to the left to get reward (forced-choice trial), a second odor (Camekol DH) instructed the rat to go to the right to get reward (forced-choice trial), and a third odor (Cedryl Acet Trubek) indicated that the rat could obtain reward at either well (free-choice trial). On forced-choice trials, responding in the wrong direction resulted in no reward with an immediate correction trial. Odors were presented in a pseudorandom sequence such that the free-choice odor was presented on 7/20 trials and the left/right odors were presented in equal numbers (+/−1 over 250 trials). In addition, the same odor could be presented on no more than 3 consecutive trials. Odor identities did not change over the course of the experiment.
Figure 1. Task and behavior.

A. Choice task during which we varied the delay preceding reward delivery and the size of reward. Figure shows sequence of events in each trial in 4 blocks in which we manipulated the time to reward or the size of reward. Trials were signaled by illumination of the panel lights inside the box. When these lights were on, nosepoke into the odor port resulted in delivery of the odor cue to a small hemicylinder located behind this opening. One of three different odors was delivered to the port on each trial, in a pseudorandom order. At odor offset, the rat had 3 seconds to make a response at one of the two fluid wells located below the port. One odor instructed the rat to go to the left to get reward, a second odor instructed the rat to go to the right to get reward, and a third odor indicated that the rat could obtain reward at either well. One well was randomly designated as short and the other long at the start of the session (block 1). In the second block of trials these contingencies were switched (block 2). In later blocks (3–4) we held the delay preceding reward delivery constant while manipulating the size of the expected reward. B. The height of each bar indicates the percent choice of short delay versus long delay (top) and big reward versus small reward (bottom) taken over all free-choice trials. C–D. The height of each bar indicates the percent correct (C) and reaction time (D) on forced-choice trials across all recording sessions. E. Boxes indicate the approximate extent of recording sites where SNr neurons were collected for each animal. Consistent with previous reports in SNr, baseline firing rates were high (mean = 35 spikes/second; SD = 20) and waveform durations were short (mean = 0.86 ms; SD = 0.47) (Gulley et al., 1999; Gulley et al., 2002b; Meyer-Luehmann et al., 2002; Deransart et al., 2003). Asterisks: planned comparisons revealing statistically significant differences (t-test, p < 0.05). Error bars indicate standard errors.
During the first day of training rats were first taught to simply nose poke into the odor port and then go to the well for reward. On the second day, the free-choice odor was introduced and rats were free to respond to either well for reward. On each subsequent day, the number of forced-choice odors increased by 2 for each block of 20 trials. During this time we introduced blocks in which we independently manipulated the size of the reward delivered at a given side and the length of the delay preceding reward delivery. Once the rats were able to maintain accurate responding (> 60%) on forced-choice trials through these manipulations and were able to switch their response bias in each of the four trial blocks (Figure 1) on free-choice trials, surgery was performed and recording sessions began. For recording, one well was randomly designated as short (500 ms) and the other long (1–7 s) at the start of the session (Figure 1A: block 1). Rats were required to wait in the well in order to receive reward. In the second block of trials these contingencies were switched (Figure 1A: block 2). The length of the delay under long conditions abided the following algorithm. The side designated as long started off as 1s and increased by 1s every time that side was chosen. If the rat continued to choose that side, the length of the delay increased by 1s up to a maximum of 7s. If the rat chose the side designated as long less than 8 out of the last 10 choice trials then the delay was reduced by 1s to a minimum of 3 s. The reward delay for long forced-choice trials was yoked to the delay in free-choice trials during these blocks. In later blocks we held the delay preceding reward delivery constant (500 ms) while manipulating the size of the expected reward (Figure 1A: blocks 3 & 4). The reward was a 0.05 ml bolus of 10% sucrose solution. For big reward, additional boli were delivered after 500 ms. At least 60 trials per block were collected for each neuron. Transitions between blocks were not signaled; the rat had to learn block contingencies through trial and error. Rats were water deprived (~30 min of free water per day) with free access on weekends. Rats were weighed weekly. No rat showed a significant decrease in weight over the course of the experiment.
Single-unit recording
Procedures were the same as described previously (Roesch et al., 2007a; Roesch et al., 2009). Wires were screened for activity daily; if no activity was detected, the rat was removed, and the electrode assembly was advanced 40 or 80μm. Otherwise active wires were selected to be recorded, a session was conducted, and the electrode was advanced at the end of the session. Neural activity was recorded using two identical Plexon Multichannel Acquisition Processor systems (Dallas, TX), interfaced with odor discrimination training chambers. Signals from the electrode wires were amplified 20X by an op-amp headstage (Plexon Inc, HST/8o50-G20-GR), located on the electrode array. Immediately outside the training chamber, the signals were passed through a differential pre-amplifier (Plexon Inc, PBX2/16sp-r-G50/16fp-G50), where the single unit signals were amplified 50X and filtered at 150–9000 Hz. The single unit signals were then sent to the Multichannel Acquisition Processor box, where they were further filtered at 250–8000 Hz, digitized at 40 kHz and amplified at 1–32X. Waveforms (>2.5:1 signal-to-noise) were extracted from active channels and recorded to disk by an associated workstation with event timestamps from the behavior computer. Waveforms were not inverted before data analysis.
Data analysis
Units were sorted using Offline Sorter software from Plexon Inc (Dallas, TX), using a template matching algorithm. Sorted files were then processed in Neuroexplorer to extract unit timestamps and relevant event markers. These data were subsequently analyzed in Matlab (Natick, MA). Activity on free- and forced-choice trials did not statistically differ as will be described in the results, thus for all analyses, free- and forced-trials were combined. All analyses were done on correct trials only. Units were characterized as increasing- or decreasing-type based on firing taken from poke entry to port exit compared to a 1s epoch taken prior to poke entry (baseline). This epoch was chosen because previous work in rats and monkeys has shown that activity in SNr changes prior to and during cues predicting future reward in addition to the initiation and execution of movements. Later, we break this epoch into two smaller epochs. The first examines activity after the odor is presented during the decision to move (odor onset to odor port exit) and the second examines activity after the nosepoke but prior to odor presentation to determine if activity reflects the locations of outcomes prior to any knowledge of which direction the rat will be required to orient toward. Wilcoxon tests were used to measure significant shifts from zero in distribution plots (p < 0.05). T-tests or anovas were used to measure within cell differences in firing rate (p < 0.05). Pearson Chi-square tests (p < 0.05) were used to compare the proportions of neurons.
RESULTS
As described in detail above, rats were trained on a choice task illustrated in Figure 1A (Roesch et al., 2007a; Roesch et al., 2009). On each trial, rats responded to one of two adjacent wells after sampling an odor at a central port. There were three different odor cues: one odor that signaled reward in the right well (forced-choice), a second odor that signaled reward in the left well (forced-choice), and a third odor that signaled reward at either well (free-choice). Across blocks of trials we manipulated value by increasing the length of the delay preceding reward delivery (Fig. 1A; block 1–2) or by increasing the number of rewards delivered (Fig. 1A; block 3–4). Essentially there were four types of rewards (short-delay, long-delay, big-reward and small-reward) and two response directions (left and right) resulting in a total of eight conditions.
As illustrated in Figure 1B–D, the rats’ behavior on both free and forced-choice trials reflected manipulations of value. On free-choice trials, in which they were free to choose which outcome they desired, rats chose shorter delays and larger rewards over their respective counterparts (Fig. 1B, ttest; df = 47; t’s > 8.47 p’s < 0.0001). Likewise, on forced-choice trials, rats were faster and more accurate when responding for a more immediate or larger reward (Fig. 1C–D; ttest; df = 47; t’s > 3.75; p’s < 0.0001). Thus rats perceived the differently delayed and sized rewards as having different values and were more motivated under short-delay and big-reward conditions than under long-delay and small-reward conditions.
Neural activity in SNr was modulated by response direction and expected value
We recorded 222 SNr neurons across 48 sessions in 12 rats during performance of all four trial blocks. None of the neurons reported here had the waveform shape typical of dopamine neurons and neurons firing less than ten spikes per second during baseline were excluded (Roesch et al., 2007a). Recording locations are illustrated in Figure 1E. Here we report data collected 7mm below brain surface through the extent of SNr. Final position of electrode was confirmed by histology. Consistent with previous reports, SNr baseline firing rates were high (mean = 35 spikes/second; SD = 20) and waveform durations were short (mean = 0.86 ms; SD = 0.47) (Gulley et al., 1999; Gulley et al., 2002b; Meyer-Luehmann et al., 2002; Deransart et al., 2003).
The activity of many SNr neurons was modulated by both the direction and the expected reward prior to movement initiation. This is illustrated in the single cell example in Figure 2A. Activity of this neuron reflected the integration of associative information about the value of the reward predicted by the cue and the subsequent response. Thus, cue-evoked activity prior to initiation of the response was strongest for the cue that indicated reward in the right well, and this neural response was highest when the value predicted for that well was high (on short and big trials).
Figure 2. Activity of single neurons in SNr reflects an interaction between expected value and direction.

A. Activity of a single SNr neuron averaged over all trials for each condition aligned on odor port exit during all 8 conditions (4 rewards × 2 directions). Histogram represents average activity over the last ten trials (after learning) for each condition in a block of trials. Each tick mark is an action potential and trials are represented by rows. All trials are shown. B. Results of a two-factor anova with value and direction as factors (p < 0.05). Firing rate was taken from odor onset to port exit. The height of each bar indicates the percentage of neurons that exhibited a main effect of value with no interaction effect, a main effect of direction with no interaction effect or an interaction between the value and direction with no main effects. For each group, cells were broken down by which condition elicited the strongest firing. C. Correlation between size (big − small/big + small) and delay (short−long/short+long) effects averaged across direction (odor onset to odor port exit). Data was taken after learning (last 10 trials for each condition within each block).
To quantify this effect across the entire population of SNr neurons (n = 222) we performed a 2-factor anova (p < 0.05) with value and direction as factors during the period starting at odor onset and ending with response initiation (Fig. 2A; epoch). Data was taken after rats had learned the contingencies between response direction and reward value (last 10 trials for each condition within each block of trials).
As in the single cell example, many neurons were significantly modulated by response direction and expected value. Eighty-six neurons (39%) exhibited a significant interaction between response direction and reward value with no main effects (Fig. 2B; right). The majority of these fired more strongly prior for movements made in the contralateral direction (Fig. 2B; chi-square = 20.4; df =1; p < 0.0001) and when the more valued reward was predicted (Fig. 2B; chi-square = 7.6; df = 1; p < 0.01).
Manipulations of expected delay and size influenced firing in SNr to a similar degree. The counts of neurons showing a significant interaction with either size or delay did not significantly differ (short = 35 (16%); long = 15 (7%); big = 34 (15%) small = 19 (9%); chi-square = 0.18; df = 1; p = 0.6736) and neurons across the entire population (n = 222) tended to fire similarly for expected outcomes of similar value. The correlation between size and delay effects is illustrated in Figure 2C, which plots the difference in cue-evoked activity (odor onset to port exit) on high and low value trials. Difference scores for delay (short − long/short + long) and size (big − small/big + small) were weakly correlated indicating that those neurons that tended to fire more or less strongly for cues predicting short delay tended to fire more or less strongly for cues predicting large reward (Fig. 2C; p < 0.0001; r2 = 0.09).
The majority of SNr neurons increased firing during nose poke and odor presentation
In the previous section, analysis of value and direction were conducted across the entire population of neurons in a non-arbitrary fashion. Previous work has divided neurons into increasing- and decreasing-type neurons based on firing rates observed prior to and during presentation of cues (Handel & Glimcher, 2000; Sato & Hikosaka, 2002; Joshua et al., 2009) or during nose pokes into recessed ports (Gulley et al., 2002a; b). As in these studies, we see a variety of different firing patterns during task performance. This is illustrated in Figure 3A which plots the average normalized firing rate across the trial aligned on odor onset for each neuron (represented by row). Clearly, most neurons showed increases in firing (warmer colors) during time spent in the odor port.
Figure 3. Activity of both increasing- and decreasing-type neurons exhibited an interaction between expected value and direction.

A. Each row represents the averaged normalized firing over time during the trial. Cells are sorted based on strength of firing during time in the odor port. How hot the color is depicts the strength of the normalized firing rate. B. Distribution of firing rate indices (poke epoch-baseline/poke epoch + baseline) indicating the difference between activity taken from odor port entry to odor port exit compared to baseline (1 second before nosepoke). Thus, values above and below zero represented increasing- and decreasing-type cells, respectively. Red and blue bars indicate those neurons whose activity was significantly stronger (increasing-type) or weaker (decreasing-type) during the poke epoch compared to baseline (ttest; p < 0.05). C. Results of a two-factor anova with value and direction as factors (p < 0.05) for increasing-type (top panel) and decreasing-type (bottom panel) cells. Firing rate was taken from odor onset to odor port exit. The height of each bar indicates the percentage of neurons that exhibited a main effect of value with no interaction effect, a main effect of direction with no interaction effect or an interaction between the value and direction with no main effects. For each group, cells are broken down by which condition elicited the strongest firing. D. Correlation between size (big − small/big + small) and delay (short−long/short+long) effects averaged across direction (odor onset to odor port exit) for increasing (gray circles) and decreasing-type (black diamonds) cells. Data was taken after learning (last 10 trials for each condition within a block of trials.).
To be able to compare our data to previous work that has divided SNr neurons into increasing- and decreasing-type neurons based on firing rate we computing the average firing rate from port entry to port exit for each neuron and asked if activity was significantly increased or decreased compared to baseline (1s prior to nosepoke; ttest; p < 0.05).
In the large majority of neurons, activity was increased above baseline during this analysis window (poke epoch). This is illustrated in Figure 3B which plots the difference between our “poke epoch” and baseline (divided by the sum) for each of the 222 neurons. In this plot, indices are significantly shifted above zero indicating that, across the population, activity was enhanced during the rats time in the odor port. Of the 222 neurons, 147(66%) showed a significant increase (Fig. 3B; red bars; ttest; p < 0.05) and 44 (20%) showed a significant decrease in activity (Fig. 3B; blue bars; ttest; p < 0.05). The number of increasing-type neurons significantly outnumbered decreasing-type neurons (chi-square = 55.4; df = 1; p < 0.0001) and the distribution of indices representing the difference between the poke epoch and baseline was significantly shifted in the positive direction (Fig 3B; Wilcoxon; z = −7.55; p < 0.0001; μ = 0.030).
Activity of both increasing- and decreasing-type neurons were modulated by expected value and response direction
Previous work in primates has demonstrated differences in the way that increasing- and decreasing-type neurons are modulated by expected reward value and response direction. Here, we repeat the analysis done in Figure 2 to determine whether we also see variations of encoding based on neuron type (increasing versus decreasing).
Of the increasing-type neurons (n = 147), 44(30%) showed a significant main effect of direction alone and 54(37%) showed a significant interaction between value and direction with no main effects. Of these, the majority fired significantly more strongly for contralateral versus ipsilateral (relative to recording site) movements (Fig. 3C; chi square = 5.9; df = 1; p < 0.05). Of those that showed a significant interaction effect with value, the majority fired significantly more strongly when the higher valued reward was predicted (Fig. 3C; chi square = 4.5; df = 1; p < 0.05). Fewer neurons than would be expected from chance alone showed main effects of value alone (Fig. 3C; chi-square = 1.6; df = 1; p = 0.2048).
The activity of decreasing-type neurons (n=44) showed a similar relationship with response direction and expected reward value as did increasing-type neurons. Eleven (25%) showed a significant main effect of direction alone and 16(36%) showed a significant interaction between value and direction with no main effects. Of these, the majority fired significantly more strongly for contralateral versus ipsilateral movements (Fig. 3C; chi square = 8.9; df =1; p < 0.05). Of those that showed a significant interaction effect with value, the majority fired more strongly when the higher valued reward was predicted, however this did not achieve significance (Fig. 3C; chi square = 0.56; df = 1; p = 0.4386). Fewer neurons than would be expected from chance alone showed main effects of value without a significant interaction effect (Fig. 3C; chi-square = 0.27; p = 0.5801).
Importantly, the proportions of neurons that fired significantly more strongly for high versus low value reward across these two populations did not significantly differ, suggesting that both types were similarly modulated by expected reward value and response direction (chi square < 0.0001; df = 1; p = 0.9966).
Finally, both types tended to fire similarly for similarly valued rewards. The correlation between size and delay indices for both types is illustrated in Figure 3D. Difference scores for delay (short − long/short + long) and size (big − small/big + small) blocks were significantly correlated indicating that those neurons that tended to fire more or less strongly for cues predicting short delay tended to fire more or less strongly for cues predicting large reward for both increasing (Fig. 3D; p < 0.05; r2 = 0.05) and decreasing-type neurons (Fig. 3D; p < 0.05; r2 = 0.16).
Neural activity prior to odor onset reflected the location of the cell’s preferred outcome
The integration of value and direction as described in the previous section is further illustrated across the entire population of increasing (n = 147) and decreasing (n =44) type neurons after learning (last 10 trials of each condition) in Figure 4A–B. Curves were collapsed across each neuron’s preferred direction and preferred outcome (designated according to the direction and outcome that elicited the highest average firing rate from odor onset to port exit). In these plots, “preferred” refers to the direction and outcome that elicited the strongest neural response, not the outcome or direction preferred by the animal. Thus, by definition, activity was highest in the preferred outcome/preferred direction trials (solid black) during presentation of the odor.
Figure 4. Activity in SNr was modulated by expected reward prior to odor onset.
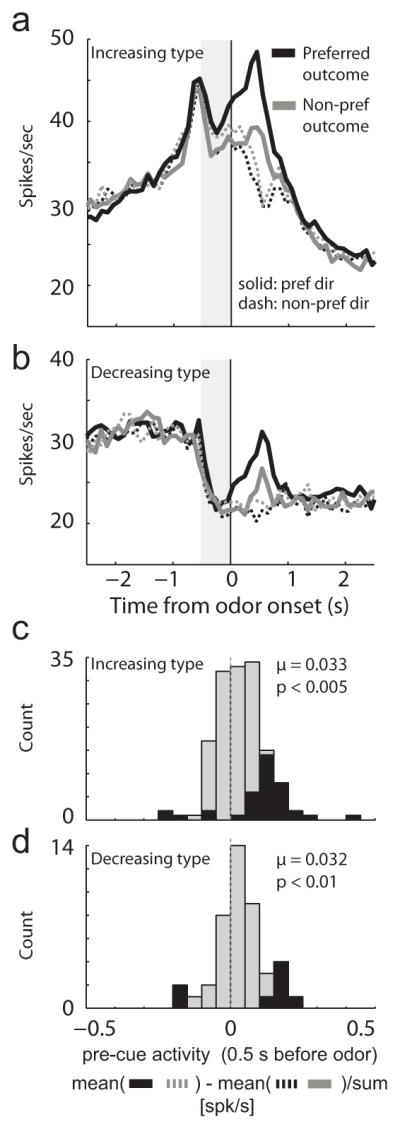
A–B. Curves representing population firing during performance for increasing (n = 147) and decreasing type (n = 44) neurons after learning (last 10 trials for each condition within each block). In this plot, for each neuron, direction and outcome were referenced to the max response before averaging, thus by definition, activity was higher in the preferred outcome/preferred direction (solid black) after odor onset (solid black = preferred outcome/preferred direction; solid gray = non-preferred outcome/preferred direction; dashed black = preferred outcome/non-preferred direction; dashed gray = non-preferred outcome/non-preferred direction). Data are aligned on odor onset; nosepoke occurred 500 ms prior. C–D. Distributions reflecting the difference between pre-cue firing (500 ms; gray bar) when the preferred outcome was in the cell’s preferred direction averaged across response direction. Thus, the x-axis reflects the difference between the average firing rate on the cell’s preferred outcome/preferred direction conditions and cell’s nonpreferred outcome/nonpreferred direction conditions (in both cases the cell’s preferred outcome was in the cell’s preferred direction) minus the average firing rate on preferred outcome/nonpreferred direction conditions and nonpreferred outcome/preferred direction conditions (in both cases the cell’s preferred outcome was opposite the cell’s preferred direction) divided by the sum of the two. Black bars represent the number of neurons that showed a significant difference between these conditions (ttest; p < 0.05).
Notably, value selectivity during odor delivery began before onset of odor instructing the nature of the trial (Fig. 4A–B; solid black > solid gray) for both increasing- and decreasing-type neurons. This change in activity cannot reflect the quality of the reward associated with the upcoming response because direction and outcome had not yet been signaled; instead, this activity must reflect the contingency between outcome and the location of the cell’s preferred outcome independent of the subsequent movement direction. This is further illustrated by examining activity for movements made in each cell’s non-preferred direction in these trial blocks; activity was stronger for responses to be made in the cell’s non-preferred movement direction (Fig. 4A–B; dashed) when the cell’s preferred outcome was in the cell’s response field for both increasing- and decreasing-type neurons (Fig. 4A–B; gray dashed > black dashed).
To quantify this effect further, we computed a firing rate index (500 ms before odor onset; gray bar), representing the difference between trials in which the preferred outcome was in or outside the cell’s response field for movements made in either direction (Fig. 4C–D). Each cell’s response field (preferred direction) was defined by the direction of the response that elicited the strongest firing during odor sampling (odor onset to port exit). For both types, this distribution was significantly shifted above zero (Fig 4C–D; Wilcoxon; z = −2.6; μ’s > 0.03; p’s < 0.01) and the counts of neurons exhibiting a significant increase outnumbered those showing a significant decrease. This achieved significance for increasing-type neurons (Fig 4C; black bars; 33 vs 5 neurons; chi-square = 20.5; df = 1; p < 0.0001) but was only a trend for decreasing-type neurons (Fig 4D; black bars; 6 vs 2 neurons; chi-square = 1.9; df = 1; p = 0.1573). The proportions of neurons showing significant pre-cue effects did not significantly differ between the two populations (33 vs 5 compared to 6 vs 2; chi square = 0.09; df = 1; p = 0.7596) and the two distributions did not significantly differ from each other (Fig. 4C vs Fig. 4D; z = 0.16; Wilcoxon; p = 0.8753).
Activity in SNr was correlated with motor output
Up to this point, “directional” activity may reflect the direction of the subsequent movement or the odor that signaled the movement. To deconfound activity related to odor identity and the behavioral response – one odor signaled left and one odor signaled right - we compared cue evoked activity on forced-choice trials with activity on free-choice trials (odor onset to odor port exit). This comparison can resolve this issue because on free-choice trials a different odor (than forced-choice) indicated the freedom to choose either direction (i.e. reward was available on each side). Thus, by comparing firing on free- and forced-choice trials, we can disambiguate odor from movement selectivity. If the directional signal identified on forced-choice trials reflects only the impending movement, then it should be identical on free- and forced-choice trials, provided the rat made the same response. This analysis is illustrated in Figure 5E, which shows the correlation between directional indices (contra−ipsi/contra+ipsi) for movements cued by free- (x-axis) and forced-choice (y-axis) odors. The significant positive correlation across the population indicates that neural activity was similar for a given direction, even when signaled by different odors (p < 0.0001; r2 = 0.759). This result is consistent with the notion that SNr is more closely tied to motor output as opposed to processing sensory information.
Figure 5. Activity in SNr was correlated with motor output.

A and C. Curves representing activity during fast and slow movements in preferred and non-preferred directions for neurons that showed a negative (A and B; n = 66) and positive correlation (C and D; n = 22) between firing rate (1s prior to the response) and reaction time (odor port exit minus odor offset). See text for details. Plots represent the fastest and slowest 25% of trials for each direction. B and D. Distribution of firing rate indices (poke epoch−baseline/poke epoch + baseline) indicating the difference between activity taken from odor port entry to odor port exit compared to baseline (1s before nosepoke). Thus, values above and below zero represented increasing- and decreasing-type cells, respectively. Black bars indicated those neurons whose activity was significantly stronger (increasing-type) or weaker (decreasing-type) during the poke epoch compared to baseline (ttest; p < 0.05). E. Correlation between directional indices (contra−ipsi/contra+ipsi) for movements cued by free- (x-axis) and forced-choice (y-axis) odors. Activity was taken from odor onset to odor port exit.
To further investigate SNr’s relationship with motor output, we asked in how many neurons was there a significant correlation (p < 0.05) between firing rate (1 s before response initiation) and reaction time (odor port exit minus odor offset) on a trial by trial basis. To avoid any confounds between reaction time and reward value (i.e. rats were faster for high valued reward as compared to low value reward) correlations were computed independently for high and low value conditions and then combined. Note, only 1 neuron showed an opposite firing rate/reaction time relationship between high and low value reward.
Out of the 222 SNr neurons recorded, 88 (40%) showed a significant correlation between reaction time and firing rate. Of those 88, activity of 66 and 22 neurons showed a significant negative and positive relationship with reaction time, respectively (chi-square = 21.9; df = 1; p < 0.0001).
Histograms for the population of neurons that showed a significant negative and positive correlation are illustrated in Figure 5A and C, respectively. Average firing rate is plotted for the fastest (black) and slowest (gray) 25% of trials for each direction (preferred = solid; nonpreferred = dashed). Activity is aligned to movement onset to examine activity just prior to movement initiation; that is why the peak related to odor port entry is shifted for fast compared to slow movements. By definition, activity was stronger in the cells’ preferred direction (solid lines) when the subsequent response was to be faster (solid black) for cells that showed a significant negative correlation (Fig. 5A), whereas activity was stronger when the subsequent response was to be slower (solid gray) for those cells that showed a positive correlation (Fig. 5C).
Interestingly, those neurons that showed a significant negative correlation tended to be of the increasing-type (Fig. 5A–B), whereas those that showed a positive correlation were equally distributed across the two populations of neurons (Fig. 5C–D). This is quantified in Figure 5B and D which illustrates the distribution of indices that indicated whether activity was increased or decreased relative to baseline (as in Fig. 3B). For neurons exhibiting a significant negative correlation, the distribution was significantly shifted above zero (Fig. 5B; Wilcoxon; z = −5.49; μ = 0.110; p < 0.001) and the counts of neurons exhibiting significantly higher firing rate during the poke epoch significantly outnumbered those showing the opposite effect (Fig. 5B; black bars; chi-square = 27.5; df = 1; p < 0.0001). The distribution of neurons exhibiting a significant positive correlation was not significantly shifted in either direction (Fig. 5D; Wilcoxon; z = −1.3; μ = 0.041; p = 0.192) and the counts of increasing- and decreasing-type neurons did not significantly differ (black bars; Fig. 5D; chi-square = 1.26; df = 1; p = 0.2513).
DISCUSSION
Expectation of reward motivates behavior; however it is still unclear how information about a desired reward is transformed into motor output in order to procure future reward. The basal ganglia is critical in this function as illustrated by a number of studies in which monkeys orient gaze to locations of high or low value (Hikosaka & Wurtz, 1983a; Lauwereyns et al., 2002; Sato & Hikosaka, 2002; Kawagoe et al., 2004; Samejima et al., 2005; Hikosaka et al., 2006; Nakamura & Hikosaka, 2006; Lau & Glimcher, 2007; 2008). It has been suggested that striatum guides movement via disinhibition of downstream motor areas through direct and indirect projections to SNr (Albin et al., 1989; Alexander & Crutcher, 1990; Mink & Thach, 1993; Maurice et al., 1999; Sato & Hikosaka, 2002; Kolomiets et al., 2003). Here we shed new light onto this mechanism by recording from single neurons in rat SNr during performance of a task in which we manipulate response bias by varying the size of and delay to reward in one of two fluid well locations.
Behavioral neurophysiology studies in rat SNr
Although there have been several studies that have examined firing patterns in SNr in behaving rats (Gulley et al., 1999; Gulley et al., 2002b; a; Meyer-Luehmann et al., 2002; Deransart et al., 2003; Deniau et al., 2007; Jin & Costa, 2010), few have looked at neural correlates in SNr in rats performing decisions for differently valued rewards. In one similar study, researchers recorded SNr activity during performance on a task in which rats were cued to respond to one of two ports to receive reward (Gulley et al., 2002b). During performance of the task the authors characterized activity patterns as increasing, decreasing, or a combination of the two. They showed that 48% of nose-poke related neurons increased firing while 24% decreased firing and 28% showed increases and decreases. This study shows, as we do, that there were a larger proportion of increasing-type neurons in rat SNr compared to decreasing-type neurons. These authors suggest that although inhibition of SNr may allow a desired motor response to emerge, excitations may help shape behavioral output by suppressing competing motor programs during task performance.
Our results replicate this finding and add to the rat literature by being the first to examine modulations of SNr in relation to different reward expectations. We show that varying expected reward size and delay to reward modulates activity of single neurons in SNr. In addition, value selectivity was present prior to presentation of cues indicating the nature of the upcoming behavioral response. Thus, activity in SNr represented the value of reward associated with a given action, prior to the decision to move, even when that action was not taken. These signals might reflect the rats’ response bias or preparatory set associated with the desire to move in a particular direction and are likely to be critical in guiding goal directed behavior (Lauwereyns et al., 2002; Sato & Hikosaka, 2002; Lau & Glimcher, 2007; Joshua et al., 2009).
Another similarity between these studies and ours is that both demonstrate that it is difficult to clearly divide cells into decreasing- and increasing-type neurons as done in primate work. It is clear from the heat plot in Figure 3A that there was a variety of task-related activity patterns in SNr. For example, some decreasing-type neurons actually showed increases in firing prior to presentation of odors and the subsequent behavior. As we will discuss below, this likely reflects the complexity of whole body movements that were required to perform this task and the need to inhibit the desired movement until the appropriate time in the task. For example, increases in activity prior to decreases related to exiting the odor port might reflect the need to more strongly inhibit that response until the imperative cue (odor offset) is signaled.
Behavioral neurophysiology studies in monkey SNr
In many aspects, our work is more comparable to work done in monkey SNr. In particular, Sato and Hikosaka manipulated the animal’s response bias by rewarding one location over another (Sato & Hikosaka, 2002) similar to the task presented here. In both experiments, decreasing-type neurons were more strongly modulated by high value reward before and during presentation of cues that instructed the direction of response. Increasing-type neurons were also modulated by expected reward; however the number of neurons enhanced by expected high and low value outcomes were not statistically different from each other in their study. Further, reward selectivity was not observed prior to presentation of directional cues for increasing-type neurons. From these results, they conclude that the overall response bias of the monkey would be controlled by decreasing-type neurons and that increases in SNr activity would non-selectively suppress other movements, thereby playing little role in actively directing behavior.
To the contrary, our data demonstrates a very important role of increasing-type neurons in biasing behavior toward more valued reward. First and foremost, increasing-type neurons outnumbered the decreasing-type neurons 3:1. Second, the number of increasing-type neurons that fired significantly more strongly for high value reward outnumbered those showing the opposite effect. Lastly, this modulation was evident prior to presentation of cues that instructed the response direction. Our data suggests that the overall effect of increasing-type neurons would contribute selectively to biasing or directing motivated behavior.
It is not entirely clear why these differences have emerged. The larger proportion of increasing-type neurons and their importance in directing behavior in our reward task might be related to the types of movements involved; complex body movements (rat) versus ballistic saccades (primate). Larger proportions of increasing-type neurons have been observed in tasks in which monkeys made elbow flexion movements (Magarinos-Ascone et al., 1992). It might also be related to the fact that body movements in our study were critical in directing the rat to the actual rewarded location whereas in the primate studies monkeys made eye movements to reward predicting visual targets but received reward from a spigot located near the mouth. Thus, the reward direction and the actual location of the reward that is subsequently delivered were different. In monkey tasks where the elicited response and stimulus are more in tune (e.g. cue that predicts air puff or reward elicits eye blink or licking, respectively) the number of increasing-type neurons were in the majority (Joshua et al., 2009). Together, these results suggest that the additional activation of increasing-type neurons in our study might be related to the more complex movement required to orient the animal to the correct location in space and time to procure reward. Although this explanation is attractive, we cannot overlook the possibility that the SNr is functionally or structurally different across species.
The importance of increasing-type neurons in directing goal-directed behavior
Our data stress the importance of increasing-type neurons in rat SNr. Increasing-type neurons in SNr are thought to arise from the indirect pathway. In the indirect pathway, signals from striatum are thought to project to GPe and then to STN prior to reaching the SNr (Alexander & Crutcher, 1990; Mink & Thach, 1993; Maurice et al., 1999; Redgrave et al., 1999; Gurney et al., 2001; Sato & Hikosaka, 2002; Kolomiets et al., 2003; Deniau et al., 2007). Since GPe and STN are inhibitory and excitatory, respectively, excitation of striatum is thought to increase activity in SNr.
Although decreases in SNr firing allow for initiation of desired movement through disinhibition, increasing-type neurons are thought to determine the behavioral output of the animal by shaping the movement in spatial and temporal domains (Mink & Thach, 1993; Kolomiets et al., 2003; Deniau et al., 2007). In other words, the increasing-type neurons guide the intensity and timing signaled by decreasing-type neurons so that the most behaviorally relevant and efficient motor output can be generated. Additionally, it has been suggested that the increasing-type neurons actively inhibit multiple conflicting movements from occurring simultaneously (Redgrave et al., 1999; Deniau et al., 2007). If the function of the increasing-type SNr neurons is to shape behavioral output by inhibiting competing motor outputs it seems logical that they would be in the large majority in tasks that involve complex body movements and that their activity would be negatively correlated with the strength of the motor output as we report here.
Although our results are consistent with notion that activity in SNr reflects motor output in this regard, it is worth noting that the correlations between delay and size were relatively weak. This might reflect the possibility that rats make slightly different movements when responding for differently delayed versus sized reward. The weak correlation also leaves the window open for the interpretation that SNr might function as more than a simple motor output structure as has been suggested by others (Handel & Glimcher, 2000; Gulley et al., 2002b; Sato & Hikosaka, 2002; Joshua et al., 2009; Wise, 2009; Jin & Costa, 2010). With that said, these signals were less associative in nature than those described previously in dorsal striatum in the same task (Stalnaker et al., 2010) suggesting that activity in SNr reflects the next stage of decision processing by which representations of expected reward start to get transformed into motor output. Future work is necessary to elucidate how information from different regions of basal ganglia are integrated into firing in SNr to fully understand how this circuit functions in normal and disease states.
Acknowledgments
This work was supported by grants from the NIDA (R01-DA015718, GS; K01DA021609, MR), NIA (R01-AG027097; GS).
References
- Albin RL, Young AB, Penney JB. The functional anatomy of basal ganglia disorders. Trends Neurosci. 1989;12:366–375. doi: 10.1016/0166-2236(89)90074-x. [DOI] [PubMed] [Google Scholar]
- Alexander GE, Crutcher MD. Functional architecture of basal ganglia circuits: neural substrates of parallel processing. Trends Neurosci. 1990;13:266–271. doi: 10.1016/0166-2236(90)90107-l. [DOI] [PubMed] [Google Scholar]
- Deniau JM, Mailly P, Maurice N, Charpier S. The pars reticulata of the substantia nigra: a window to basal ganglia output. Prog Brain Res. 2007;160:151–172. doi: 10.1016/S0079-6123(06)60009-5. [DOI] [PubMed] [Google Scholar]
- Deniau JM, Menetrey A, Thierry AM. Indirect nucleus accumbens input to the prefrontal cortex via the substantia nigra pars reticulata: a combined anatomical and electrophysiological study in the rat. Neuroscience. 1994;61:533–545. doi: 10.1016/0306-4522(94)90432-4. [DOI] [PubMed] [Google Scholar]
- Deransart C, Hellwig B, Heupel-Reuter M, Leger JF, Heck D, Lucking CH. Single-unit analysis of substantia nigra pars reticulata neurons in freely behaving rats with genetic absence epilepsy. Epilepsia. 2003;44:1513–1520. doi: 10.1111/j.0013-9580.2003.26603.x. [DOI] [PubMed] [Google Scholar]
- Gulley JM, Kosobud AE, Rebec GV. Amphetamine inhibits behavior-related neuronal responses in substantia nigra pars reticulata of rats working for sucrose reinforcement. Neurosci Lett. 2002a;322:165–168. doi: 10.1016/s0304-3940(02)00064-2. [DOI] [PubMed] [Google Scholar]
- Gulley JM, Kosobud AE, Rebec GV. Behavior-related modulation of substantia nigra pars reticulata neurons in rats performing a conditioned reinforcement task. Neuroscience. 2002b;111:337–349. doi: 10.1016/s0306-4522(02)00018-0. [DOI] [PubMed] [Google Scholar]
- Gulley JM, Kuwajima M, Mayhill E, Rebec GV. Behavior-related changes in the activity of substantia nigra pars reticulata neurons in freely moving rats. Brain Res. 1999;845:68–76. doi: 10.1016/s0006-8993(99)01932-0. [DOI] [PubMed] [Google Scholar]
- Gurney K, Prescott TJ, Redgrave P. A computational model of action selection in the basal ganglia. I. A new functional anatomy. Biol Cybern. 2001;84:401–410. doi: 10.1007/PL00007984. [DOI] [PubMed] [Google Scholar]
- Handel A, Glimcher PW. Contextual modulation of substantia nigra pars reticulata neurons. J Neurophysiol. 2000;83:3042–3048. doi: 10.1152/jn.2000.83.5.3042. [DOI] [PubMed] [Google Scholar]
- Hedreen JC, DeLong MR. Organization of striatopallidal, striatonigral, and nigrostriatal projections in the macaque. J Comp Neurol. 1991;304:569–595. doi: 10.1002/cne.903040406. [DOI] [PubMed] [Google Scholar]
- Heimer L, Zahm DS, Alheid GF. The Rat NErvous System. 2. Academic Press; San Diego: 1995. pp. 579–628. [Google Scholar]
- Hikosaka O, Nakamura K, Nakahara H. Basal ganglia orient eyes to reward. J Neurophysiol. 2006;95:567–584. doi: 10.1152/jn.00458.2005. [DOI] [PubMed] [Google Scholar]
- Hikosaka O, Sakamoto M, Miyashita N. Effects of caudate nucleus stimulation on substantia nigra cell activity in monkey. Exp Brain Res. 1993;95:457–472. doi: 10.1007/BF00227139. [DOI] [PubMed] [Google Scholar]
- Hikosaka O, Wurtz RH. Visual and oculomotor functions of monkey substantia nigra pars reticulata. III. Memory-contingent visual and saccade responses. J Neurophysiol. 1983a;49:1268–1284. doi: 10.1152/jn.1983.49.5.1268. [DOI] [PubMed] [Google Scholar]
- Hikosaka O, Wurtz RH. Visual and oculomotor functions of monkey substantia nigra pars reticulata. IV. Relation of substantia nigra to superior colliculus. J Neurophysiol. 1983b;49:1285–1301. doi: 10.1152/jn.1983.49.5.1285. [DOI] [PubMed] [Google Scholar]
- Hikosaka O, Wurtz RH. The basal ganglia. Rev Oculomot Res. 1989;3:257–281. [PubMed] [Google Scholar]
- Hoover JE, Strick PL. The organization of cerebellar and basal ganglia outputs to primary motor cortex as revealed by retrograde transneuronal transport of herpes simplex virus type 1. J Neurosci. 1999;19:1446–1463. doi: 10.1523/JNEUROSCI.19-04-01446.1999. [DOI] [PMC free article] [PubMed] [Google Scholar]
- Jin X, Costa RM. Start/stop signals emerge in nigrostriatal circuits during sequence learning. Nature. 2010;466:457–462. doi: 10.1038/nature09263. [DOI] [PMC free article] [PubMed] [Google Scholar]
- Joshua M, Adler A, Rosin B, Vaadia E, Bergman H. Encoding of probabilistic rewarding and aversive events by pallidal and nigral neurons. J Neurophysiol. 2009;101:758–772. doi: 10.1152/jn.90764.2008. [DOI] [PubMed] [Google Scholar]
- Kandel ER, Schwartz JH, Jessell TM. Principles of neural science. McGraw-Hill, Health Professions Division; New York: 2000. [Google Scholar]
- Kawagoe R, Takikawa Y, Hikosaka O. Expectation of reward modulates cognitive signals in the basal ganglia. Nat Neurosci. 1998;1:411–416. doi: 10.1038/1625. [DOI] [PubMed] [Google Scholar]
- Kawagoe R, Takikawa Y, Hikosaka O. Reward-predicting activity of dopamine and caudate neurons--a possible mechanism of motivational control of saccadic eye movement. J Neurophysiol. 2004;91:1013–1024. doi: 10.1152/jn.00721.2003. [DOI] [PubMed] [Google Scholar]
- Kolomiets BP, Deniau JM, Glowinski J, Thierry AM. Basal ganglia and processing of cortical information: functional interactions between trans-striatal and trans-subthalamic circuits in the substantia nigra pars reticulata. Neuroscience. 2003;117:931–938. doi: 10.1016/s0306-4522(02)00824-2. [DOI] [PubMed] [Google Scholar]
- Lau B, Glimcher PW. Action and outcome encoding in the primate caudate nucleus. J Neurosci. 2007;27:14502–14514. doi: 10.1523/JNEUROSCI.3060-07.2007. [DOI] [PMC free article] [PubMed] [Google Scholar]
- Lau B, Glimcher PW. Value representations in the primate striatum during matching behavior. Neuron. 2008;58:451–463. doi: 10.1016/j.neuron.2008.02.021. [DOI] [PMC free article] [PubMed] [Google Scholar]
- Lauwereyns J, Watanabe K, Coe B, Hikosaka O. A neural correlate of response bias in monkey caudate nucleus. Nature. 2002;418:413–417. doi: 10.1038/nature00892. [DOI] [PubMed] [Google Scholar]
- Levy R, Hazrati LN, Herrero MT, Vila M, Hassani OK, Mouroux M, Ruberg M, Asensi H, Agid Y, Feger J, Obeso JA, Parent A, Hirsch EC. Reevaluation of the functional anatomy of the basal ganglia in normal and Parkinsonian states. Neuroscience. 1997;76:335–343. doi: 10.1016/s0306-4522(96)00409-5. [DOI] [PubMed] [Google Scholar]
- Magarinos-Ascone C, Buno W, Garcia-Austt E. Activity in monkey substantia nigra neurons related to a simple learned movement. Exp Brain Res. 1992;88:283–291. doi: 10.1007/BF02259103. [DOI] [PubMed] [Google Scholar]
- Maurice N, Deniau JM, Glowinski J, Thierry AM. Relationships between the prefrontal cortex and the basal ganglia in the rat: physiology of the cortico-nigral circuits. J Neurosci. 1999;19:4674–4681. doi: 10.1523/JNEUROSCI.19-11-04674.1999. [DOI] [PMC free article] [PubMed] [Google Scholar]
- Meyer-Luehmann M, Thompson JF, Berridge KC, Aldridge JW. Substantia nigra pars reticulata neurons code initiation of a serial pattern: implications for natural action sequences and sequential disorders. Eur J Neurosci. 2002;16:1599–1608. doi: 10.1046/j.1460-9568.2002.02210.x. [DOI] [PubMed] [Google Scholar]
- Middleton FA, Strick PL. Basal-ganglia ‘projections’ to the prefrontal cortex of the primate. Cereb Cortex. 2002;12:926–935. doi: 10.1093/cercor/12.9.926. [DOI] [PubMed] [Google Scholar]
- Mink JW. The basal ganglia: focused selection and inhibition of competing motor programs. Prog Neurobiol. 1996;50:381–425. doi: 10.1016/s0301-0082(96)00042-1. [DOI] [PubMed] [Google Scholar]
- Mink JW, Thach WT. Basal ganglia intrinsic circuits and their role in behavior. Curr Opin Neurobiol. 1993;3:950–957. doi: 10.1016/0959-4388(93)90167-w. [DOI] [PubMed] [Google Scholar]
- Nakamura K, Hikosaka O. Role of dopamine in the primate caudate nucleus in reward modulation of saccades. J Neurosci. 2006;26:5360–5369. doi: 10.1523/JNEUROSCI.4853-05.2006. [DOI] [PMC free article] [PubMed] [Google Scholar]
- Ono T, Nishijo H, Nishino H. Functional role of the limbic system and basal ganglia in motivated behaviors. J Neurol. 2000;247(Suppl 5):V23–32. doi: 10.1007/pl00007780. [DOI] [PubMed] [Google Scholar]
- Rebec GV. Behavioral electrophysiology of psychostimulants. Neuropsychopharmacology. 2006;31:2341–2348. doi: 10.1038/sj.npp.1301160. [DOI] [PubMed] [Google Scholar]
- Redgrave P, Prescott TJ, Gurney K. The basal ganglia: a vertebrate solution to the selection problem? Neuroscience. 1999;89:1009–1023. doi: 10.1016/s0306-4522(98)00319-4. [DOI] [PubMed] [Google Scholar]
- Roesch MR, Calu DJ, Esber GR, Schoenbaum G. Neural correlates of variations in event processing during learning in basolateral amygdala. J Neurosci. 2010;30:2464–2471. doi: 10.1523/JNEUROSCI.5781-09.2010. [DOI] [PMC free article] [PubMed] [Google Scholar]
- Roesch MR, Calu DJ, Schoenbaum G. Dopamine neurons encode the better option in rats deciding between differently delayed or sized rewards. Nat Neurosci. 2007a;10:1615–1624. doi: 10.1038/nn2013. [DOI] [PMC free article] [PubMed] [Google Scholar]
- Roesch MR, Singh T, Brown PL, Mullins SE, Schoenbaum G. Ventral striatal neurons encode the value of the chosen action in rats deciding between differently delayed or sized rewards. J Neurosci. 2009;29:13365–13376. doi: 10.1523/JNEUROSCI.2572-09.2009. [DOI] [PMC free article] [PubMed] [Google Scholar]
- Roesch MR, Stalnaker TA, Schoenbaum G. Associative encoding in anterior piriform cortex versus orbitofrontal cortex during odor discrimination and reversal learning. Cereb Cortex. 2007b;17:643–652. doi: 10.1093/cercor/bhk009. [DOI] [PMC free article] [PubMed] [Google Scholar]
- Samejima K, Ueda Y, Doya K, Kimura M. Representation of action-specific reward values in the striatum. Science. 2005;310:1337–1340. doi: 10.1126/science.1115270. [DOI] [PubMed] [Google Scholar]
- Sato M, Hikosaka O. Role of primate substantia nigra pars reticulata in reward-oriented saccadic eye movement. J Neurosci. 2002;22:2363–2373. doi: 10.1523/JNEUROSCI.22-06-02363.2002. [DOI] [PMC free article] [PubMed] [Google Scholar]
- Selemon LD, Goldman-Rakic PS. Topographic intermingling of striatonigral and striatopallidal neurons in the rhesus monkey. J Comp Neurol. 1990;297:359–376. doi: 10.1002/cne.902970304. [DOI] [PubMed] [Google Scholar]
- Stalnaker TA, Calhoon GG, Ogawa M, Roesch MR, Schoenbaum G. Neural correlates of stimulus-response and response-outcome associations in dorsolateral versus dorsomedial striatum. Front Integr Neurosci. 2010;4:12. doi: 10.3389/fnint.2010.00012. [DOI] [PMC free article] [PubMed] [Google Scholar]
- Wise RA. Roles for nigrostriatal--not just mesocorticolimbic--dopamine in reward and addiction. Trends Neurosci. 2009;32:517–524. doi: 10.1016/j.tins.2009.06.004. [DOI] [PMC free article] [PubMed] [Google Scholar]
- Yoshida M, Precht W. Monosynaptic inhibition of neurons of the substantia nigra by caudato-nigral fibers. Brain Res. 1971;32:225–228. doi: 10.1016/0006-8993(71)90170-3. [DOI] [PubMed] [Google Scholar]