

Abstract
The goal of this work is to demonstrate the feasibility of using a diagnostic ultrasound system (Siemens Antares™ and CH6-2 curvilinear array) 1) to ablate ex vivo liver with a custom M-mode sequence and 2) to monitor the resulting tissue stiffening with 2-D Acoustic Radiation Force Impulse (ARFI) imaging. Images were taken before and after ablation, as well as in 5 s intervals during the ablation sequence in order to monitor the ablation lesion formation temporally. Ablation lesions were generated at depths up to 1.5 cm from the surface of the liver and were not visible in B-mode. ARFI images showed liver stiffening with heating that corresponded to discolored regions in gross pathology. As expected, the contrast of ablation lesions in ARFI images is observed to increase with ablation lesion size. This study demonstrated the ability of a diagnostic system using custom beam sequences to localize an ablation site, heat the site to the point of irreversible damage, and monitor the formation of the ablation lesion with ARFI imaging.
Keywords: Diagnostic ultrasound, HIFU, liver, ARFI imaging
Introduction
Localization and treatment monitoring during high-intensity focused ultrasound (HIFU) therapy is of key significance for successful clinical implementation. Exact registration between images of the region requiring therapy and the administration of HIFU is of vast importance to avoid or to minimize complications, such as skin burns, nerve fiber damage, and local pain.1 Reducing or eliminating damage to surrounding tissue is essential to patient comfort and the wide-spread acceptance of HIFU as an alternative to surgery, radio-frequency (RF) ablation, etc.2 As a result, automatically co-registered visualization of HIFU ablation using the same ultrasound transducer for imaging and therapy would be immensely useful and reduce costs. However, ablation lesions are not, in general, well visualized by conventional ultrasound B-mode imaging. Most clinical HIFU trials use magnetic resonance (MR) imaging and/or temperature monitoring in their treatment plans.1,3–7 MR imaging and temperature monitoring provides information sensitive to tumor margins and thermal dose; however, it is very expensive and requires specialized, integrated systems. Thus, an ultrasonic visualization method would be ideal because of the automatic co-registration and real-time visualization, if comparable localization and monitoring were possible.
Liver was determined to be a practical target organ for demonstrating the feasibility of intrasurgical spot ablations and developing an assay for optimizing ARFI visualization of HIFU ablation lesions with our diagnostic system. The temperature rise in a given tissue can be estimated using the bio-heat transfer equation, with the rate of heating in tissue due to sonication being proportional to the absorption and the acoustic intensity.8 Using the thermal conductivity, specific heat, and attenuation for different tissue types,9 the temperature rise in liver was determined to reach a maximum near the center frequency of the diagnostic, abdominal transducer used for our experiments (CH6-2, Siemens Medical Solutions USA, Inc., Issaquah, WA, USA). Looking forward with these studies, the liver is a clinically significant organ to target, with an estimated 24,120 new cases of liver and intrahepatic bile duct cancer in the United States in 2010.10 A diagnostic system could potentially provide HIFU therapy to stage I (one tumor that has not spread to nearby blood vessels) and possibly stage II (one tumor having spread to nearby vessels or more than one tumor with none larger than 5 cm) liver cancers intraoperatively.11 Taking depth limitations into account, this system would be most effective as a semi-invasive, intraoperative alternative (compared to alcohol injections or RF ablations) for small, non-resectable hepatocellular tumors and for some types of metastatic liver cancers. The benefit of HIFU therapy for the treatment of liver cancer has been demonstrated by Wu et al.,1 where concentric ultrasound imaging and therapy transducers were used for image guidance and ablation of hepatocellular carcinomas, showing the effectiveness, safety, and feasibility of HIFU for this application.
Accurate localization and monitoring of HIFU treatment is essential to improving the efficacy of the treatment and reducing side effects. In some clinical studies, ultrasound alone has been used for treatment planning and monitoring.12 B-mode images detect vapor bubbles and stable cavitation induced by HIFU but can miss inertial cavitation,13,14 which can lead to over-treatment. Several imaging techniques used to determine the mechanical properties of tissue, many ultrasonically based, have shown promise for monitoring thermally-induced lesions, such as those created with HIFU, without requiring boiling or cavitation. These techniques have shown promise in several tissue types, such as muscle, breast, liver, and cardiac tissue.15–19 Fatemi and Greenleaf developed an ultrasound-stimulated acoustic emission (USAE) technique, termed vibro-acoustography, whereby two ultrasound beams at slightly different frequencies are focused confocally to create a fluctuating energy density detected by a hydrophone and related to mechanical properties of tissue.20 Tissue stiffness variations with temperature and the onset of thermal coagulative necrosis have been monitored with USAE.21 By inducing a periodic radiation force in tissue, it has been shown that an oscillatory motion can be generated and monitored along a single axial RF line using localized harmonic motion (LHM) imaging.15,22 Using this method or an amplitude modulated variation to monitor HIFU,23 significantly reduced tissue motion was observed as a lesion formed.15 This observation is consistent with magnetic resonance elastography (MRE) results showing an increase in stiffness as irreversible tissue changes occur with heating.24 Super Sonic Imaging16, and Acoustic Radiation Force Impulse (ARFI) imaging have also shown stiffening during HIFU lesion formation17 and RF ablation.18,19,25 Liu and Ebbini have monitored displacements in response to pulsed sub-therapeutic HIFU beams at high pulse repetition frequencies (PRFs) and evaluated the temperature and/or viscoelastic responses with speckle tracking.26 Others have used heat-induced echo strain imaging to depict temperature rise, tissue expansion, and changes in speed of sound during heating.27,28 Elasticity imaging techniques using external compression29 or invasive RF ablation probes30 to induce displacements have also successfully monitored ablations.
In this paper, ARFI imaging is utilized for localization and thermal ablation monitoring. ARFI imaging is briefly described below; for a detailed description of ARFI imaging methods, the reader is referred to Nightingale et al.31 ARFI imaging utilizes focused acoustic radiation force to mechanically excite tissue and conventional ultrasonic correlation based methods to monitor the tissue response. In each lateral interrogation location, an ARFI ensemble includes a reference A-line, followed by a focused pushing beam that creates appreciable radiation force throughout the depth of field of the focused beam, followed by a series of tracking A-lines that are repeatedly transmitted along the push beam central axis at a relatively high repetition rate. The displacement response varies with depth as a function of both the applied radiation force and the underlying tissue stiffness, and high resolution tracking can be performed with overlapping small axial kernels to achieve depth resolution comparable to that of B-mode. When the structure of interest is larger than the push beam, as exhibited in most of the ablation lesions discussed herein, the ARFI image has better contrast.31 The ARFI beam ensemble is repeated over several lateral locations by electronically translating the lateral beam location to interrogate an entire 2D field of view as with conventional B-mode ultrasound imaging. Therefore, in the resulting 2D ARFI image (depth vs. lateral position), the tissue displacement is portrayed with high resolution both in the depth and lateral directions.32 The depth-dependent displacement profile, computed as the mean displacement over multiple lateral locations in a homogeneous region of tissue (adjacent unablated regions of liver herein), is used to normalize for depth and focal-gain dependent variations in the applied radiation force. In these normalized ARFI images more compliant tissues that displace farther appear brighter, and stiffer tissues that displace less appear darker. This displacement measurement will also be impacted by changes in attenuation. A linear increase in attenuation in the near-field to the displacement measurement would exponentially decrease the intensity reaching the depth of interest and, thus, decrease the radiation force and displacement seen at depth. Counteracting this is the fact that a linear increase in absorption at depth would increase the force and displacement. After correcting for these effects, a qualitative image of relative stiffness can be obtained. In in vivo scenarios, heterogeneity in the tissue may lead to improper normalization profiles and, thus, misinterpretation of the image data. In this case, an alternative normalization method could be employed, whereby an ARFI image of the region taken before ablation is used to normalize the images taken after the onset of heating.
We envision an ultrasound system that could perform HIFU therapy and provide automatically co-registered imaging feedback through the use of ARFI imaging. This would provide a low-cost alternative with high-quality monitoring capabilities for HIFU treatments. The goal of this work was to demonstrate the feasibility of using a diagnostic ultrasound system to perform spot ablations in liver with interleaved ARFI displacement imaging in order to monitor lesion formation.
Methods
Experimental Design
Prior to the experiment, a fresh piece of bovine liver was acquired, stored in a refrigerator, and used within five days of delivery from the butcher. A sample of liver (approximately the size of a fist, 10 × 8 × 5 cm (lateral × elevation × axial)) was degassed in a vacuum chamber for at least 2 hours (not in liquid). The liver was then removed and vacuum sealed in a plastic and nylon bag (FoodSaver®, Jarden Corporation, Wichita, KS) with a 3M™ Tegaderm™ (St. Paul, MN, USA) acoustic window in direct contact with the top of the tissue. The liver was affixed to a rigid support with sound absorbing rubber (Sorbothane Incorporated, Kent, OH, USA) directly underneath the liver sample (see Figure 1). The sample was then placed in a tank of degassed water that was continuously maintained at a temperature of 35.5±0.5°C (to simulate body temperature). B-mode imaging was employed to visually ensure that the Tegaderm™ was well coupled to the liver surface by checking for adequate SNR in the liver and the absence of reflections from air gaps. The sealed bag served to prevent the liver from softening or discoloring when submerged in water at body temperature. The transducer was placed in a cool (room temperature, ~25°C or less) waterbath with an acoustic window through which imaging and therapy occurred, which was then coupled to the surface of the heated water. The transducer was submerged in the cool water bath in order to prevent overheating. During periods of no insonification, a custom-built filtration, degassing, and cooling system circulated the water around the transducer. With this setup (see Figure 1), extended duration heating sequences (1100–1283 W/cm2, 25 cycles, 11.3 kHz PRF, 4.44 MHz transmit, 60–120 s duration (stop-start) per heating location (subsequently referred to as an elementary spot)) were evaluated with interspersed ARFI image monitoring. While the range of Isppas is consistent with those typically used in HIFU, the 6% duty cycle, necessary to preserve the integrity of the transducer, results in low temporal average intensities and, thus, requires longer insonification durations. Sufficiently degassed locations with no observable air bubbles in B-mode and ARFI images were selected for heating; images were recorded before, during, and after heating.
Figure 1.

Schematic of setup for HIFU testing including cooling of the transducer (≤ room temperature), heated water bath (35–36°C) for liver, and mounting of liver (black sound absorbing rubber between liver and metal holder). Note that the bottom boundary of the cool water bath (WC) was a Tegaderm™ acoustic window. The liver was packaged in a FoodSaver® bag with a similarly sized Tegaderm™ acoustic window on its top surface.
Transducer and Imaging System
A commercially available diagnostic curvilinear transducer array (CH6-2) was driven by a modified Siemens SONOLINE™ Antares ultrasound system to perform HIFU ablation and ARFI imaging in this study. The CH6-2 is typically used for abdominal imaging and has a center frequency of 4.4 MHz. It consists of an array of 192 elements that are 0.3 mm wide (lateral) by 1.2 mm tall (elevation). This transducer has a fixed focus of 6.9 cm in elevation (F/5.75), and can be dynamically focused electronically in azimuth (5 cm focus used herein). This transducer was chosen for its relatively higher power output capabilities compared to other available diagnostic transducers in our laboratory. By taking into account the trade-off between the exponential nearfield attenuation losses in the tissue as well as the linear increase in heat with increasing tissue absorption, the center frequency of this transducer was also optimal in terms of maximizing the temperature rise at the focal spot. The modifications to the Antares were strictly done in software to create custom beam sequences; no hardware modifications were necessary. The experimental design also employed a 3.5 to 4.5 cm room temperature water path standoff, both in order to avoid near-field loss of acoustic energy and to provide a passive heat-sink for the transducer array.
HIFU Pulse Sequence Design
Due to comparable transducer and focal heating at low PRFs and nonlinear losses in water at higher system voltages,33 HIFU sequences were developed with a high PRF and a low system voltage. Thermocouple measurements (as described below) in liver were performed to determine the optimal parameters for a 20–60 second sequence in order to maximize heating using this system. All trial M-mode sequences transmitted 4.44 MHz sinusoidal pulses focused at 5 cm with an F/1.5 configuration in the lateral direction, and a 4.5 cm water-path standoff. Pulse durations between 5.6 and 9.0 μs, PRFs between 7.1 and 12.8 kHz, and Isppas between 958 and 1283 W/cm2 were evaluated. (Throughout this document, Isppas are reported as measured in water, non-derated, unless otherwise specified.) The optimal parameters for our configuration were determined to be 5.6 μs pulses at 11.3 kHz transmitted at 1100–1283 W/cm2 Isppa in order to maximize tissue heating without damaging the transducer. The resulting 6.4% duty cycle used for performing HIFU with a diagnostic transducer is much lower than the 50–100% duty cycle typically seen with traditional HIFU devices,15,28,34–38 although others have employed lower duty cycles in the range of 6.25% to 50% for all or a portion of the HIFU treatment.13,39
ARFI Sequence Design
ARFI image sequences using the parameters shown in Table 1 were used. Beamformed RF data was obtained from the Antares. Then, normalized cross-correlation with overlapping kernels (3λ kernels) was used to calculate the displacements at all spatial locations, as described by Pinton et al.40 In this way, a 2-D ARFI image could be synthesized for any time after the high-intensity, long-duration excitation used to induce displacements in the tissue.
Table 1.
ARFI imaging parameters for HIFU monitoring.
| Lateral Locations | 30 |
| Lateral Spacing | 0.25° |
| Push Frequency | 4.44 MHz |
| Push F/# | 2 |
| Push Apodization | No |
| Push Focus | 5 cm |
| Track Frequency | 6.67 MHz |
| Track F/# | 2.2 |
| Track Apodization | Yes |
| Track Focus | 5 cm |
Gross Histologic Analysis
For a subset (11) of the HIFU-generated lesions, the liver sample (still enclosed within the plastic and nylon bag to prevent freezer burn) was placed in the freezer (−20°C) after ablation and imaging were completed. Freezing was performed to facilitate manual slicing of the tissue without formalin fixation, which would cause global discoloration of the tissue. After at least 3 hours for freezing, the samples were removed and a razor blade was used to cut sections in the lateral-axial plane (as defined by the imaging geometry) every ~3 mm in elevation until the area under the Tegaderm™ acoustic window was fully sectioned. In each section, ablated tissue was delineated from healthy tissue by visual observation of a lighter discolored region compared to the surrounding tissue. A digital photograph of each section was taken with a scale bar, and the discolored region (lesion) was semi-automatically outlined in the image, as described below, to calculate the spatial extent of the lesion (see Figure 2c,d).
Figure 2.
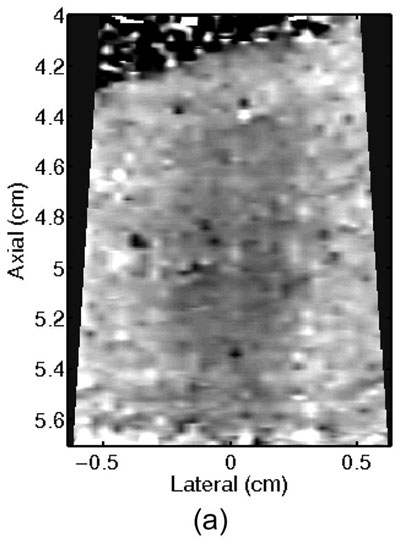
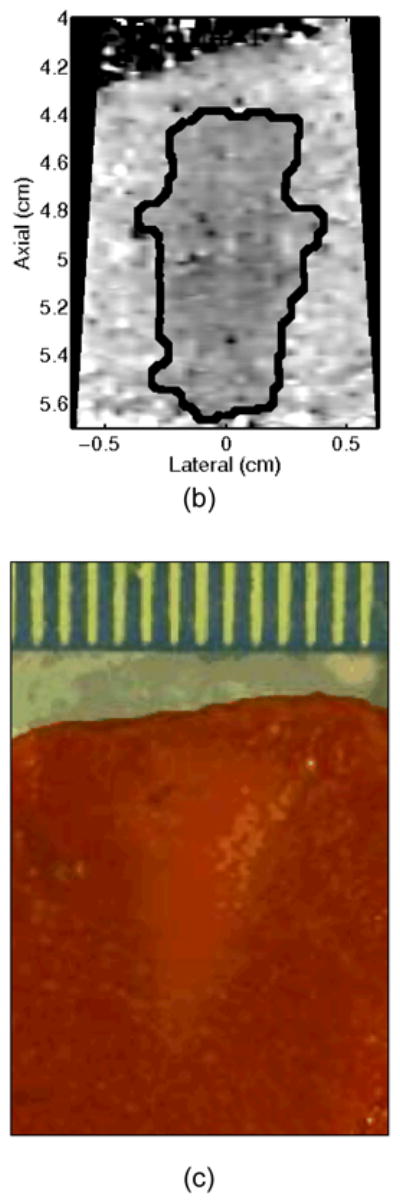
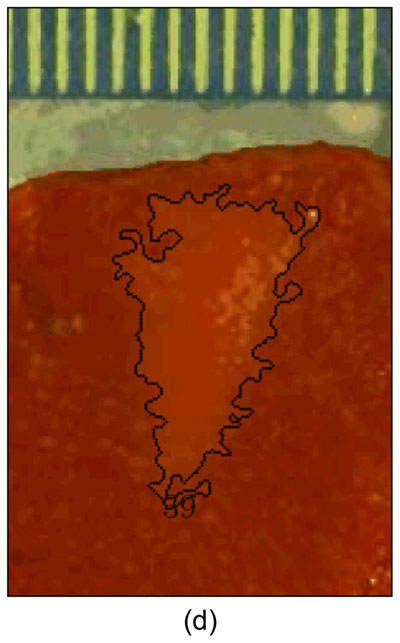
A single elementary spot lesion created with 120 s of HIFU (1283 W/cm2, 5.6 μs pulses at a PRF of 11.3 kHz with a transmit frequency of 4.44 MHz) insonification. ARFI image acquisitions were interspersed every 5 seconds to monitor lesion growth during ablation. a) The ARFI image after 115 s of heating. Focal gain compensation through depth has been applied to this image. Part of the water path is visible in the upper left. b) The image in a) with the semi-automated segmented lesion boundaries outlined in black. c) The corresponding gross pathology photograph for this lesion. d) The image in c) with the semi-automated segmented lesion boundaries outlined in black. For scale, a metric ruler (mm markings visible) is shown at the top of the pathology photographs.
Image Analysis
In order to provide outlines of the lesions in ARFI images and gross pathology photographs for shape and size comparisons, a semi-automatic segmentation routine was developed.41 For ARFI images with focal gain compensation applied, the lesion center was assumed to be at the 0 cm lateral and 5 cm axial as specified by the HIFU beam focus. The mean and standard deviation of the displacement in a 0.15 cm × 0.50 cm (lateral × axial) rectangle centered about the focus in the image of interest was calculated, and a lesion mask was defined as any pixel with a value below this mean plus three standard deviations. (This threshold was determined by optimizing the correlation between the semi-automatic segmentation and manual segmentation on a subset of images.) Morphological processing (opening and closing) was then used to remove small spurs and holes from the lesion mask caused by noise in the measurements.41 The lesion outline was then calculated from zero-crossing edge detection of the lesion mask containing the pre-defined lesion center. A similar method was used for the gross pathology photographs. These images were converted to gray-scale for segmentation, and the user defined the lesion center. Without exact registration between the HIFU beam axes and photograph axes (long axis of rectangle in axial direction), the region used to calculate the threshold here was defined as a square (0.05 cm × 0.05 cm). For the histology images, any pixel above the mean minus three standard deviations was assigned to the lesion mask. The subsequent steps mirrored those for the ARFI images. This thresholding routine was validated by comparing the results to several manually assigned lesion outlines to ensure that the shape and size were similar.
In order to monitor lesion contrast through time as the lesion formed, a rectangle (covering 0.15 cm laterally and 0.5 cm axially) centered on the focal point was defined in each ARFI image that was obtained during the ablation sequence. The contrast of visualized lesions was computed using the relation contrast = 1 μi/μo,31 where μi is the mean ARFI image brightness inside the ablation lesion (rectangle), and μo is the mean value in a laterally offset rectangular region outside of the lesion, as determined by the segmented lesion extent.
Calibration and Verification
Intensity Measurements
Focal intensity measurements were performed in water with the CH6-2 transducer directly coupled to a 3-D stepper motor controlled translation stage (Newport, Irvine, CA) and positioned parallel to a calibrated membrane hydrophone (Model 804, 0.6 mm active diameter, Sonic Technologies, Wyndmoor, PA; Model HMA-0200, 0.2 mm active diameter, Onda Corporation, Sunnyvale, CA). The manufacturer quoted precision of the calibration factor for voltage to pressure conversion is ±1.0 dB for both hydrophones and was the dominant source of error in these measurements. An automated alignment protocol to find the position corresponding to the peak pressure was performed using custom LabView (National Instruments, Austin, TX) programs written to control the translation stage and the ultrasound scanner. The pressure waveforms were measured at the focus for a 10 cycle, 4.44 MHz, unapodized pulse, focused at 5 cm using F/1.5 (HIFU) and F/2 (ARFI push) lateral focal configurations. (This pulse is shorter than the actual heating and pushing pulses employed in the experiments in order to preserve the integrity of the hydrophone and prevent mechanical damage.) The spatial-peak pulse-average intensities with and without the Tegaderm™ waterbag in place were used to calculate the loss through this material.
Hydrophone measurements indicated a 2.7±0.4% loss through a 0.75±0.25 mm thick Tegaderm™ waterbag using the HIFU and ARFI excitation focal configurations herein. For a non-derated Isppa of 1283 W/cm2, the derated Ispta at 5 mm depth in liver for the HIFU sequence (without interspersed ARFI) was 60 W/cm2 in situ, as compared to 121–3000 W/cm2 in situ as seen in the literature for durations from 20 s to as low as 800 ms.17,42 It should also be noted that intensity measurements were made to test the impact of the metal stand and absorbing rubber (upon which the liver rested during experiments) on the intensity. Differences between the intensities measured with and without the stand in place were less than the error of the hydrophone calibration and were, therefore, neglected.
Thermocouple Measurements
In order to determine the feasibility of achieving the thermal dose required to ablate liver tissue with our system, the focal heating through time for several custom HIFU sequences was measured. Fresh bovine liver samples were acquired from a butcher. A 30-gauge, hypodermic needle, type-T thermocouple (Omega Engineering, Inc., Stamford, CT, USA) was placed perpendicular to the acoustic axis at a depth of ~7 mm in bovine liver sealed in a plastic and nylon bag with a Tegaderm™ acoustic window. The liver and transducer were setup in the same manner as during the HIFU experiments (as previously described in the experimental design section), except the water surrounding the liver remained at room temperature in order to prevent ablation during the multiple temperature measurements. An automated alignment protocol was performed for these experiments using the stepping motor translation stage controlled by a custom LabView program to find the position corresponding to the peak temperature.
To avoid viscous heating artifacts that arise from the interaction between the acoustic field and the thermocouple,43,44,45 the transducer was then repositioned so that the thermocouple was outside of the lateral beamwidth, near the second null of the beam pattern. A similar method using measurements in the first null was employed and described by Holt and Roy.46 We extended this measurement method by using the linear bio-heat transfer equation8 to provide an estimate of the corresponding temperature rise at the center axis of the beam, understanding that complex nonlinear effects would impact the actual temperature rise. The thermal and ultrasonic liver properties used were specific heat (cv=3.4 MJ/K/m3), thermal conductivity (K=0.50 W/m/K), and ultrasonic attenuation (α=0.5 dB/cm/MHz).9
Temperature data were recorded at a sampling rate of 1000 Hz with a Personal DAQ 3000 (Omega Engineering, Inc.). To reduce noise in the temperature data, a low-pass filter with a cutoff frequency of 1 Hz was first applied. The baseline temperature was calculated as the average of 5 seconds of acquisition before the onset of the therapy sequence. The maximum temperature rise above baseline for each sequence was recorded. Three repetitions of each measurement were performed in the thermocouple readings without repositioning the thermocouple, and the average and standard deviation of the three measurements were recorded.
Results
A maximum temperature of 66.6°C at the focus (baseline = 36.0°C, 30.6°C rise) was achieved with a 1283 W/cm2 60 second sequence with an 11.3 kHz PRF and 5.6 μs, F/1.5, unapodized pulses focused at 5 cm. The maximum temperature rise achieved when interspersing ARFI sequences every 5 seconds was 7–8% less than that measured for the uninterrupted 60-second heating sequence. It should also be noted that, with the aid of the cool water bath surrounding the transducer, the face heating remained below a 17.9°C rise (45.8°C absolute) for the various HIFU sequences (varied interspersed ARFI imaging) used to create lesions herein.
A total of 25 ablation lesions in 9 liver samples were successfully created and visualized in ARFI images with the system. These lesions were created at different depths, with varying types and durations of interspersed ARFI imaging. The intensities were between 1100–1283 W/cm2, with durations of between one and two minutes, and with the contrast in ARFI images increasing with increasing HIFU duration.
A representative example of ARFI lesion visualization is shown in Figure 2. After heating in one elementary spot for 120 seconds was completed, ARFI images (a,b) were compared to a gross pathology photograph (c,d) of the lesion. Lower displacements, or darker pixels, indicate stiffening and thus lesion formation in the ARFI images, while lighter colors are an indication of lesion protein denaturation in the gross pathology photographs. The area observed in ARFI was 0.68 cm2, while it was 0.44 cm2 in pathology. Area comparisons between ARFI and pathology for 5 different lesions obtained using identical heating protocols and ARFI beam sequences for a single elementary spot are given in Table 2. The area measurements for each image type are consistent, as indicated by the standard deviations in the last column of Table 2. However, the areas measured in the ARFI images are significantly larger (p < 0.05) than those measured in gross pathology, indicating a bias. Typical HIFU treatment regimens involve moving the transducer to ablate several different locations, or elementary spots, in order to destroy large tumors. Thus, visualization of the growth of an ablated region using multiple elementary spots was also investigated.
Table 2.
Comparison of segmented area sizes (cm2) in ARFI images and gross pathology for five separate lesions.
| Trial | 1 | 2 | 3 | 4 | 5 | Mean ± SD |
|---|---|---|---|---|---|---|
| ARFI | 0.65 | 0.50 | 0.49 | 0.50 | 0.44 | 0.52 ± 0.08 |
| Pathology | 0.44 | 0.31 | 0.37 | 0.48 | 0.27 | 0.37 ± 0.09 |
Figure 3 shows ARFI images in the central imaging plane of a thermal lesion that appears to be growing not only in the lateral dimension (0.5 mm between centers of elementary spots laterally) but also toward the transducer in the axial direction with increasing numbers of elementary spot ablations. The semi-automated lesion boundaries of the stiffening with ablation are indicated by the black line. Due to the low contrast associated with individual elementary spot ablations, it is useful to compare ARFI images before and after ablation (e.g., Figure 3a with 3b–e) rather than examining independent images in order to discern changes caused by ablation. Furthermore, as more spatially overlapping elementary spots are ablated to increase the volume of ablated tissue, both the size and contrast of the observed lesion in this imaging plane increases (i.e., the lesion appears to stiffen). It is also noted that this protein-denatured lesion was not visible in B-mode. Even when the lesion contrast in ARFI was 0.67 (Fig. 3e, after heating of 21 elementary spots in a 7×3 (lateral × elevation) grid pattern), there was no B-mode hyper-echogenicity indicative of a lesion. In fact, no evidence of lesion formation was noted in any of the B-mode images from this study.
Figure 3.


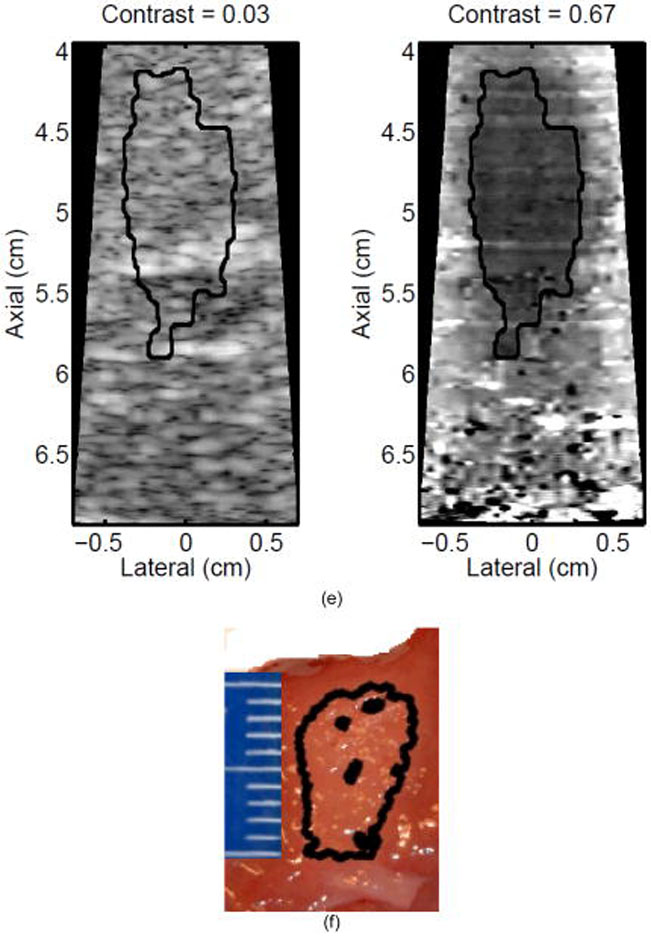
B-mode (left) and ARFI (right) images showing the growth of an ablation lesion as increasing numbers of spatially offset adjacent elementary spots are insonified (1100 W/cm2, 5.6 μs pulses at 11.3 kHz PRF with a transmit frequency of 4.44 MHz for 60 s segments at each spot). Semi-automated lesion boundaries are outlined in black. Elementary spots were offset from one another by 0.5 mm laterally or 2 mm in elevation. a) Before any heating, b) One spot, c) 3 spots offset in elevation, d) 3×3 (lateral × elevation) grid of spots, and e) 7×3 grid of spots. Focal gain compensation through depth has been applied to all of these images. (All images are displayed with the same dynamic range.) Red and yellow rectangles in b) indicate the regions over which contrast was calculated. The ARFI image for the 7×3 grid (e) indicated a lesion area of 0.82 cm2, which was in good agreement with the gross pathology (f) area of 0.68 cm2 for this large, high-contrast lesion.
Monitoring lesion formation as the tissue is heated, as opposed to between elementary spots, is important to avoid over-exposing the tissue at the focus or damaging intervening tissue not in the target region. Figure 4 shows ARFI monitoring of lesion formation at 10-second intervals obtained by interspersing short ARFI image acquisitions during the 120-s of heating for a single elementary spot. The initiation of lesion formation, or apparent stiffening of the liver, is seen in Figure 4f. As the lesion continues to grow with increasing ablation time (Figures 4f–4l), the contrast and area increase. These increases are shown for five lesions at similar depths (6.8 ± 2.2 mm) formed with the same heating regimen in Figure 5. It should be noted that jitter, or noise, in ARFI displacement estimates can lead to small fluctuations in the contrast and area measurements as determined by the automated algorithms used herein.
Figure 4.

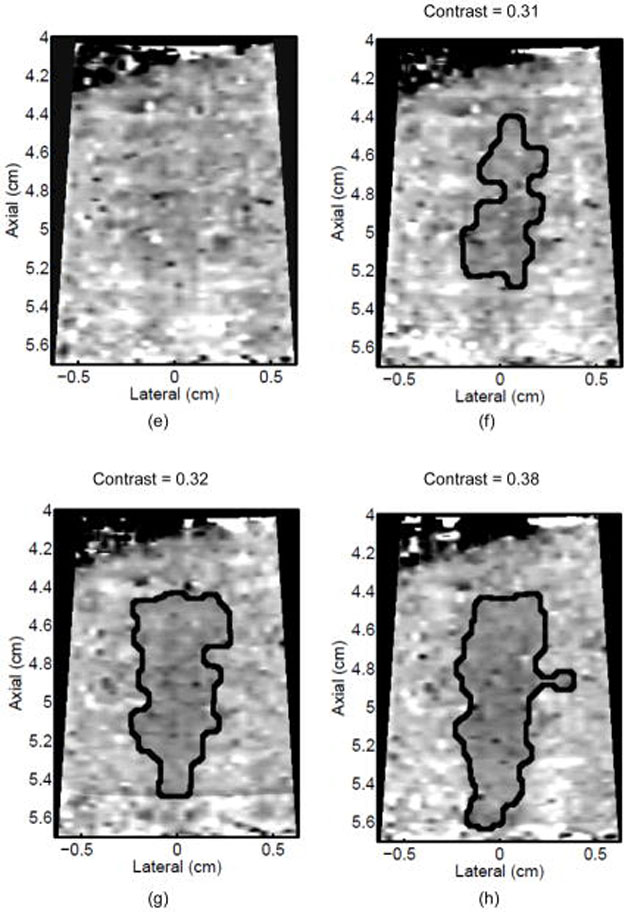
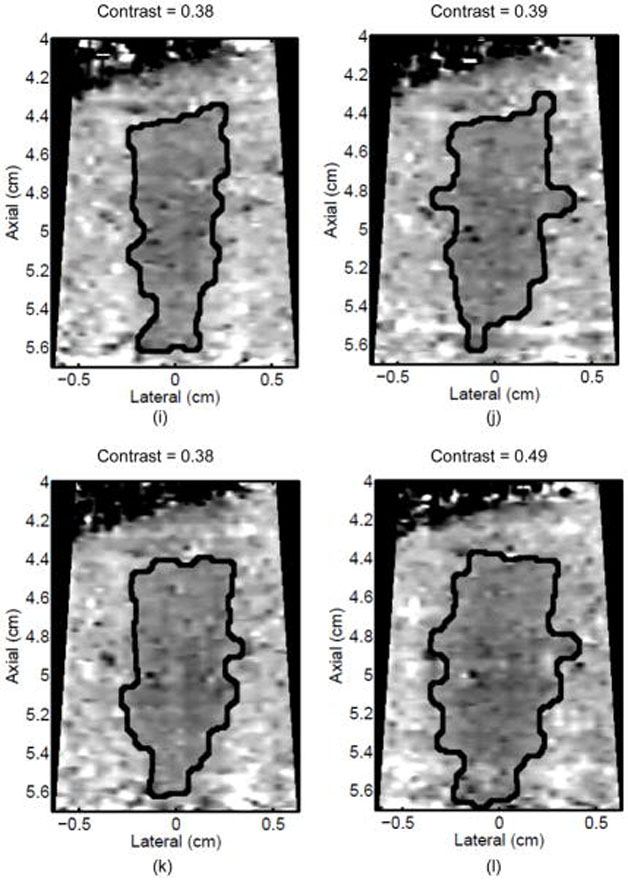
ARFI images taken immediately before the start of HIFU ablation in a single elementary spot (a total of 120 s of heating using 1283 W/cm2, 5.6 μs pulses at 11.3 kHz PRF with a transmit frequency of 4.44 MHz) and then at 10-s intervals interspersed during the ablation (a-0 s, b-10 s, c-20 s, d-30 s, e-40 s, f-50 s, g-60 s, h-70 s, i-80 s, j-90 s, k-100 s, l-110 s) are shown. Focal gain compensation through depth has been applied to all of these images. (All images are displayed with the same dynamic range.) Red and yellow rectangles in b) indicate the regions over which contrast was calculated. Part of the water path is visible in the upper left. The segmented lesion boundary is outlined in black.
Figure 5.

a) Mean and standard deviation of the ARFI contrast of 5 ablation lesions formed as that shown in Fig 4, with the same HIFU and ARFI sequences at depths of 6.8 ± 2.2 mm in the liver. b) Corresponding segmented areas of the developing ablation lesions during the duration of the ablation.
Discussion
This work demonstrated the use of a diagnostic ultrasound system with a single transducer array for interleaved imaging and ablation therapy. High-quality, high-resolution imaging of structures is an advantage of diagnostic systems, but it comes at the expense of decreases in acoustic output and greater losses in the array. We have shown that a commercial diagnostic system and a specific experimental design (i.e., external passive cooling with water) can be used to ablate tissue without any hardware modifications. Using our custom M-mode sequences through a waterbath, which clearly exceed the FDA limits for diagnostic ultrasound,47 lesions were formed in ex vivo bovine liver (pre-heated to near body temperature), monitored with ARFI imaging, and validated with gross pathology. In order to reduce internal heating within the transducer, it was necessary to submerge the transducer (a few cm above the lens) in room temperature water and to employ a 6% duty cycle. With this simple cooling method and temporal heating design, peak tissue temperature rises were near 30°C, and ablation lesions were formed up to 1.5 cm deep in tissue. Using the same transducer elements actuated during therapy for ARFI imaging, 2-D images of the changing stiffness in the ablated region relative to unheated tissue were used for HIFU monitoring.
ARFI imaging was shown to have superior ablation lesion monitoring capabilities to those of B-mode. While protein-denatured lesions can be seen in ARFI images, B-mode imaging provided no feedback (see Figure 3). According to Lizzi et al.,17 the liver would need to be overexposed to HIFU until gaseous bodies formed in order for B-mode to indicate any lesion formation. Consistent with previous work from other types of elasticity imaging of HIFU lesions in the literature, 2D ARFI imaging provides a useful tool for monitoring lesion formation, which is a low-cost alternative to MR guidance.
Despite its improvement over B-mode monitoring, challenges in determining the exact lesion size with ARFI imaging as compared to that portrayed in pathology images (Table 2) may have been caused by misalignment between imaging and histological planes, the mechanics of the displacement observed through time in ARFI images, imaging artifacts, and freezing. Because a single transducer is used for both ablation and ARFI imaging, the ARFI image is guaranteed to be in the ablation lesion center, which is the largest cross-section of the lesion. However, the 3 mm gross pathology slices were not likely exactly aligned with the central lesion plane. Given the relatively small sizes of the lesions, misalignment between the imaging planes in pathology and ARFI would result in differences in lesion sizes, namely a smaller area in pathology. In addition, the resolution of a lesion in an ARFI image is dictated by the dimensions of the pushing and tracking beams and the mechanical contrast of the lesion. Larger ARFI push beam cross-sections tend to average the displacements of neighboring tissue volumes and, thus, can blur the boundaries of a stiff inclusion. Standard ARFI pushing beams, like those used herein, use a lateral focal configuration of F/2; however, in order to maximize heating, a tighter focus of F/1.5 was used for the HIFU sequence. Thus, smaller lesions, such as those in Figures 2a and 3b, had lower contrast than larger ones, such as the example shown in Figure 3e. In future studies, tighter focal configurations for the ARFI pushing beams will be examined for this application. It has also been shown that stiff inclusions have an apparent growth through time after the displacement excitation in ARFI images, thus the ARFI images may slightly overestimate the lesion area.48 Noise, or jitter, can also confound the lesion boundaries. The median filtering used to reduce the noise before semi-automatic segmentation may have also contributed to slight over-estimation of the lesion area. The displacement variation within a lesion also impacted the threshold used for segmentation of the image. Finally, freezing the tissue to facilitate slicing may have been another source of the size discrepancy.
A specific beam geometry limitation with this system was the fixed F/# in the elevation dimension. For maximum ARFI image contrast, the cross-section of the pushing beam must be smaller than the cross-section of the structure being imaged.31 When the same linear transducer array is used for HIFU ablation and ARFI imaging, the lateral aperture can be modified electronically, however, the elevation aperture for both beams is identical. As a result, maximum contrast is not achieved unless multiple elementary spots are used to increase the size of the ablation lesion in the elevation dimension. This is evidenced by the increase in contrast as additional elementary spots are ablated in elevation, as shown in comparing Figure 3b and 3c. A 2D imaging transducer could improve the ability of ARFI to accurately resolve the size of a lesion by allowing electronic control of the beam geometry in both dimensions.
Another challenge for this system was the trade-off between depth penetration and resolution. A decrease in frequency allows for greater depth penetration for heating and ARFI excitations, but at the expense of larger ARFI excitation beamwidths and, thus, coarser resolution and lower contrast. Typically, the inherently large bandwidth of a diagnostic transducer allows use of a lower frequency for ablation and ARFI pushing pulses than for conventional B-mode imaging with the same probe (i.e., pushing/ablating at 4.44 MHz and B-mode imaging at 6.67 MHz as was accomplished herein). With the transducer frequencies used herein, the system would be limited to an intraoperative scenario, where the normally deep-seated liver is already exposed. Furthermore, the propensity for delamination and other forms of diagnostic transducer failure at high power levels49 limit the depth at which lesions may be formed with a diagnostic system. These limitations will also pose a challenge for creating lesions in vivo because liver is such a highly perfused organ. Therefore, although lesions were successfully generated with this system in ex vivo samples, it is likely that in vivo implementations will require a modified transducer for increased acoustic output, such as those described by Zipparo et al.50
The long duration of each elementary spot also poses a challenge clinically. With 60–120s necessary for creating a lesion on the order of 0.1 cm3, even a relatively small tumor ablation (i.e., 65 cm3) could take upwards of 11 hours to ablate. The approach described herein could be implemented with a reduced ablation time by using better transducers for heating, such as the modified diagnostic transducers described in Zipparo et al.,50 while still maintaining good ARFI image quality. It remains to be determined whether ARFI imaging would portray the entire extent of a denatured lesion in vivo (in perfused tissues); only then could ARFI imaging used intermittently with HIFU potentially replace MRI monitoring of such treatments. Despite the previously mentioned potential clinical limitations, this system has a clear benefit as an assay for optimizing ARFI sequence design. By using varying numbers of elementary spots and the separation between their centers, lesions with different sizes and contrasts (e.g., Figure 3) can be created. Keeping in mind that the size of the lesion relative to the ARFI focal configuration along with underlying tissue stiffness impacts contrast, image quality from different ARFI image sequence designs can be assessed for a variety of conditions.
Conclusions
This work has shown that a diagnostic ultrasound system with a single array transducer and a specific ex vivo experimental setup can be used for interleaved, co-registered HIFU ablation with ARFI image monitoring in ex vivo liver. This demonstration was performed at the maximum acoustic output and duty cycle possible without damaging the transducer. Thus, to reduce the time necessary to ablate larger regions or to overcome attenuation at greater depths, a more robust, diagnostic transducer may be required. However, this system has a clear benefit not only in its immediate feedback with respect to the ablation region size, but also as an assay for optimizing ARFI monitoring sequences to detect HIFU lesions. Future work for this system includes optimizing the ARFI sequences and evaluation of the system in perfused liver. Hyperthermia treatments that require a lower temperature rise for longer durations may be a well-suited application for using a diagnostic transducer to perform thermal therapy.
Acknowledgments
This work was supported by NIH grants 2R01 EB-002132, as well as NSF Graduate Research Fellowship 2003014921 and NIH Medical Scientist Training Program grant T32 GM007171. The authors would also like to thank Siemens Medical Solutions USA, Inc. Ultrasound Division for their technical assistance.
References
- 1.Wu F, Wang ZB, Chen WZ, et al. Extracorporeal focused ultrasound surgery for treatment of human solid carcinomas: Early chinese clinical experience. Ultrasound Med Biol. 2004;30(2):245–260. doi: 10.1016/j.ultrasmedbio.2003.10.010. [DOI] [PubMed] [Google Scholar]
- 2.Wu F, Chen WZ, Bai J, et al. Tumor vessel destruction resulting from high-intensity focused ultrasound in patients with solid malignancies. Ultrasound Med Biol. 2002;28(4):535–542. doi: 10.1016/s0301-5629(01)00515-4. [DOI] [PubMed] [Google Scholar]
- 3.Kennedy J, Wu F, ter Haar G, et al. High-intensity focused ultrasound for the treatment of liver tumours. Ultrasonics. 2004;42:931–935. doi: 10.1016/j.ultras.2004.01.089. [DOI] [PubMed] [Google Scholar]
- 4.Hynynen K, Pomeroy O, Smith D, et al. MR imaging-guided focused ultrasound surgery of fibroadenomas in the breast: A feasibility study. Radiology. 2001;219:176–185. doi: 10.1148/radiology.219.1.r01ap02176. [DOI] [PubMed] [Google Scholar]
- 5.Stewart E, Gedroyc W, Tempany C, et al. Focused ultrasound treatment of uterine fibroid tumors: Safety and feasibility of a noninvasive thermoablative technique. Am J Obstet Gynecol. 2003;189(1):48–54. doi: 10.1067/mob.2003.345. [DOI] [PubMed] [Google Scholar]
- 6.Catane R, Beck A, Inbar Y, et al. MR-guided focused ultrasound surgery (MRg-FUS) for the palliation of pain in patients with bone metastases - preliminary clinical experience. Annals of Oncology. 2007;18:163–167. doi: 10.1093/annonc/mdl335. [DOI] [PubMed] [Google Scholar]
- 7.Gianfelice D, Khiat A, Amara M, Belblidia A, Boulanger Y. MR imaging-guided focused US ablation of breast cancer: Histopathologic assessment of effectiveness – initial experience. Radiology. 2003;227:849–855. doi: 10.1148/radiol.2281012163. [DOI] [PubMed] [Google Scholar]
- 8.Nyborg W. Solutions of the bio-heat transfer equation. Phys Med Biol. 1988;33(7):785–792. doi: 10.1088/0031-9155/33/7/002. [DOI] [PubMed] [Google Scholar]
- 9.Duck F. Physical Properties of Tissue. Harcourt Brace Jovanovich; San Diego: 1990. [Google Scholar]
- 10.National Cancer Institute, U.S. National Institutes of Health. Liver cancer. 2010 www.cancer.gov/cancertopics/types/liver.
- 11.American Cancer Society. Liver cancer. 2010 www.cancer.org/cancer/livercancer/detailedguide.
- 12.Illing R, Leslie T, Kennedy J, et al. Visually directed high- intensity focused ultrasound for organ-confined prostate cancer: a proposed standard for the conduct of therapy. BJU International. 2006;98:1187–1192. doi: 10.1111/j.1464-410X.2006.06509.x. [DOI] [PubMed] [Google Scholar]
- 13.Coussios C, Farny C, Ter Haar G, Roy R. Role of acoustic cavitation in the delivery and monitoring of cancer treatment of high-intensity focused ultrasound (HIFU) International Journal of Hyperthermia. 2007;23(2):105–120. doi: 10.1080/02656730701194131. [DOI] [PubMed] [Google Scholar]
- 14.Farny C, Holt R, Roy R. Temporal and spatial detection of HIFU-Induced inertial and Hot-Vapor cavitation with a diagnostic ultrasound system. Ultrasound Med Biol. 2009;35(4):603–615. doi: 10.1016/j.ultrasmedbio.2008.09.025. [DOI] [PubMed] [Google Scholar]
- 15.Curiel L, Chopra R, Hynynen K. In vivo monitoring of focused ultrasound surgery using local harmonic motion. Ultrasound Med Biol. 2009;35(1):65–78. doi: 10.1016/j.ultrasmedbio.2008.07.001. [DOI] [PMC free article] [PubMed] [Google Scholar]
- 16.Bercoff J, Pernot M, Tanter M, Fink M. Monitoring thermally-induced lesions with supersonic shear imaging. Ultrasonic Imaging. 2004;26(2):71–84. doi: 10.1177/016173460402600201. [DOI] [PubMed] [Google Scholar]
- 17.Lizzi F, Muratore R, Deng C, Ketterling J, Alam S, Mikaelian S, Kalisz A. Radiation- force technique to monitor lesions during ultrasonic therapy. Ultrasound Med Biol. 2003;29(11):1593–1605. doi: 10.1016/s0301-5629(03)01052-4. [DOI] [PubMed] [Google Scholar]
- 18.Hsu S, Fahey B, Dumont D, Wolf P, Trahey G. Challenges and implementation of radiation-force imaging with an intracardiac ultrasound transducer. IEEE Trans Ultrason Ferroelec Freq Contr. 2007;54(5):996–1009. doi: 10.1109/tuffc.2007.345. [DOI] [PMC free article] [PubMed] [Google Scholar]
- 19.Fahey B, Hsu S, Wolf P, Nelson R, Trahey G. Liver ablation guidance with acoustic radiation force impulse imaging: Challenges and opportunities. Phys Med Biol. 2006;51:3785–3808. doi: 10.1088/0031-9155/51/15/013. [DOI] [PMC free article] [PubMed] [Google Scholar]
- 20.Fatemi M, Greenleaf J. Ultrasond-stimulated vibro-acoustic spectrography. Science. 1998;280(5360):82–85. doi: 10.1126/science.280.5360.82. [DOI] [PubMed] [Google Scholar]
- 21.Konofagou E, Thierman J, Hynynen K. The use of ultrasound-stimulated acoustic emission in the monitoring of modulus changes with temperature. Ultrasonics. 2003;41:337–345. doi: 10.1016/s0041-624x(03)00125-2. [DOI] [PubMed] [Google Scholar]
- 22.Konofagou E, Hynynen K. Localized harmonic motion imaging: Theory, simulations and experiments. Ultrasound Med Biol. 2003;29(10):1405–1413. doi: 10.1016/s0301-5629(03)00953-0. [DOI] [PubMed] [Google Scholar]
- 23.Maleke C, Konofagou E. Harmonic motion imaging for focused ultrasound (HMIFU): a fully integrated technique for sonication and monitoring of thermal ablation in tissues. Phys Med Biol. 2008;53:1773–1793. doi: 10.1088/0031-9155/53/6/018. [DOI] [PubMed] [Google Scholar]
- 24.Wu T, Felmlee J, Greenleaf J, Riederer S, Ehman R. Assessment of thermal tissue ablation with MR elastography. Magnetic Resonance in Medicine. 2001;45:80–87. doi: 10.1002/1522-2594(200101)45:1<80::aid-mrm1012>3.0.co;2-y. [DOI] [PubMed] [Google Scholar]
- 25.Eyerly SA, Hsu SJ, Agashe SH, et al. An in vitro assessment of acoustic radiation force impulse imaging for visualizing cardiac radiofrequency ablation lesions. Journal of Cardiac Electrophysiology. 2010;21(5):557–563. doi: 10.1111/j.1540-8167.2009.01664.x. [DOI] [PMC free article] [PubMed] [Google Scholar]
- 26.Liu D, Ebbini E. Real-time 2-D temperature imaging using ultrasound. IEEE Trans Biomed Eng. 2010;57(1):12–16. doi: 10.1109/TBME.2009.2035103. [DOI] [PMC free article] [PubMed] [Google Scholar]
- 27.Miller N, Bamber J, ter Haar G. Imaging of temperature-induced echo strain: Preliminary in vitro study to assess feasibility for guided focused ultrasound surgery. Ultrasound Med Biol. 2004;30(3):345–356. doi: 10.1016/j.ultrasmedbio.2003.11.016. [DOI] [PubMed] [Google Scholar]
- 28.Souchon R, Bouchoux G, Maciejko E, et al. Monitoring the formation of thermal lesions with heat-induced echo-strain imaging: A feasibility study. Ultrasound Med Biol. 2005;31(2):251–259. doi: 10.1016/j.ultrasmedbio.2004.11.004. [DOI] [PubMed] [Google Scholar]
- 29.Righetti R, Kallel F, Stafford R, et al. Elastographic characterization of HIFU-induced lesions in canine livers. Ultrasound Med Biol. 1999;25(7):1099–1113. doi: 10.1016/s0301-5629(99)00044-7. [DOI] [PubMed] [Google Scholar]
- 30.Varghese T, Zagzebski J, Lee F., Jr Elastographic imaging of thermal lesions in the liver in vivo following radiofrequency ablation: Preliminary results. Ultrasound Med Biol. 2002;28(11/12):1467–1473. doi: 10.1016/s0301-5629(02)00656-7. [DOI] [PubMed] [Google Scholar]
- 31.Nightingale K, Palmeri M, Trahey G. Analysis of contrast in images generated with transient acoustic radiation force. Ultrasound Med Biol. 2006;32(1):61–72. doi: 10.1016/j.ultrasmedbio.2005.08.008. [DOI] [PubMed] [Google Scholar]
- 32.Nightingale K, Soo M, Nightingale R, Trahey G. Acoustic radiation force impulse imaging: In vivo demonstration of clinical feasibility. Ultrasound Med Biol. 2002;28(2):227–235. doi: 10.1016/s0301-5629(01)00499-9. [DOI] [PubMed] [Google Scholar]
- 33.Frinkley K, Palmeri M, Nightingale K. Controlled spatio-temporal heating patterns using a commercial, diagnostic ultrasound system. IEEE Ultrasonics Symposium. 2005;2:1130–1134. [Google Scholar]
- 34.Bailey M, Couret L, Sapozhnikov O, et al. Use of overpressure to assess the role of bubbles in focused ultrasound lesion shape In Vitro. Ultrasound Med Biol. 2001;27(5):695–708. doi: 10.1016/s0301-5629(01)00342-8. [DOI] [PubMed] [Google Scholar]
- 35.Melodelima D, Chapelon JY, Theillere Y, Cathignol D. Combination of thermal and cavitation effects to generate deep lesions with an endocavitary applicator using a plane transducer: Ex Vivo studies. Ultrasound Med Biol. 2004;30(1):103–111. doi: 10.1016/j.ultrasmedbio.2003.09.005. [DOI] [PubMed] [Google Scholar]
- 36.Vaezy S, Shi X, Martin R, Chi E, Nelson P, Bailey M, Crum L. Real-time visualization of high-intensity focused ultrasound treatment using ultrasound imaging. Ultrasound Med Biol. 2001;27(1):33–42. doi: 10.1016/s0301-5629(00)00279-9. [DOI] [PubMed] [Google Scholar]
- 37.Cheng SQ, Zhou XD, Tang ZY, Yu Y, Wang HZ, Bao SS, Qian DC. High-intensity focused ultrasound in the treatment of experimental liver tumour. J Cancer Res Clin Oncol. 1997;123:219–223. doi: 10.1007/BF01240318. [DOI] [PubMed] [Google Scholar]
- 38.Sokka S, King R, Hynynen K. MRI-guided gas bubble enhanced ultrasound heating in In Vivo rabbit thigh. Phys Med Biol. 2003;48:223–241. doi: 10.1088/0031-9155/48/2/306. [DOI] [PubMed] [Google Scholar]
- 39.Khokhlova V, Bailey M, Reed J, Cunitz B, Kaczkowski P, Crum L. Effects of nonlinear propagation, cavitation, and boiling in lesion formation by high intensity focused ultrasound in a gel phantom. J Acoust Soc Am. 2006;119(3):1834–1848. doi: 10.1121/1.2161440. [DOI] [PubMed] [Google Scholar]
- 40.Pinton G, Dahl J, Trahey G. Rapid tracking of small displacements with ultrasound. IEEE Trans Ultrason Ferroelec Freq Contr. 2006;53(6):1103–1117. doi: 10.1109/tuffc.2006.1642509. [DOI] [PubMed] [Google Scholar]
- 41.Sonka M, Hlavac V, Boyle R. Image Processing, Analysis, and Machine Vision. 2. CL-Engineering; Lubbock, TX: 1998. [Google Scholar]
- 42.Chen L, ter Haar G, Hill C, et al. Effect of blood perfusion on the ablation of liver parenchyma with high-intensity focused ultrasound. Phys Med Biol. 1993;38:1661–1673. doi: 10.1088/0031-9155/38/11/011. [DOI] [PubMed] [Google Scholar]
- 43.Shaw A, Pay N, Preston R, Bond A. Proposed standard thermal test object for medical ultrasound. Ultrasound Med Biol. 1999;25(1):121–132. doi: 10.1016/s0301-5629(98)00136-7. [DOI] [PubMed] [Google Scholar]
- 44.Clarke R, Ter Haar G. Temperature rise recorded during lesion formation by high-intensity focused ultrasound. Ultrasound Med Biol. 1997;23(2):299–306. doi: 10.1016/s0301-5629(96)00198-6. [DOI] [PubMed] [Google Scholar]
- 45.Morris H, Rivens I, Shaw A, ter Haar G. Investigation of the viscous heating artefact arising from the use of thermocouples in a focused ultrasound field. Phys Med Biol. 2008;53:4759–4776. doi: 10.1088/0031-9155/53/17/020. [DOI] [PubMed] [Google Scholar]
- 46.Holt R, Roy R. Measurements of bubble-enhanced heating from focused, MHz-frequency ultrasound in a tissue-mimicking material. Ultrasound Med Biol. 2001;27(10):1399–1412. doi: 10.1016/s0301-5629(01)00438-0. [DOI] [PubMed] [Google Scholar]
- 47.National Council on Radiation Protection and Measurements. Criteria Based on Thermal Mechanisms. Bethesda, MD: 1992. Exposure Criteria for Medical Diagnostic Ultrasound: I. [Google Scholar]
- 48.Palmeri M, McAleavey S, Trahey G, Nightingale K. Ultrasonic tracking of acoustic radiation force-induced displacements in homogeneous media. IEEE Trans Ultrason Ferroelec Freq Contr. 2006;53(7):1300–1313. doi: 10.1109/tuffc.2006.1665078. [DOI] [PMC free article] [PubMed] [Google Scholar]
- 49.Frinkley K, Rosenzweig S, Nightingale K. Therapeutic potential metric for diagnostic transducers. IEEE Ultrasonics Symposium; 2007. [Google Scholar]
- 50.Zipparo M, Bing K, Nightingale K. Imaging arrays with improved transmit power capability. IEEE Trans Ultrason Ferroelec Freq Contr. 2010;57(9):2076–2090. doi: 10.1109/TUFFC.2010.1655. [DOI] [PMC free article] [PubMed] [Google Scholar]