Abstract
Inhibition usually decreases input–output excitability of neurons. If, however, inhibition is coupled to excitation in a push–pull fashion, where inhibition decreases as excitation increases, neuron excitability can be increased. Although the presence of push–pull organization has been demonstrated in single cells, its functional impact on neural processing depends on its effect on the system level. We studied push–pull in the motor output stage of the feline spinal cord, a system that allows independent control of inhibitory and excitatory components. Push–pull organization was clearly present in ankle extensor motoneurons, producing increased peak-to-peak modulation of synaptic currents. The effect at the system level was equally strong. Independent control of the inhibitory component showed that the stronger the background of inhibition, the greater the peak force production. This illustrates the paradox at the heart of push–pull organization: increased force output can be achieved by increasing background inhibition to provide greater disinhibition.
Introduction
The interaction between excitation and inhibition is a fundamental component of neural processing throughout the CNS. Typically, addition of inhibition to excitation results in decreased neuronal excitability, as expected from its hyperpolarizing and shunting effects (Coombs et al., 1955). Yet the presence of a mixed background of excitation and inhibition has also been shown to increase neuronal sensitivity to weak inputs as well as improve information processing (Destexhe et al., 2003; Abbott and Chance, 2005). A substantial increase in net input–output gain can occur when changes in inputs alter the mixed background in a push–pull fashion. Push–pull produces depolarization by coupling an increase in excitatory input to a decrease in inhibitory input (disinhibition) and hyperpolarization by the complementary pattern of increased inhibition and decreased excitation (disfacilitation). The increase in gain occurs because the inverse changes in excitation and inhibition reinforce each other to produce a larger total change (Heggelund, 1981; Ferster, 1988; Conway and Livingstone, 2006). Nonetheless, this organization of synaptic inputs has a paradoxical aspect to it: increasing background inhibition allows for greater disinhibition and provides an increase in gain, and thus in excitability.
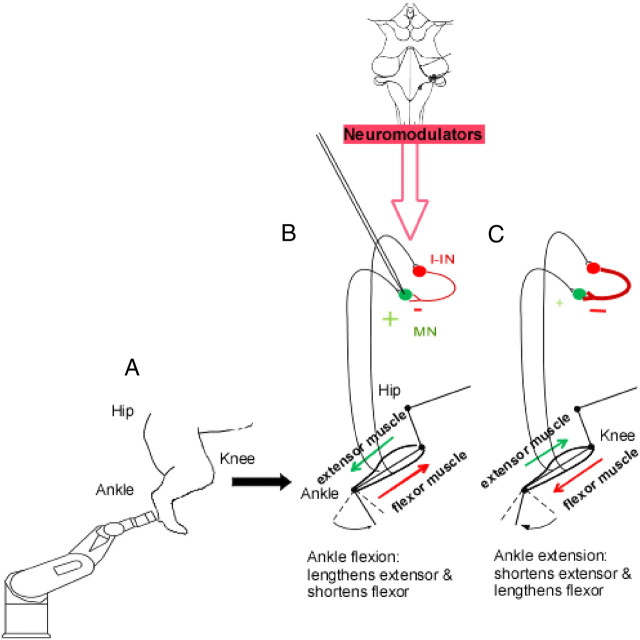
Previous studies of push–pull relied on indirect estimates of synaptic input based on measurements of a neuron's electrical conductance. In fact, push–pull typically occurs with a substantial increase in neuron conductance due to the inhibitory components (Steriade, 2001; Destexhe et al., 2003). Here, we use a well defined neuromechanical system that allows independent control of both excitatory and inhibitory inputs and the ability to identify the relationship between push–pull organization at the single-cell and system levels. This system, the spinal motoneurons that innervate ankle extensor muscles, has strong potential for push–pull behavior. The key sensory inputs shared between muscle groups acting at the ankle are organized reciprocally. Excitation is shared among agonists and inhibition is exchanged between antagonists (Eccles and Lundberg, 1958; Nichols et al., 1999). These inputs largely arise from the length-sensitive muscle spindle Ia afferents (Matthews, 1964), generating excitation in agonist motoneurons via a potent monosynaptic pathway and inhibition in antagonists via an equally strong disynaptic pathway (Eccles et al., 1956; Jankowska et al., 1965), as illustrated in Figure 1. Our first goal was to test the hypothesis that these sensory inputs are tonically active and thus capable of providing the substrate for push–pull. Our second goal was to determine whether this push–pull organization was accompanied by large conductance changes, as it is in cortical cells (Destexhe et al., 2003).
Figure 1.
A, A robotic arm attached to the cat's foot flexed and extended the ankle joint. B, With the system intact, as shown here, ankle flexion stretches extensor muscles and provides monosynaptic excitation that depolarizes the extensor MN; at the same time, the flexor muscles are shortening, decreasing the amount of inhibition from inhibitory interneurons (I-IN). C, During extension, the opposite occurs: inhibition to the MN increases while excitation decreases.
Our final goal was to compare cell and system behavior when the inhibitory component of this reciprocally coupled input is eliminated. Our hypothesis was that push–pull organization effectively propagates through the pool of motoneurons to emerge at the system level as increased force modulation in response to ankle rotation. In addition, we hypothesized that increasing this background inhibition would increase force modulation.
Materials and Methods
Ethical approval.
All procedures were approved by the Institutional Animal Use and Care Committee of Northwestern University. All animals were obtained from a designated breeding establishment for scientific research. Before the experiments, animals were housed and fed within designated areas, which are monitored daily by veterinarians and trained personnel. Data were compiled from 14 adult cats of either sex weighing between 2 and 5 kg.
Surgical preparation.
Surgical procedures for all experiments were completed under deep anesthesia (1.5–3% isofluorane in a 1:3 mixture of O2 and NO2 administered through a ventilator). Anesthetic level was adjusted in response to continuous monitoring of blood pressure and heart rate as well as responses to paw pinch. For all experiments, the right carotid artery and jugular vein were cannulated to monitor blood pressure and deliver intravenous fluids and drugs, respectively. For the robotic arm experiments, the hindlimb skin was kept as intact as possible. Through a small incision, nerves to the medial and lateral gastrocnemius muscles (MG and LGS, respectively; 4 animals) were identified and cuff electrodes were applied for antidromic stimulation of motoneurons. A vertebral laminectomy was done from L3 to L7 to expose the spinal cord and the cord was bathed in mineral oil. A precollicular decerebration was performed, anesthesia discontinued, and paralysis induced with gallamine triethiodide (Sigma-Aldrich) at which time the animal was ventilated and it's paw was attached to a six degrees of freedom robotic arm (Staubli; AG Robotics; Fig. 1). The robot was adjusted so that the hindlimb was positioned into a start position: the ankle at 90° relative to the tibia, the knee at 130°, and the hip at 105°. For most experiments, a bilateral pneumothorax was performed to promote stable recordings by lessening movement of the chest wall. In the voltage-clamp experiments, using the dual linear motors instead of the robotic arm, a more extensive hindlimb surgery was performed. After rigidly clamping the hip and knee, the ankle extensor muscles MG and LGS were isolated and the distal portion of their common tendon was cut and attached to one of the motors. The ankle flexor muscles tibialis anterior (TA) and extensor digitorum longus (EDL) were similarly isolated and attached to the other motor. For the experiments measuring reflex forces (5 nonparalyzed decerebrate animals), the soleus muscle was isolated and a force transducer was interposed between it and the linear motor. At the end of each experiment, the animal was killed by injection of potassium citrate followed by bilateral pneumothorax.
Intracellular recordings.
Intracellular recordings of lumbar spinal motoneurons were performed using sharp electrodes (3–5 ΜΩs) filled with 2 m potassium citrate. Single electrode discontinuous voltage clamp (switching frequency, 8–10 kHz) was applied using an Axoclamp 2A amplifier (Molecular Devices). Data with inadequate settling of electrode transients were rejected. To enhance the low-frequency gain in the negative feedback loop, an external gain circuit was used that allowed for gains of 100–300 nA/mV (for details, see Lee and Heckman, 2000).
Experimental protocols.
For the voltage-clamp experiments, MG and LGS motoneurons were identified by antidromic stimulation of peripheral nerves. For all experiments investigating the effects of push–pull coupling on neuron gain at the single-cell level, membrane potential was held constant at rest, slightly depolarized to the reversal potential for IPSPs. For experiments investigating the effects of persistent inward current (PIC) activation on push–pull inputs, the onset of the PIC was determined by a slow voltage ramp (6–8 mV/s), as in our previous studies (Lee and Heckman, 1996, 1998; Hyngstrom et al., 2008b). PIC onset voltage was identified at the point of zero slope in the resulting current–voltage relationship. The cell was then depolarized to PIC onset and the push–pull input applied. Input resistance (Rin) was measured from the inverse of the slope of the subthreshold region of the current–voltage relation.
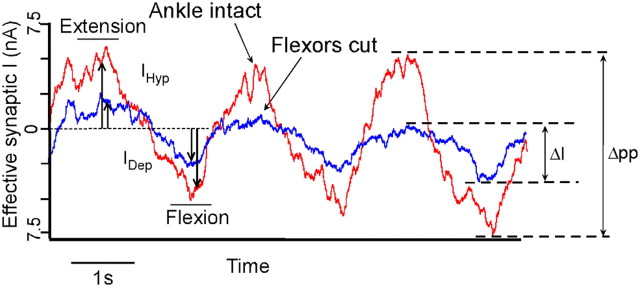
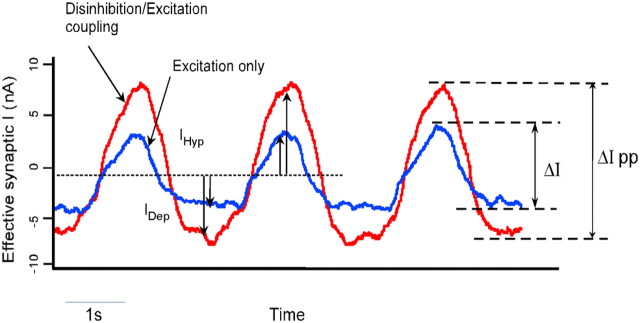
For the first set of experiments, the robotic arm passively flexed and extended the ankle (±15°) eight times at 1 Hz with the ankle musculature completely intact while an MG or LGS motor neuron (MN) was voltage clamped. In previous experiments using the robotic arm, movements at joints not involved in the primary rotation were found to vary from 0° to 2° from the starting position. This was done under two conditions: (1) with the synaptic inputs to the extensor MN′s fully intact and the conductances interacting in a push–pull manner and (2) with the inputs from the flexor muscles eliminated (non-push–pull) by surgically cutting the distal portion of the tendons of the flexors TA and EDL and securing them at the fixed starting length. Total effective synaptic current (IN) was composed of depolarizing (IDep) and hyperpolarizing (IHyp) components. IDep and IHyp amplitudes were calculated from the baseline voltage current level before the onset of the ankle movements. IHyp was calculated as the peak current value relative to the baseline current and IDep as the absolute value of the trough value relative to baseline (see Fig. 3). From our starting position, the robot rotated the ankle joint through flexion and extension and the resulting IDeps and IHyps at the extensor MN′s were recorded. The ankle rotations were repeated in recordings from MN′s after the flexor tendons were cut. IN modulation for an extensor MN under push–pull control and for a MN under non-push–pull is shown in Fig. 3. Differences in the IDep and IHyp for the push–pull and non-push–pull conditions were calculated and averaged.
Figure 3.
Typical voltage-clamp recording of an ankle extensor motoneuron in the robotic arm experiments. Blue trace is the effective synaptic current measured at the MN soma as the ankle is extended and flexed in the non-push–pull condition (tendon to antagonist muscles cut). In the red trace, the system is left intact with the synaptic inputs acting on the MN in a push–pull fashion. The total peak-to-peak current as well as the IDep and IHyp components were facilitated during passive ankle rotations in the push–pull (pp) configuration.
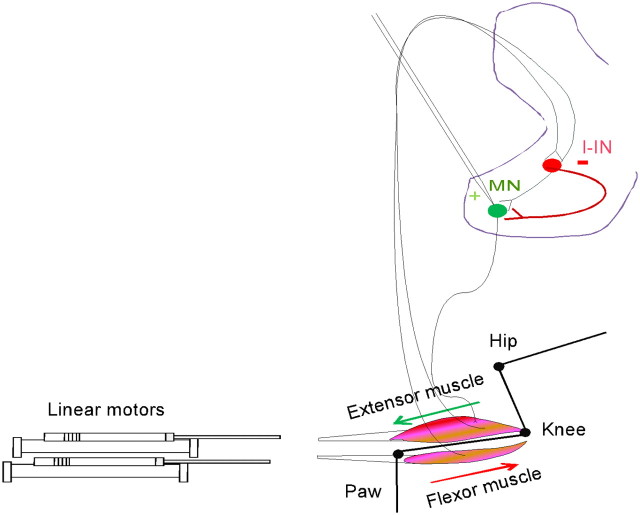
In the second set of experiments, we used linear motors to independently control the lengths of the flexor and extensor muscles. Both sets of muscles were surgically isolated and attached to the motors at lengths corresponding to an ankle angle of 90° (see Fig. 4). After an extensor MN was under voltage clamp, the ankle extensor muscles were stretched and shortened ±5 mm, providing excitation and disfacilitation to the MN. This was immediately followed by alternately stretching and shortening the extensors and flexors (TA/EDL) to provide the coupled (excitation/disinhibition and inhibition/disfacilitation) inputs to the MN. These stretches were repeated for eight cycles at 1 Hz for each condition. IDep and IHyp measurements were the same as for the passive ankle rotation experiments described above (see Fig. 4).
Figure 4.
Illustration of the computer-controlled linear motor set up to test the push–pull hypothesis within cells. The distal tendons to ankle extensor and flexor muscles were attached to the linear motors, which independently controlled muscle lengths while measuring effective synaptic currents in ankle extensor motoneurons. I-IN, Inhibition from inhibitory interneurons.
An important distinction between the robotic arm experiments and experiments using the linear motors is that the former allowed us to study push–pull effects in a largely intact biomechanical system but restricted our analysis to between-cell comparisons and the latter allowed us to make within-cell comparisons between the effects of a push–pull configuration and a non-push–pull configuration.
In the experiments measuring extensor reflex force, the same stretch and shortening protocols were used, either stretching and shortening an ankle extensor alone or by simultaneously stretching and shortening the ankle flexors out of phase with the extensor. The initial muscle lengths were set in three different ways: (1) muscle lengths were set in accordance with an ankle angle of 90°; (2) the flexor muscles (TA/EDL) were started 2.5 mm longer than that corresponding to a 90° ankle angle, providing a larger amount of initial background inhibition: our enhanced inhibition condition; or (3) the flexor muscles were started 2.5 mm shorter than that corresponding to a 90° ankle angle, thus providing a lesser amount of initial background inhibition: our reduced inhibition condition. For all of the reflex experiments, the stretches were performed at 1 Hz and each trial consisted of four cycles. The stretch protocols were repeated four times. Reflex forces were measured with a 25N load cell in series with the linear motor attached to the extensor (soleus) muscle. At the end of each experiment, stretch protocols were repeated after hindlimb denervation to record passive muscle properties, which were then subtracted from the force measurements.
Statistics.
Data were processed and analyzed using Signal (Cambridge Electronic Design), Igor (WaveMetrics), and Excel (Microsoft) software. For statistics, two-tailed nonequal variance Student's t tests were used to evaluate significant differences.
Results
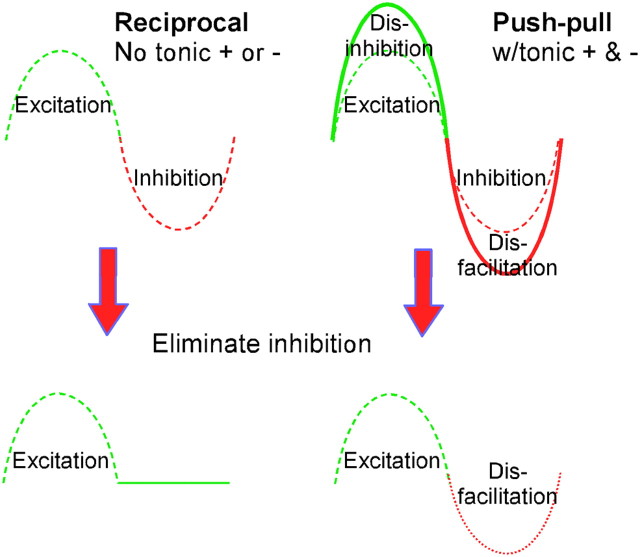
Our first set of experiments was designed to test the hypothesis that Ia excitatory and Ia inhibitory systems are tonically active and thus behave in a push–pull manner. Figure 2 illustrates possible outcomes. If the synaptic currents generated by ankle flexion–extension are organized in a reciprocal fashion without a tonic baseline, elimination of the inhibitory component would simply leave the excitatory component (Fig. 2, left). If, however, this reciprocal organization is superimposed on a tonic base of excitation and inhibition, then elimination of inhibition will reduce the depolarizing current due to loss of disinhibition (Fig. 2, bottom right). A reduced hyperpolarizing current will remain as well: inhibition from stretching the flexor is lost but disfacilitation of the tonic activity in extensor Ia afferents remains. Two types of experiments were performed to detect push–pull organization by eliminating the inhibitory component at the single-cell level.
Figure 2.
When tonic levels of excitation and inhibition, the substrate for push–pull control, are present, maximum depolarization (and maximum firing frequencies) is achieved when disinhibition is coupled with excitation. Similarly, maximum hyperpolarization is achieved by the coupling of disfacilitation with inhibition. In our experiments, this was tested by having either an intact Ia reciprocal inhibition system or by disrupting reciprocal inhibition by cutting the tendons to antagonist muscles.
In the first type, the ankle joint was left as intact as possible. During voltage clamp of each extensor motoneuron, the ankle joint was precisely rotated first into extension and then into flexion by a robotic arm (Fig. 1A). Then, inhibition was eliminated by cutting the tendons of the flexors and allowing them to remain at a constant short length during the ankle rotation. The intact and cut tendon procedures were done in separate experiments, because cutting the tendons during intracellular recording is not feasible due to brief surges in blood pressure that destabilize the cell penetration. The result conformed to the prediction based on push–pull: the amplitudes of the synaptic currents generated in each phase were reduced, but a hyperpolarizing component remained (Fig. 3). Of the 16 ankle extensor MNs in these experiments, the eight cells (average Rin = 0.7 MΩ) in the push–pull condition on average showed significantly larger synaptic currents than the eight cells (avergage Rin = 0.9 MΩ) in the non-push–pull condition (ΔI = peak-to-peak current; Fig. 3; ΔI push–pull 10.53 nA, ΔI non-push–pull 5.26 nA; p = 0.04). The individual depolarizing and hyperpolarizing components were also larger in the push–pull conditions (ΔIDep = depolarizing component; ΔIHyp = hyperpolarizing; push–pull ΔIDep = 5.5 nA, non-push–pull ΔIDep = 2.98 nA; p = 0.08, push–pull ΔIHyp = 4.9 nA, non-push–pull ΔIHyp = 2.19 nA; p = 0.03).
In the second type of experiment, the ankle extensor and flexor muscles were surgically isolated and their tendons independently attached to separate computer-controlled muscle pullers (servo-controlled for precise changes in length; Fig. 4). This procedure allowed us to compare push–pull to non-push–pull within single cells, by comparing synaptic currents when all muscles were set at initial lengths (push–pull condition) to currents generated when the flexors were held steadily at their 90° position while the length change was applied solely to the extensors (non-push–pull). The result again strongly supported the existence of a baseline of both tonic excitation and inhibition and thus of a push–pull organization: the amplitudes of each phase were reduced, but a hyperpolarizing component remained (for an individual example, see Fig. 5; for group data, see Table 1). Amplitudes of total current and of the hyperpolarizing and depolarizing components were reduced by approximately one-third and all differences were significant (t tests, p < 0.01 in all cases). These results strongly support the hypothesis that ankle extensor motoneurons receive a baseline of balanced excitation and inhibition from sensory input and that this input is organized in a push–pull fashion.
Figure 5.
Typical voltage-clamp recording of an ankle extensor motoneuron in the within-cell dual linear motor experiments. The red trace shows the effective synaptic current measured at the soma during stretch of ankle flexor and extensor muscles in the push–pull (pp) arrangement. In the blue trace, only the extensor muscles are stretched and shortened while the flexors are held at a fixed length (non-push–pull). Note the dramatic reduction synaptic current in the non-push–pull condition (blue trace).
Table 1.
Dual linear motor experiments data summary: mean effective synaptic peak-to-peak, inward, and outward currents of ankle extensor MNs in the push–pull and non-push–pull condition
| Peak-to-peak I (nA) (n = 8) | Depol I (nA) (n = 8) | Hyperpol I (nA) (n = 8) | |
|---|---|---|---|
| Push–pull | |||
| CP1_1 | 7.3 | 4.7 | 2.6 |
| CP1_2 | 7.1 | 4.4 | 2.7 |
| CP1_3 | 12.1 | 7.2 | 4.9 |
| CP1_4 | 12.9 | 7.5 | 5.4 |
| CP1_5 | 14 | 7.4 | 6.7 |
| CP2_1 | 13.2 | 7.5 | 5.7 |
| CP2_2 | 7.1 | 4.8 | 2.3 |
| CP2_3 | 9.5 | 4.4 | 5.1 |
| CP2_4 | 5.9 | 4.2 | 3.7 |
| Average | 9.9 | 5.56 | 4.34 |
| Non-push–pull | |||
| CP1_1 | 4.9 | 3.5 | 1.4 |
| CP1_2 | 5.2 | 3 | 2.2 |
| CP1_3 | 10.9 | 6.7 | 4.3 |
| CP1_4 | 9.6 | 5.8 | 3.8 |
| CP1_5 | 12.2 | 6.8 | 5.4 |
| CP2_1 | 4.7 | 2.2 | 2.4 |
| CP2_2 | 2.3 | 1.2 | 1.1 |
| CP2_3 | 5.9 | 2.7 | 3.2 |
| CP2_4 | 3.9 | 1.4 | 2.5 |
| Average | 6.62 | 3.68 | 2.92 |
| %Δ | 33.11 (±20.1) | 33.73 (±25.5) | 32.74 (±15.8) |
| t test | 0.002 | 0.007 | 0.0008 |
As a result, the gain of the motoneuron to this sensory input is markedly increased. These results also support the fundamental role of Ia reciprocal from the antagonists, as the only other muscles undergoing length changes were the direct antagonists (TA/EDL) of the muscle innervated by the motoneurons studied. No changes in length of other pretibial flexors, such as the peroneal group or extensor digitorm brevis, occurred. Moreover, there were no changes in cutaneous or joint afferents. This result is consistent with our previous work showing that ankle rotation effects on motoneurons are dominated by the agonist and antagonist Ia afferents, with little effect from cutaneous afferents or other muscle afferents (group II, III, IV) (Hyngstrom et al., 2008a).
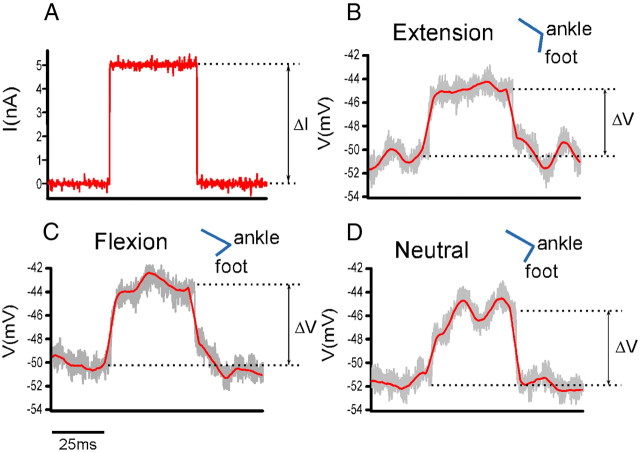
Studies of synaptic arrangements in other neural systems have used changes in cell conductance as a measure of the relative contribution of excitation and inhibition (Bernander et al., 1991; Archie and Mel, 2000; Chance et al., 2002; Destexhe et al., 2003; Monier et al., 2008). This approach requires linear current–voltage relations, but this condition is not usually present in the motoneurons in our preparation. In the subthreshold range, the steady serotonin (5HT) and norepinephrine (NE) input induces strong H currents and, as threshold is approached, the PICs facilitated by 5HT and NE begin to activate (Powers and Binder, 2001). Nonetheless, inhibitory inputs in many systems are associated with large changes in cell conductance. Therefore, average total conductance (G) was calculated as the robotic arm was used to rotate the ankle. This was done during current clamp, with short (40 ms) 5 nA current pulses delivered throughout the rotation (Fig. 6). The values during peak flexion, neutral position, and peak extension were averaged across several cycles in five cells. Overall cell conductance increased during extension (9.84%), consistent with the activation of inhibition during the resulting stretch of flexors, and decreased during flexion (3.49%), consistent with a decrease in inhibition, compared with neutral position (average resting G in neutral position = 0.64 μS, SD = 0.14; extension = 0.7 μS, SD = 0.19; flexion = 0.61 μS, SD = 0.18). These changes are modest compared with other systems and show that motoneurons are not in a high-conductance state for their push–pull organization. The magnitude of these conductance changes are, however, consistent with previous measures of the effect of reciprocal inhibition in extensor motoneurons (Stuart and Redman, 1990; Heckman and Binder, 1991; Hyngstrom et al., 2008b) as well as with our previous study of the conductance changes due to ankle rotations (Hyngstrom et al., 2007).
Figure 6.
Conductance measurements. A–D, Small (5 nA) current pulses (A) were passed via intracellular electrode through the homonymous MN soma during ankle rotations at peak extension (B) and peak flexion (C), and while the ankle was held in the neutral position (D). Conductance at each time point was calculated as G = I/ΔV. Overall conductance change during extension (B) was larger than conductance change during flexion (C).
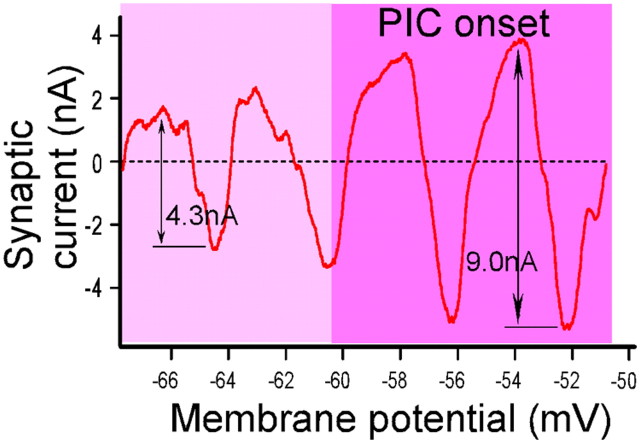
The PICs facilitated by 5HT and NE strongly amplify excitatory and inhibitory synaptic input (Lee and Heckman, 1996, 2000; Bennett et al., 1998; Hultborn, 2001; Hultborn et al., 2003). The experiments described thus far were all done with the motoneuron at its resting level, well below the voltage threshold at which PICs exert this amplifying effect. To determine how push–pull control interacts with the amplification provided by PICs, we compared the push–pull currents at these hyperpolarized holding potentials to those obtained at depolarized holding potentials just at threshold for strong PIC activation (defined as the onset of the negative slope region induced by the PIC in the current–voltage relation). At this depolarized level, the excitatory component of the push–pull synaptic input should undergo amplification via PIC activation and inhibitory input should undergo amplification by PIC deactivation.
The peak-to-peak currents from stretch/shortening of flexors and extensors were amplified ∼2.2-fold at depolarized (depol) and hyperpolarized (hyperpol) levels (average outward current in depol condition: 3.9 nA, in hyperpol condition: 1.7 nA; average inward current in depol condition: 5.8 nA, in hyperpol condition: 2.4 nA; for an example, see Fig. 7). Although only one level of depolarization was examined, the 2.2-fold amplification is within the twofold to threefold range expected from maximal PIC amplification for both pure excitatory and pure inhibitory inputs in previous studies in this same preparation (Lee and Heckman, 2000; Hyngstrom et al., 2007, 2008b). This result suggests that the gains of neuromodulation and push–pull interact approximately linearly. Overall, the total increase in gain from push–pull and PIC amplification is approximately threefold (1.3 for push–pull, 2.2 for PICs).
Figure 7.
Example of a slow depolarizing voltage ramp applied to a voltage-clamped ankle extensor motoneuron subject to push–pull synaptic inputs (leak subtracted). Note the amplification due to activation of the PIC.
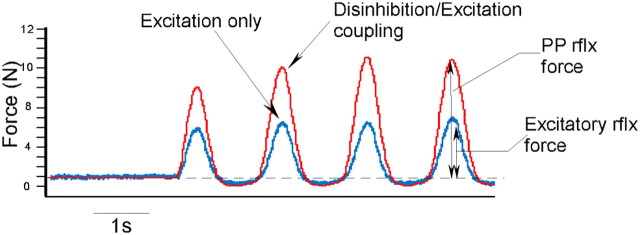
In our final series of experiments, we turned our attention to the question of whether the push–pull organization at the single-cell level would produce strong effects at the whole-system level. Each motoneuron innervates its own set of muscle fibers in a specific muscle to form a motor unit, the quantal element of motor control. Muscle force is generated by both population and rate coding of motor units. Population coding occurs via recruitment of progressively larger, faster, and more fatigable motor units, a sequence known as Henneman's size principle (Henneman and Mendell, 1981). Each recruited motoneuron then undergoes rate modulation. The forces produced by recruitment and rate modulation of motor units sum approximately linearly to produce whole-muscle force (Sandercock and Maas, 2009). To test whether the clear increase in gain due to push–pull at the single-motoneuron level was also present in this complex population output, we measured force modulation from extensor muscles using the linear muscle puller arrangement illustrated in Figure 4 with the addition of a force transducer to which the ankle extensor muscles were attached (unlike the above intracellular studies, where achieving mechanical stability for voltage clamp in vivo is challenging, these studies of force were performed in nonparalyzed preparations). As shown in Figure 8, the push–pull condition (where extensors and flexors were stretched reciprocally) consistently resulted in higher peak force production than the non-push–pull condition (as for the within-cell intracellular study, in this condition only the extensors underwent length changes; the flexors were held steady at their 90° lengths; 13.9N vs 9.38N; Table 2). The amount of this increase (∼24%) is similar to that obtained on average in single cells (∼33%). Thus, push–pull was effectively translated to the system level.
Figure 8.
Representative example of reflex (rflx) force measures during dual linear motor experiments. The red trace shows reflex force generated in ankle extensor muscles when the agonist and antagonist muscles are stretched and shortened in a push—pull (PP) manner. When the antagonist muscle is held at a constant length and extensor muscles are stretched and shortened alone, resulting reflex forces arise from excitation alone. Note the drastically reduced force in this push–pull disrupted arrangement (blue trace).
Table 2.
Reflex force experiments data summary
| Peak F ankle |
|||
|---|---|---|---|
| 90° (N) (n = 24) | >90° (N) (n = 24) | <90° (N) (n = 24) | |
| Push–pull | |||
| RC_1 | 11.8 | 9.4 | 10 |
| RC_2 | 8.7 | 8.3 | 6.7 |
| RC_3 | 24.7 | 24.8 | 17.3 |
| RC_4 | 10.1 | 12.4 | 9.9 |
| RC_5 | 14.2 | 14.8 | 14.1 |
| Average | 13.9 | 13.9 | 11.6 |
| Non-push–pull | |||
| RC_1 | 9.5 | 7.3 | 9.1 |
| RC_2 | 6.1 | 4.4 | 5.6 |
| RC_3 | 19.8 | 16.5 | 15.5 |
| RC_4 | 8.5 | 7.5 | 8.6 |
| RC_5 | 12.2 | 11.2 | 12.5 |
| Average | 11.2 | 9.38 | 10.3 |
| %Δ | 24.11 (±10.4) | 48.19 (±22.2) | 12.6 (±3.8) |
| t test | 0.04 | 0.0007 | 0.13 |
When antagonist muscles are held at a position equivalent to an ankle angle of 90°, the force gain increase afforded by stretching and shortening the muscles in a push–pull configuration is about 24% (first column). If the antagonist muscles are initially held a length corresponding to an ankle angle greater than 90° (5 mm longer), push–pull coupling provides a gain of 48%. If the experiment is started with antagonist muscles shorter than they would be at an ankle angle of 90°, the push–pull gain increase is only 12% (last column). RC_1, Reflex cat 1; RC_2, reflex cat 2; etc.
The effects of push–pull force modulation were also dependent on the initial position of the flexors. As the flexor muscles were held at a length longer than that corresponding to an ankle angle of 90° before the onset of a trial to reciprocal stretching, presumably increasing the background of inhibition in the extensors, the increase in gain afforded by the push–pull arrangement was even greater (Table 2). If the flexors were held at a length shorter than an ankle angle of 90°, the push–pull gain effect was less (Table 2). This remarkable result illustrates the basic paradox at the heart of push–pull organization: to increase force modulation, add background inhibition to increase disinhibition.
Discussion
Our results show that the passive sensory input generated by ankle rotations is organized in a push–pull fashion, due to reciprocal changes generated from a steady background of excitation and inhibition. The independent control of excitatory and inhibitory components in this model system allowed us to demonstrate that push–pull gain enhancement propagates through the population of ankle extensor motoneurons and emerges at the system level, such that force modulation (F) generated by ankle rotation was markedly increased. Previous studies have shown that the net input–output gain of motoneurons can be enhanced by increasing the slope of the F/I relationship and amplifying synaptic inputs via PIC-mediated dendritic amplification (Lee and Heckman, 1996; Bennett et al., 1998; Hultborn et al., 2003). Push–pull control affords the CNS another mechanism for modulating motoneuron gain, by reciprocal modulation of two opposing input systems. The extent of the increase in force modulation could be controlled by altering the level of background inhibition, achieved by adjusting the initial length of the antagonist muscles. The effective emergence of push–pull at the system level indicates that excitation and inhibition are precisely balanced across all members of the motoneuron pool, in that the excitation offsets inhibition sufficiently to avoid hyperpolarization pushing motoneurons below their recruitment thresholds. This result strongly suggests that the relative strengths of Ia excitation and Ia inhibition are remarkably well matched and that this fundamental sensory input is inherently designed to operate in a push–pull mode.
Balanced excitatory and inhibitory input to cortical neurons induces a high conductance, noisy state (Steriade, 2001; Destexhe et al., 2003). Although the Ia excitation and inhibition appear to be balanced in terms of amplitude, the push–pull organization in motoneurons in this study was not accompanied by large changes in input conductance (average ∼15%). Higher changes in conductance may occur in dendritic regions, although it must be kept in mind that much of the Ia reciprocal inhibition is proximal (Burke et al., 1971). Perhaps the very high resting input conductance of motoneurons compared with other cell types, which is due to their unusually large size (Powers and Binder, 2001), places them in a unique operating mode.
Several lines of previous research provide support for the results reported here. An important previous study showed that reciprocal coupling of antagonists increases ankle joint stiffness (Nichols and Koffler-Smulevitz, 1991) and obtained the basic result demonstrated here in Figure 8, i.e., that reciprocal changes in length of soleus versus TA/EDL increases the force generated by stretch of soleus. Additionally, Ia inhibitory interneurons are spontaneously active in this preparation, likely providing the background of tonic inhibition necessary for push–pull (Wilson and Burgess, 1962; Hultborn et al., 1971a,b). Furthermore, reciprocal inhibition via antagonist muscle stretch has been shown to not only provide inhibition to antagonist muscles, but also disinhibition to the homonymous muscle (Hultborn et al., 1976; Fu et al., 1978). The potential role of disinhibition in muscle force production has been previously suggested to be functionally important (Houk and Henneman, 1974). Renshaw cells have reciprocal connections with Ia inhibitory interneurons (Wilson and Burgess, 1962) and may play a role in push–pull organization, but this potential contribution is difficult to assess experimentally.
Our results also showed that the gain increase due to push–pull can be further enhanced by the amplification due to PICs. Furthermore, the push–pull control appeared to minimize a potential problem with PIC amplification of time-varying inputs, namely the PIC's strong tendency to prolong inputs. In fact, PIC activation by brief inputs can induce sustained plateau potentials, especially in low-threshold motoneurons (Hounsgaard et al., 1988; Lee and Heckman, 1998). The inhibitory component probably prevented PIC prolongation of input, with the redevelopment of inhibition as depolarization fades likely deactivating the PIC. Thus, the pattern of synaptic currents continued to closely track the changes in ankle angle as the cell was depolarized to engage the PIC (Fig. 7). Thus, push–pull input may allow the PIC to amplify inputs while still allowing accurate following of their temporal dynamics. A further limitation of PIC amplification is that it evokes input saturation, with the cell becoming much less responsive to additional excitatory input once the PIC is fully activated (Lee and Heckman, 2000). This saturation occurs because most of the PIC is generated in dendritic regions where its activation greatly reduces excitatory synaptic driving force (Elbasiouny et al., 2006; Bui et al., 2008). By avoiding excessive PIC activation, push–pull control may reduce or avoid saturation.
We have emphasized the primary role of muscle spindle Ia afferents and Ia inhibitory interneurons in generating push–pull (Fig. 1) because our previous studies have shown that the synaptic currents generated in ankle extensor motoneurons by ankle rotation are dominated by this Ia system (Hyngstrom et al., 2007, 2008a). Golgi tendon organ Ib afferents are minimally activated by passive joint rotations during the intracellular studies, but would have been strongly activated in our studies of the forces produced by push–pull. Our results for these active joint rotations strongly supported the existence of push–pull, so the presence of the Ib sensory input is unlikely to disrupt the pattern set by Ia afferents and Ia interneurons. Probably, this reflects the modest impact of this force feedback back onto the muscle of origin—i.e., of the homonymous pathway (Houk et al., 1970; Zytnicki et al., 1990). Thus, the focused Ia excitatory–inhibitory system may continue to dominate.
This study has demonstrated a push–pull organization for sensory inputs at a single joint, as our focus was on evaluating the cellular to system transformation and the interaction with neuromodulation. Further studies are required to determine whether other limb joints also behave in a push–pull manner. This seems likely, as reciprocal inhibition functions at the knee and hip (Eccles and Lundberg, 1958; Nichols et al., 1999). An important additional question is whether push–pull organization is used for centrally driven movements like locomotion or volitional tasks. In this regard, an important point is that the Ia interneurons also receive strong inputs from locomotor and descending inputs (Jankowska, 1992; Hultborn, 2001) and thus respond not only to sensory input but also to motor commands. The firing patterns of Ia inhibitory interneurons have recently been assessed during fictive locomotion, which of course involves no changes in muscle length or activation of muscle spindles. The Ia interneurons fired continuously but increased their firing rates when their target motoneurons were hyperpolarized and decreased their rates during target depolarization (Geertsen et al., 2011). This result clearly indicates that not only do the Ia interneurons receive strong input from the central pattern generator for locomotion, but also that the resulting pattern of firing is entirely consistent with push–pull control of motoneurons. For example, the decrease in Ia interneuron firing during target motoneuron depolarization would provide the disinhibition for push–pull. Moreover, one major descending input system, the vestibulospinal system, appears to be inherently organized in a push–pull fashion (Grande et al., 2010). Remarkably, the excitatory and inhibitory synapses for this vestibular push–pull are closely colocalized within the dendritic tree (Grande et al., 2010). Movement, however, might alter this clear centrally driven pattern. For example, activation of the agonist muscle produces often shortening, as for ankle extensors at the end of the stance phase in locomotion. If shortening induces a decrease in Ia afferent firing rate, the sensory and central inputs to Ia interneurons during locomotion would oppose each other. In locomotion, however, there is alpha–gamma coactivation (Prochazka and Gorassini, 1998). The gamma motoneuron effects on the spindles tend to reduce the dependence of Ia afferent firing on muscle length and may thus allow push–pull to be the dominate organization at the motoneuron.
Alpha–gamma coactivation may also operate in slow to moderate speed volitional movements. In fact, during slow shortening, firing of Ia afferents in the agonist muscle is approximately constant, presumably because of the opposing effects of length and gamma drive (Hulliger et al., 1985; Wessberg and Vallbo, 1996). Moreover, the tonic activity required for push–pull may be present in Ia interneurons. Recordings of interneurons in awake behaving primates found that ∼80% of the cervical interneurons were active in the resting state between movements (Prut and Perlmutter, 2003a,b), and it seems reasonable to assume that Ia interneurons are included in this dataset. Thus, push–pull organization could, in theory, be applied during locomotor and voluntary movements and be a fundamental component of many types of motor tasks.
It should, however, be emphasized that push–pull organization is unlikely to apply to all motor tasks, which exhibit a great diversity. For example, gamma motor drive is not always closely linked to alpha (Prochazka et al., 1985) and motoneuron electrical properties are altered by neuromodulatory systems within the spinal cord (Miles et al., 2007; Zagoraiou et al., 2009; Power et al., 2010). Equally important, a pattern of excitation and inhibition that is opposite to that of push–pull, in which inhibition increases as excitation increases, has been demonstrated in the scratch reflex in turtle motoneurons (Berg et al., 2007), though this opposite pattern does not seem to occur in locomotion in the turtle (Stein, 2010) or in either scratch or locomotion patterns in mammals (Perreault et al., 1999; Endo and Kiehn, 2008). We have recently argued that motoneuron electrical properties are reconfigured to match the demands of each different motor task (Johnson and Heckman, 2010), speculating that this reconfiguration is achieved by varying the patterns of inhibition and neuromodulation. In this way, the electrical properties of motoneurons may be matched, or perhaps even optimized, to meet the wide range of functional demands of different motor tasks.
Footnotes
This work was supported by a grant from NIH (NINDS NS 034383). We thank Dr. Jack Miller for technical assistance.
References
- Abbott LF, Chance FS. Drivers and modulators from push–pull and balanced synaptic input. Prog Brain Res. 2005;149:147–155. doi: 10.1016/S0079-6123(05)49011-1. [DOI] [PubMed] [Google Scholar]
- Archie KA, Mel BW. A model for intradendritic computation of binocular disparity. Nat Neurosci. 2000;3:54–63. doi: 10.1038/71125. [DOI] [PubMed] [Google Scholar]
- Bennett DJ, Hultborn H, Fedirchuk B, Gorassini M. Synaptic activation of plateaus in hindlimb motoneurons of decerebrate cats. J Neurophysiol. 1998;80:2023–2037. doi: 10.1152/jn.1998.80.4.2023. [DOI] [PubMed] [Google Scholar]
- Berg RW, Alaburda A, Hounsgaard J. Balanced inhibition and excitation drive spike activity in spinal half-centers. Science. 2007;315:390–393. doi: 10.1126/science.1134960. [DOI] [PubMed] [Google Scholar]
- Bernander O, Douglas RJ, Martin KA, Koch C. Synaptic background activity influences spatiotemporal integration in single pyramidal cells. Proc Natl Acad Sci U S A. 1991;88:11569–11573. doi: 10.1073/pnas.88.24.11569. [DOI] [PMC free article] [PubMed] [Google Scholar]
- Bui TV, Grande G, Rose PK. Multiple modes of amplification of synaptic inhibition to motoneurons by persistent inward currents. J Neurophysiol. 2008;99:571–582. doi: 10.1152/jn.00717.2007. [DOI] [PMC free article] [PubMed] [Google Scholar]
- Burke RE, Fedina L, Lundberg A. Spatial synaptic distribution of recurrent and group Ia inhibitory systems in cat spinal motoneurones. J Physiol. 1971;214:305–326. doi: 10.1113/jphysiol.1971.sp009434. [DOI] [PMC free article] [PubMed] [Google Scholar]
- Chance FS, Abbott LF, Reyes AD. Gain modulation from background synaptic input. Neuron. 2002;35:773–782. doi: 10.1016/s0896-6273(02)00820-6. [DOI] [PubMed] [Google Scholar]
- Conway BR, Livingstone MS. Spatial and temporal properties of cone signals in alert macaque primary visual cortex. J Neurosci. 2006;26:10826–10846. doi: 10.1523/JNEUROSCI.2091-06.2006. [DOI] [PMC free article] [PubMed] [Google Scholar]
- Coombs JS, Eccles JC, Fatt P. The inhibitory suppression of reflex discharges from motoneurones. J Physiol. 1955;130:396–413. doi: 10.1113/jphysiol.1955.sp005414. [DOI] [PMC free article] [PubMed] [Google Scholar]
- Destexhe A, Rudolph M, Paré D. The high-conductance state of neocortical neurons in vivo. Nat Rev Neurosci. 2003;4:739–751. doi: 10.1038/nrn1198. [DOI] [PubMed] [Google Scholar]
- Eccles JC, Fatt P, Landgren S. The inhibitory pathway to motoneurones. Prog Neurobiol. 1956;2:72–82. [PubMed] [Google Scholar]
- Eccles RM, Lundberg A. Integrative pattern of Ia synaptic actions on motoneurones of hip and knee muscles. J Physiol. 1958;144:271–298. doi: 10.1113/jphysiol.1958.sp006101. [DOI] [PMC free article] [PubMed] [Google Scholar]
- Elbasiouny SM, Bennett DJ, Mushahwar VK. Simulation of Ca2+ persistent inward currents in spinal motoneurones: mode of activation and integration of synaptic inputs. J Physiol. 2006;570:355–374. doi: 10.1113/jphysiol.2005.099119. [DOI] [PMC free article] [PubMed] [Google Scholar]
- Endo T, Kiehn O. Asymmetric operation of the locomotor central pattern generator in the neonatal mouse spinal cord. J Neurophysiol. 2008;100:3043–3054. doi: 10.1152/jn.90729.2008. [DOI] [PMC free article] [PubMed] [Google Scholar]
- Ferster D. Spatially opponent excitation and inhibition in simple cells of the cat visual cortex. J Neurosci. 1988;8:1172–1180. doi: 10.1523/JNEUROSCI.08-04-01172.1988. [DOI] [PMC free article] [PubMed] [Google Scholar]
- Fu TC, Hultborn H, Larsson R, Lundberg A. Reciprocal inhibition during the tonic stretch reflex in the decerebrate cat. J Physiol. 1978;284:345–369. doi: 10.1113/jphysiol.1978.sp012544. [DOI] [PMC free article] [PubMed] [Google Scholar]
- Geertsen SS, Stecina K, Meehan CF, Nielsen JB, Hultborn H. Reciprocal Ia inhibition contributes to motoneuronal hyperpolarisation during the inactive phase of locomotion and scratching in the cat. J Physiol. 2011;589:119–134. doi: 10.1113/jphysiol.2010.199125. [DOI] [PMC free article] [PubMed] [Google Scholar]
- Grande G, Bui TV, Rose PK. Distribution of vestibulospinal contacts on the dendrites of ipsilateral splenius motoneurons: an anatomical substrate for push–pull interactions during vestibulocollic reflexes. Brain Res. 2010;1333:9–27. doi: 10.1016/j.brainres.2010.03.065. [DOI] [PubMed] [Google Scholar]
- Heckman CJ, Binder MD. Computer simulation of the steady-state input-output function of the cat medial gastrocnemius motoneuron pool. J Neurophysiol. 1991;65:952–967. doi: 10.1152/jn.1991.65.4.952. [DOI] [PubMed] [Google Scholar]
- Heggelund P. Receptive field organization of simple cells in cat striate cortex. Exp Brain Res. 1981;42:89–98. doi: 10.1007/BF00235733. [DOI] [PubMed] [Google Scholar]
- Henneman E, Mendell LM. Functional organization of motoneuron pool and its inputs. In: Brooks VB, editor. Handbook of physiology, the nervous system, motor control, section 1, volume II, part 1. Bethesda, MD: American Physiological Society; 1981. pp. 423–507. [Google Scholar]
- Houk JC, Henneman E. Feedback control of muscle: introductory concepts. In: Mountcastle VB, editor. Medical physiology. Ed 13. St. Louis: Mosby; 1974. pp. 608–616. [Google Scholar]
- Houk JC, Singer JJ, Goldman MR. An evaluation of length and force feedback to soleus muscles of decerebrate cats. J Neurophysiol. 1970;33:784–811. doi: 10.1152/jn.1970.33.6.784. [DOI] [PubMed] [Google Scholar]
- Hounsgaard J, Hultborn H, Jespersen B, Kiehn O. Bistability of alpha-motoneurones in the decerebrate cat and in the acute spinal cat after intravenous 5-hydroxytryptophan. J Physiol. 1988;405:345–367. doi: 10.1113/jphysiol.1988.sp017336. [DOI] [PMC free article] [PubMed] [Google Scholar]
- Hulliger M, Nordh E, Vallbo AB. Discharge in muscle spindle afferents related to direction of slow precision movements in man. J Physiol. 1985;362:437–453. doi: 10.1113/jphysiol.1985.sp015687. [DOI] [PMC free article] [PubMed] [Google Scholar]
- Hultborn H. State-dependent modulation of sensory feedback. J Physiol. 2001;533:5–13. doi: 10.1111/j.1469-7793.2001.0005b.x. [DOI] [PMC free article] [PubMed] [Google Scholar]
- Hultborn H, Jankowska E, Lindström S. Recurrent inhibition from motor axon collaterals of transmission in the Ia inhibitory pathway to motoneurones. J Physiol. 1971a;215:591–612. doi: 10.1113/jphysiol.1971.sp009487. [DOI] [PMC free article] [PubMed] [Google Scholar]
- Hultborn H, Jankowska E, Lindström S. Recurrent inhibition of interneurones monosynaptically activated from group Ia afferents. J Physiol. 1971b;215:613–636. doi: 10.1113/jphysiol.1971.sp009488. [DOI] [PMC free article] [PubMed] [Google Scholar]
- Hultborn H, Illert M, Santini M. Convergence on interneurones mediating the reciprocal Ia inhibition of motoneurones. I. Disynaptic Ia inhibition of Ia inhibitory interneurones. Acta Physiol Scand. 1976;96:193–201. doi: 10.1111/j.1748-1716.1976.tb10188.x. [DOI] [PubMed] [Google Scholar]
- Hultborn H, Denton ME, Wienecke J, Nielsen JB. Variable amplification of synaptic input to cat spinal motoneurones by dendritic persistent inward current. J Physiol. 2003;552:945–952. doi: 10.1113/jphysiol.2003.050971. [DOI] [PMC free article] [PubMed] [Google Scholar]
- Hyngstrom AS, Johnson MD, Miller JF, Heckman CJ. Intrinsic electrical properties of spinal motoneurons vary with joint angle. Nat Neurosci. 2007;10:363–369. doi: 10.1038/nn1852. [DOI] [PubMed] [Google Scholar]
- Hyngstrom AS, Johnson M, Schuster J, Heckman CJ. Movement-related receptive fields of spinal motoneurones with active dendrites. J Physiol. 2008a;586:1581–1593. doi: 10.1113/jphysiol.2007.149146. [DOI] [PMC free article] [PubMed] [Google Scholar]
- Hyngstrom AS, Johnson MD, Heckman CJ. Summation of excitatory and inhibitory synaptic inputs by motoneurons with highly active dendrites. J Neurophysiol. 2008b;99:1643–1652. doi: 10.1152/jn.01253.2007. [DOI] [PMC free article] [PubMed] [Google Scholar]
- Jankowska E. Interneuronal relay in spinal pathways from proprioceptors. Prog Neurobiol. 1992;38:335–378. doi: 10.1016/0301-0082(92)90024-9. [DOI] [PubMed] [Google Scholar]
- Jankowska E, Jukes MG, Lund S, Lundberg A. Reciprocal innervation through interneuronal inhibition. Nature. 1965;206:198–199. doi: 10.1038/206198a0. [DOI] [PubMed] [Google Scholar]
- Johnson MD, Heckman CJ. Interactions between focused synaptic inputs and diffuse neuromodulation in the spinal cord. Ann N Y Acad Sci. 2010;1198:35–41. doi: 10.1111/j.1749-6632.2010.05430.x. [DOI] [PMC free article] [PubMed] [Google Scholar]
- Lee RH, Heckman CJ. Influence of voltage-sensitive dendritic conductances on bistable firing and effective synaptic current in cat spinal motoneurons in vivo. J Neurophysiol. 1996;76:2107–2110. doi: 10.1152/jn.1996.76.3.2107. [DOI] [PubMed] [Google Scholar]
- Lee RH, Heckman CJ. Bistability in spinal motoneurons in vivo: systematic variations in persistent inward currents. J Neurophysiol. 1998;80:583–593. doi: 10.1152/jn.1998.80.2.583. [DOI] [PubMed] [Google Scholar]
- Lee RH, Heckman CJ. Adjustable amplification of synaptic input in the dendrites of spinal motoneurons in vivo. J Neurosci. 2000;20:6734–6740. doi: 10.1523/JNEUROSCI.20-17-06734.2000. [DOI] [PMC free article] [PubMed] [Google Scholar]
- Matthews PB. Muscle spindles and their motor control. Physiol Rev. 1964;44:219–288. doi: 10.1152/physrev.1964.44.2.219. [DOI] [PubMed] [Google Scholar]
- Miles GB, Hartley R, Todd AJ, Brownstone RM. Spinal cholinergic interneurons regulate the excitability of motoneurons during locomotion. Proc Natl Acad Sci U S A. 2007;104:2448–2453. doi: 10.1073/pnas.0611134104. [DOI] [PMC free article] [PubMed] [Google Scholar]
- Monier C, Fournier J, Frégnac Y. In vitro and in vivo measures of evoked excitatory and inhibitory conductance dynamics in sensory cortices. J Neurosci Methods. 2008;169:323–365. doi: 10.1016/j.jneumeth.2007.11.008. [DOI] [PubMed] [Google Scholar]
- Nichols TR, Koffler-Smulevitz D. Mechanical analysis of heterogenic inhibition between soleus muscle and the pretibial flexors in the cat. J Neurophysiol. 1991;66:1139–1155. doi: 10.1152/jn.1991.66.4.1139. [DOI] [PubMed] [Google Scholar]
- Nichols TR, Cope TC, Abelew TA. Rapid spinal mechanisms of motor coordination. Exerc Sport Sci Rev. 1999;27:255–284. [PubMed] [Google Scholar]
- Perreault MC, Enriquez-Denton M, Hultborn H. Proprioceptive control of extensor activity during fictive scratching and weight support compared to fictive locomotion. J Neurosci. 1999;19:10966–10976. doi: 10.1523/JNEUROSCI.19-24-10966.1999. [DOI] [PMC free article] [PubMed] [Google Scholar]
- Power KE, McCrea DA, Fedirchuk B. Intraspinally mediated state-dependent enhancement of motoneurone excitability during fictive scratch in the adult decerebrate cat. J Physiol. 2010;588:2839–2857. doi: 10.1113/jphysiol.2010.188722. [DOI] [PMC free article] [PubMed] [Google Scholar]
- Powers RK, Binder MD. Input-output functions of mammalian motoneurons. Rev Physiol Biochem Pharmacol. 2001;143:137–263. doi: 10.1007/BFb0115594. [DOI] [PubMed] [Google Scholar]
- Prochazka A, Gorassini M. Ensemble firing of muscle afferents recorded during normal locomotion in cats. J Physiol. 1998;507:293–304. doi: 10.1111/j.1469-7793.1998.293bu.x. [DOI] [PMC free article] [PubMed] [Google Scholar]
- Prochazka A, Hulliger M, Zangger P, Appenteng K. ‘Fusimotor set’: new evidence for alpha-independent control of gamma-motoneurones during movement in the awake cat. Brain Res. 1985;339:136–140. doi: 10.1016/0006-8993(85)90632-8. [DOI] [PubMed] [Google Scholar]
- Prut Y, Perlmutter SI. Firing properties of spinal interneurons during voluntary movement. I. State-dependent regularity of firing. J Neurosci. 2003a;23:9600–9610. doi: 10.1523/JNEUROSCI.23-29-09600.2003. [DOI] [PMC free article] [PubMed] [Google Scholar]
- Prut Y, Perlmutter SI. Firing properties of spinal interneurons during voluntary movement. II. Interactions between spinal neurons. J Neurosci. 2003b;23:9611–9619. doi: 10.1523/JNEUROSCI.23-29-09611.2003. [DOI] [PMC free article] [PubMed] [Google Scholar]
- Sandercock TG, Maas H. Force summation between muscles: are muscles independent actuators? Med Sci Sports Exerc. 2009;41:184–190. doi: 10.1249/MSS.0b013e318183c0c3. [DOI] [PubMed] [Google Scholar]
- Stein PS. Alternation of agonists and antagonists during turtle hindlimb motor rhythms. Ann N Y Acad Sci. 2010;1198:105–118. doi: 10.1111/j.1749-6632.2010.05500.x. [DOI] [PMC free article] [PubMed] [Google Scholar]
- Steriade M. Impact of network activities on neuronal properties in corticothalamic systems. J Neurophysiol. 2001;86:1–39. doi: 10.1152/jn.2001.86.1.1. [DOI] [PubMed] [Google Scholar]
- Stuart GJ, Redman SJ. Voltage dependence of Ia reciprocal inhibitory currents in cat spinal motoneurones. J Physiol. 1990;420:111–125. doi: 10.1113/jphysiol.1990.sp017903. [DOI] [PMC free article] [PubMed] [Google Scholar]
- Wessberg J, Vallbo AB. Pulsatile motor output in human finger movements is not dependent on the stretch reflex. J Physiol. 1996;493:895–908. doi: 10.1113/jphysiol.1996.sp021432. [DOI] [PMC free article] [PubMed] [Google Scholar]
- Wilson VJ, Burgess PR. Disinhibition in the cat spinal cord. J Neurophysiol. 1962;25:392–404. doi: 10.1152/jn.1962.25.3.392. [DOI] [PubMed] [Google Scholar]
- Zagoraiou L, Akay T, Martin JF, Brownstone RM, Jessell TM, Miles GB. A cluster of cholinergic premotor interneurons modulates mouse locomotor activity. Neuron. 2009;64:645–662. doi: 10.1016/j.neuron.2009.10.017. [DOI] [PMC free article] [PubMed] [Google Scholar]
- Zytnicki D, Lafleur J, Horcholle-Bossavit G, Lamy F, Jami L. Reduction of Ib autogenetic inhibition in motoneurons during contractions of an ankle extensor muscle in the cat. J Neurophysiol. 1990;64:1380–1389. doi: 10.1152/jn.1990.64.5.1380. [DOI] [PubMed] [Google Scholar]


