

Abstract
We here review the use of quantum dots (QDs) for the imaging of sarcomeric movements in cardiac muscle. QDs are fluorescence substances (CdSe) that absorb photons and reemit photons at a different wavelength (depending on the size of the particle); they are efficient in generating long-lasting, narrow symmetric emission profiles, and hence useful in various types of imaging studies. Recently, we developed a novel system in which the length of a particular, single sarcomere in cardiomyocytes can be measured at ~30 nm precision. Moreover, our system enables accurate measurement of sarcomere length in the isolated heart. We propose that QDs are the ideal tool for the study of sarcomere dynamics during excitation-contraction coupling in healthy and diseased cardiac muscle.
1. Mechanisms of Contraction and Relaxation of Cardiac Muscle
First, we briefly summarize the cellular mechanisms of the excitation-contraction (EC) coupling of cardiac muscle, based on the literature (i.e., [1–3] and references therein). Upon membrane depolarization, Ca2+ enters myocytes via sarcolemmal L-type Ca2+ channels, which induces the release of Ca2+ from the sarcoplasmic reticulum (SR) (i.e., Ca2+-induced Ca2+ release mechanism; CICR), resulting in an increase in [Ca2+]i and subsequently the binding of Ca2+ to troponin (Tn), resulting in the subsequent formation of cross-bridges (see Figure 1 for sarcomere structure).
Figure 1.
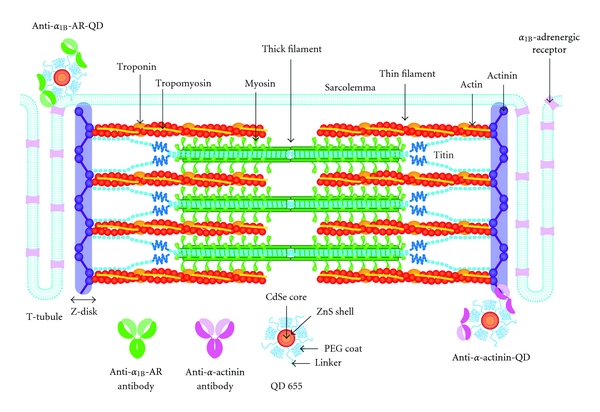
Schematic illustration indicating the structure of a cardiac sarcomere associated with T-tubules. As discussed in [33], T-tubules and Z-disks are considered to run in parallel in cardiac muscle, causing Ca2+ sparks at/near the Z-disks. Thick and thin filaments, and titin are shown in this illustration (for simplicity, only two titin molecules per half thick filament are shown) (cf. [37] for electron microscopic images of titin molecules in the sarcomere). Also, troponin and tropomyosin are bound to the thin filaments. As described in detail in earlier papers (e.g., [12, 13]), I-band titin is in a contracted state at the slack SL; straightening of the tandem Ig segment and, then, extension of the PEVK and N2B segments are thought to occur (resulting in passive force generation) in response to stretch. In the lower part of the figure, the antibodies we used in the present work and the structure of the QD (Qdot 655 Invitrogen, Carlsbad, CA, USA) are shown (number indicating the emission wavelength). The anti-α-actinin antibody-QDs bind to Z-disks, and anti-α1B-adrenergic receptor (AR) antibody-QDs bind to the T-tubules.
Tn is a heterotrimer of distinct gene products: that is, TnC, TnI, and TnT (see [3, 4] and references therein). Ca2+ binds to the regulatory Ca2+-binding site of TnC, resulting in the onset of conformational changes of the thin filament. During diastole, the C-terminal domain of TnI tightly binds to actin, and tropomyosin blocks the actomyosin interaction (“off” state). However, when Ca2+ binds to the regulatory Ca2+-binding site of TnC during systole, the C-terminal domain of TnI is dissociated from actin and binds to the N-terminal domain of TnC, due to the enhanced binding of TnC and TnI (“on” state). The transition from the “off” to “on” state is associated with a movement and conformational change of tropomyosin on the thin filament, facilitating the binding of myosin molecules to actin (see [3, 4] and references therein). Similar to Ca2+, the strongly bound cross-bridges such as the rigor complex or the actomyosin-ADP complex can “turn on” the thin filament, as if Ca2+ were bound to TnC, further promoting the formation of cycling cross-bridges (e.g., [5–7]). Therefore, under physiologic conditions, both Ca2+ and strongly bound cross-bridges regulate the state of the thin filament in a coordinated fashion.
After the peak of contraction, [Ca2+]i is lowered via, mostly, four Ca2+-transport systems: that is, (i) sequestration by the SR Ca2+-ATPase pump, (ii) efflux via the sarcolemmal Na+/Ca2+ exchanger, (iii) extrusion by the sarcolemmal Ca2+-ATPase pump, and (iv) uptake into mitochondria via the Ca2+ uniporter [see [1, 2] and references therein].
Recent advances in molecular imaging technologies have enhanced our understanding of the EC coupling of cardiac muscle. In particular, the processes of the local changes of various ions at/near the T-tubules (such as the dynamics of Ca2+ sparks) in isolated myocytes have been elucidated (e.g., [1, 2]). In addition, a recent study greatly improved the quantification of Ca2+ sparks [8]. It should be stressed that compared to ions/currents, our knowledge is still limited regarding the sarcomere dynamics in localized, focal areas of cardiomyocytes. Indeed, although it is generally thought that all sarcomeres within a cardiomyocyte uniformly respond to a change in [Ca2+]i to produce mechanical force, this notion has yet to be verified. Therefore, careful experimentation employing advanced nanotechnologies is needed to fully reveal the mechanism by which EC coupling is regulated in localized areas at/near T-tubules in a cardiomyocyte, and the subsequent transmission throughout the myocyte.
2. Sarcomere Length Dependence of Ca2+ Activation: Underling Mechanism for Frank-Starling's Law of the Heart
It is well established that active force production of cardiac muscle is more sarcomere length-(SL-) dependent than that of skeletal muscle (e.g., [3, 9–13]). Allen and Kurihara [14] applied the Ca2+-sensitive photoprotein aequorin to cardiac muscle and simultaneously measured [Ca2+]i and twitch force at varying muscle lengths. Accordingly, they discovered that the increase in twitch force was not associated with a rise in [Ca2+]i, but with activation of myofilament proteins per se. Indeed, a number of later studies using various types of preparations have provided solid evidence that a change of only ~0.1 μm in SL causes a dramatic change in mechanical properties, especially under physiologic partial activation states where the average [Ca2+]i increases to ~10‒6 M (e.g., [15, 16]).
What is the molecular basis for this pronounced SL dependence? It has been demonstrated that SL elongation causes a decrease in interfilament lattice spacing via the radial component of titin-based passive force in the sarcomere, promoting cross-bridge attachment [17–19]. More recently, we reported that the binding of myosin-ATP to actin upon reduction in the lattice spacing depends highly on the thin filament “on-off” state [7, 20]. It is therefore considered that interfilament lattice spacing and thin filament “on-off” switching are the two essential factors that regulate length-dependent activation.
3. Use of Quantum Dots (QDs) for the Detection of Sarcomere Length
Because of the large length dependence of active force, accurate measurement of SL is the key to unveiling the contracting functions of cardiac muscle at the molecular level. A number of studies have been conducted on cardiomyocytes, cardiac strips, and whole heart of various animal species, but SL is usually averaged along the longitudinal axis of the myocyte (e.g., [21, 22] and references therein). Indeed, the averaging of SLs allows researchers to obtain stable and consistent values with minimal deviation, hence useful for quantification. However, it is likely that the SL value varies even within the same myocyte during cardiac beat, due to variations in the magnitude of the local rise in [Ca2+]i at/near the T-tubules, especially in diseased tissues (see [1, 2] and references therein). Therefore, the variance in SL may be transmitted over a long distance along the longitudinal axis, influencing the myocyte's mechanical properties (e.g., length-dependent activation). Thus, it is critical to establish a method by which one can visualize the motions of a single sarcomere at high spatial and temporal resolution in various regions of the myocyte.
In various fields within biological sciences, QDs are widely used to view the motions of molecules, because they are extremely efficient in generating long-lasting fluorescence, with their intrinsic brightness; in fact, they are many times more efficient than other classes of fluorophores (see e.g., [23, 24]). These characteristics of QDs are favorable for long-term imaging experiments in cells as well as in vivo. Indeed, Tada et al. [23] successfully conducted the tracking of the HER2 molecule in living mice. Later, Gonda et al. [24] dramatically enhanced the quality of the positioning of QDs and tracked the movement of cancer cells in anesthetized living mice at a precision of ~7 nm.
By taking advantage of the nature of QDs, we recently developed a novel technique to measure the length of individual sarcomeres in isolated cardiomyocytes and in the whole heart [25] (see also Figure 1). In that study, we analyzed the movement of QDs (Qdot 655 Invitrogen, Carlsbad, CA, USA) conjugated with anti-α-actinin antibody attached to the Z-disks of sarcomeres in skinned rat ventricular myocytes during spontaneous sarcomeric oscillations (SPOC) that occur under partial activation states (i.e., ADP-SPOC and Ca-SPOC; see [26–30]), and in intact cardiomyocytes under electric field stimulation. It should be stressed that compared to a widely used organic dye (i.e., Alexa 488), QDs enable the measurement of the length of a single sarcomere at a resolution of ~30 nm for a relatively long period (i.e., 1 min) [25]. Here, as shown in Figure 2, even when the myocyte was in motion (due to ADP-SPOC), we found that the QD fluorescence successfully provided clear striations along the myocyte compared to that obtained under the bright field (see also Supplementary Videos 1 and 2, see in Supplementary Material available online at doi:10.1155/2012/313814).
Figure 2.
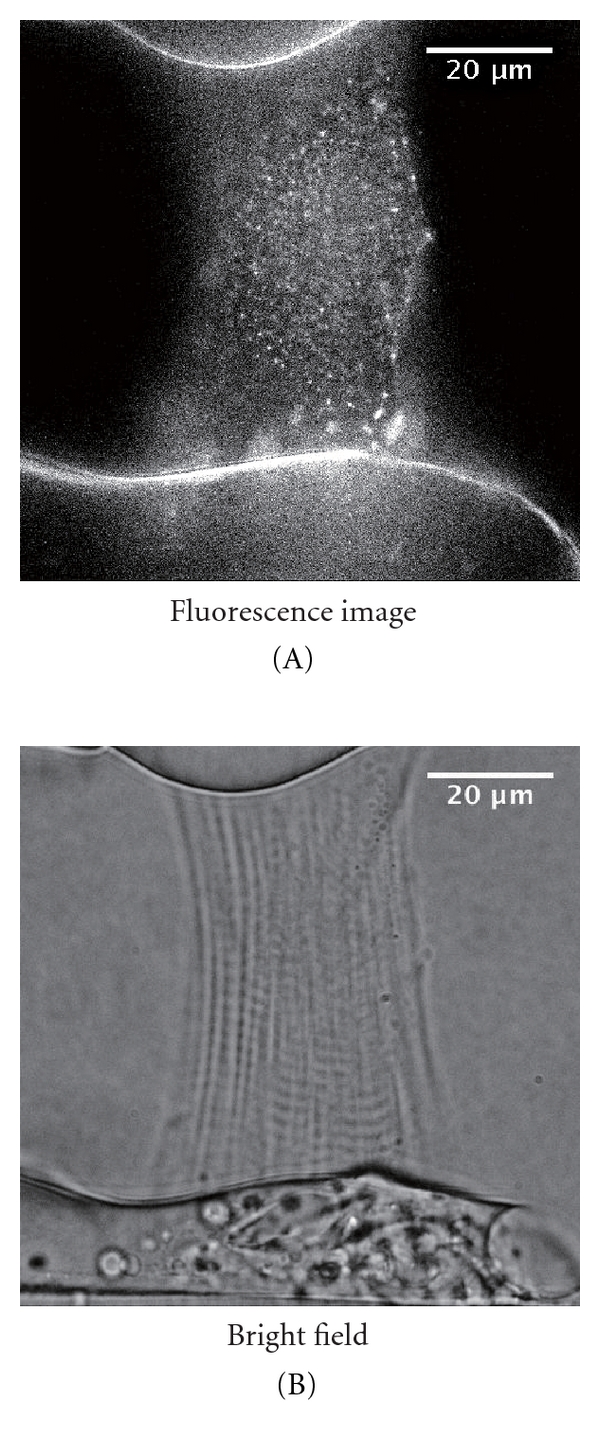
(A) Epi-illumination of a rat skinned myocyte treated with anti-α-actinin antibody-QDs excited by blue light during ADP-SPOC (see [25] for composition of the ADP-SPOC solution). Note the clear striations along the myocyte. (B) Same myocyte as in the (A) during ADP-SPOC, observed under the bright field. Observations were conducted under the same optics system as described in [25], and the temperature was maintained at 25°C. See Supplementary Videos 1 and 2.
One interesting finding in our previous work [25] is that intact cardiomyocytes showed periodic outlines after treatment with a mixture of anti-α-actinin antibody-QDs and FuGENE HD (a lipid reagent; Roche Ltd., Basel, Switzerland), indicating the infiltration of the antibody-QDs into the myocytes and their subsequent attachment to the Z-disks. The myocytes treated in this way were shown to normally respond to electric field stimulations at various frequencies (1–5 Hz), indicating the usefulness of QDs for various physiological experiments with living myocytes. Our previous finding that the waveform properties upon electric field stimulation became similar to those obtained during SPOC at high stimulation frequencies of 3–5 Hz (i.e., relatively slow shortening followed by quick re-lengthening) suggests that SPOC may facilitate the organization of sarcomeric waveform to efficiently produce mechanical force in living myocytes. Future studies should be directed to determine whether or not SPOC indeed occurs in the normal physiological setting.
Figure 3(A) shows the epi-fluorescent image of an intact cardiomyocyte treated with QDs conjugated with anti-α1B-adrenergic receptor antibody (details given in the legend of Figure 3; see also Figure 1 for binding of the antibody-QD complex to the T-tubule). We observed periodic fluorescent signals along the longitudinal axis of the myocyte, indicating the positions of the T-tubules. Figure 3(B) shows the results of the analyses of the distances between the peaks of the QD signals at different locations in the myocyte shown in Figure 3(A). We found that the distances between the T-tubules (even two sequential distances) differ within the myocyte to a magnitude greater than that found in skinned myocytes (i.e., as much as ~0.2 μm; cf. [25]), suggesting relatively large variance of SL, as previously reported in an earlier study [31]. It has been reported that, albeit a probability lower than that during systole, Ca2+ sparks occur during diastole in intact cardiomyocytes (e.g., [1, 2]). Consistent with this notion, we observed that Ca2+ sparks indeed randomly occurred under our experimental condition in various regions in an intact myocyte, followed by a marked Ca2+ wave, coupled presumably with autonomous depolarization of the sarcolemma (see Supplemental Video 3). These results may suggest that during diastole, differing magnitudes of Ca2+ sparks occurring at varying localized areas of the myocyte result in different magnitudes of contractions in sarcomeres within the cell, hence different lengths of the sarcomere.
Figure 3.
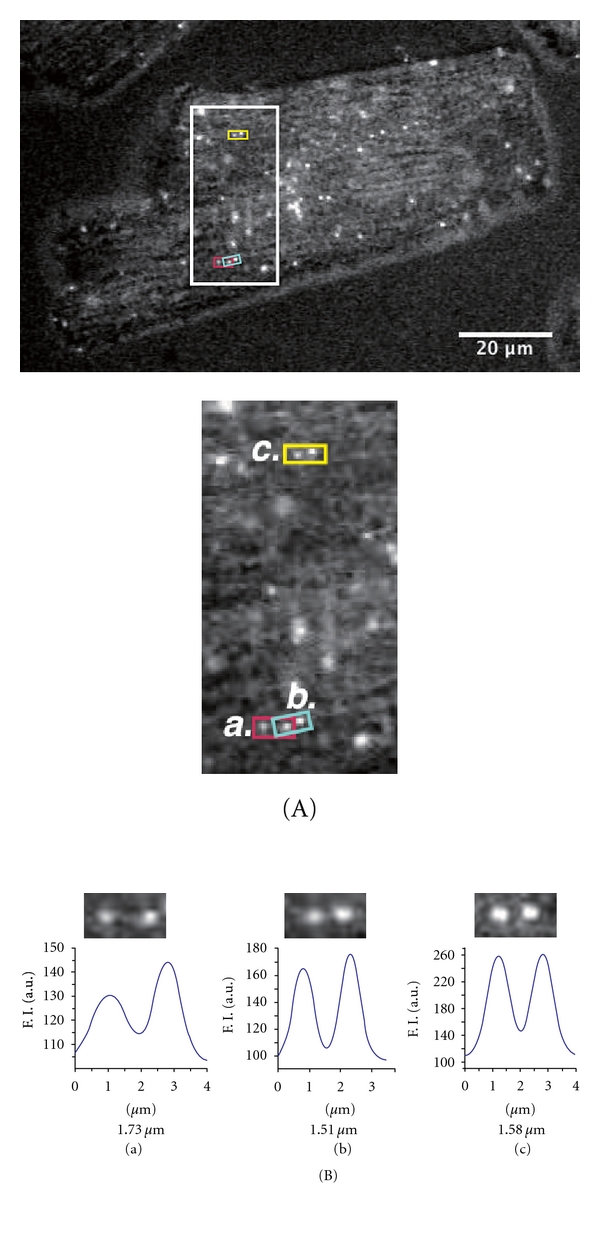
(A) Top, Epi-illumination image of an intact cardiomyocyte treated with anti-α1B-adrenergic receptor antibody (sc-27136, Santa Cruz, CA; see [38]) QDs at 3 nM in oxygenated Ca2+-free-HEPES-Tyrode's solution containing 20 mM 2,3-butane-dione monoxime at 25°C (see [25]). Note the periodic fluorescent profiles of QDs along the myocyte. Bottom, enlarged view of the area shown in the rectangular outline in the top of this figure. (a), (b), and (c) indicate the regions within the myocyte used for the length analyses in (B). (B) Analysis of the distance (indicated by the number below each graph) between the QD fluorescence signals in (a), (b), and (c) in (a). Analysis was conducted based on [25]. We found that the values differed for two sequential distances, that is, 1.73 and 1.51 μm, respectively, in (a) and (b). The inhomogeneity of the length of the sarcomere in series may induce nonlinear phenomena such as SPOC upon activation (see [30]), because the ~0.2 μm difference in SL can affect the actomyosin interaction and titin-based restorative passive force (e.g., [10–13]). As previously shown [38], α1B-adrenergic receptors are predominantly localized at the T-tubules.
It is worthwhile noting that FuGENE HD (cf. [25]) may cause irreversible damage to the sarcolemmal functions of cardiomyocytes, and this damage, albeit only a slight magnitude, may result in abnormal depolarization and/or repolarization. In contrast, we consider that the conjugation of QDs and the antibody specific to the extracellular domains of proteins present predominantly in the T-tubules, such as α1B-adrenergic receptors (shown in the present study), allows for visualization of mechanical performance of cardiomyocytes under physiologic conditions with, possibly, little or no damage of the sarcolemmal functions.
Here, a criticism may arise as to the verification of the observed distance between the QD fluorescent signals in intact cardiomyocytes (Figure 3(A)), because the signals indicate the positions of the T-tubules (not the Z-disks). Indeed, the T-tubules are reportedly disposed not simply over but around the Z-disks [32], and because of this, measuring the distance between two dots (fluorescence peaks) may cause some error in detecting SL in a localized area, especially during systole. However, considering the general consensus that the T-tubules and Z-disks are closely associated and run in parallel in mammalian ventricular cells (e.g., [21, 33]), it is reasonable to assume in the present study that the fluorescence signals obtained from QD-treated myocytes represent the locations of the Z-disks, and therefore, the distance between the two fluorescence peaks indicates the length of a single sarcomere within a particular region. Future studies, with, for example, a double optical path, are needed to clarify how the T-tubules and Z-disks are aligned in cardiomyocytes during diastole and systole.
4. Sarcomere Length Measurement in the Whole Heart
Several groups have reported the results of SL measurement in the heart at the organ level, by using X-ray diffraction [34], postmortem histology [35], and two-photon imaging [21]. Time-resolved X-ray diffraction-based techniques appear to be suitable for measuring rapid changes in SL during contraction. However, in the whole heart, measured SL data provide a group average of several hundred cells and, therefore, are not suitable for determining SL values as a function of local movement of cardiomyocytes. Recently, Bub et al. [21] established a technique using two-photon microscopy to directly image striations of cardiomyocytes in the arrested isolated heart, stained with the fluorescent marker di-4-ANEPPS. While this system appears to be useful to accurately measure SL (or more precisely, the distance between the T-tubules) alongside the cardiomyocyte, it is not applicable to the heart at work (especially to the heart of small animals with high heart rates), because of the slow camera frame rate (>1 sec). In our previous study [25], we detected the fluorescence of QDs from myocytes at the surface of the LV of the whole heart of the rat, and found that the peak-to-peak fluorescence distance was ~2.00 μm (i.e., close to those obtained by using different methods; cf. [8, 34–36]) under the relaxed state. Because the experiment was conducted after perfusion of the heart with Ca2+ free-HEPES-Tyrode solution containing 80 mM 2,3-butane-dione monoxime, we consider that the value reflects the SL during diastole. In this system, we observed epifluorescence of QDs with an EMCCD camera, allowing us to measure the length of a single sarcomere at 30 frames per second (fps). Therefore, in future studies, QDs may be a valuable tool to detect the length of a single sarcomere in a particular myocyte in the heart in vivo, after resolution of the problems associated with focus adjustment in the Z-direction during cardiac beat.
5. Conclusion
In this article, we summarized the molecular mechanisms of the EC coupling of cardiac muscle, focusing on the contractile function. We highlighted the recent advances in the measurement of single sarcomere dynamics with QDs in skinned and intact myocytes, as well as in the whole heart. We also presented new data showing that QDs revealed differences in the length of sarcomeres within the same myocyte even during diastole, presumably due to the “on/off” of Ca2+-sparks in localized regions. We therefore consider that QDs are a useful, powerful tool to quantitatively analyze the dynamics of cardiac muscle under various experimental settings.
Supplementary Material
Supplemental Video 1: Movie showing ADP-SPOC in a skinned cardiomyocyte treated with anti-α-actinin antibody-QDs. Excited by blue light. Speed, 31 fps. See Figure 1 for the sarcomere structure and antibody conjugated-QDs.
Supplemental Video 2: Same myocyte as in Supplemental Video 1 but observed under the bright field. Speed, 31 fps.
Supplemental Video 3: Movie showing Ca2+ sparks at rest without stimulation followed by a Ca2+ wave propagating through a rat ventricular myocyte. Ca2+ was detected with Fluo-4 at 25°C, based on (25). Bar, 10 μm. Speed, 31 fps.
Acknowledgments
The authors thank Naoko Tomizawa (Department of Cell Physiology, The Jikei University School of Medicine, Tokyo, Japan) for superb technical assistance. The work of the authors was supported in part by Grants-in-Aid for Scientific Research (N. Fukuda and S. Kurihara), Scientific Research on Innovative Areas (N. Fukuda) and for Challenging Exploratory Research (F. Kobirumaki-Shimozawa and N. Fukuda) from the Ministry of Education, Culture, Sports, Science and Technology of Japan and by grants from the Japan Science and Technology Agency (CREST) (N. Fukuda), the Vehicle Racing Commemorative Foundation (S. Kurihara), the Institute of Seizon and Life Sciences (S. Kurihara) and the CASIO Science Promotion Foundation (N. Fukuda). No conflicts of interest, financial or otherwise, are declared by the authors.
References
- 1.Bers DM. Excitation-Contraction Coupling and Cardiac Contractile Force. 2nd edition. Dordrecht, The Netherlands: Kluwer-Academic; 2001. [Google Scholar]
- 2.Bers DM. Cardiac excitation-contraction coupling. Nature. 2002;415(6868):198–205. doi: 10.1038/415198a. [DOI] [PubMed] [Google Scholar]
- 3.Fukuda N, Terui T, Ohtsuki I, Ishiwata S, Kurihara S. Titin and troponin: central players in the Frank-Starling mechanism of the heart. Current Cardiology Reviews. 2009;5(2):119–124. doi: 10.2174/157340309788166714. [DOI] [PMC free article] [PubMed] [Google Scholar]
- 4.Solaro RJ, Rarick HM. Troponin and tropomyosin: proteins that switch on and tune in the activity of cardiac myofilaments. Circulation Research. 1998;83(5):471–480. doi: 10.1161/01.res.83.5.471. [DOI] [PubMed] [Google Scholar]
- 5.Fukuda N, Fujita H, Fujita T, Ishiwata S. Regulatory roles of MgADP and calcium in tension development of skinned cardiac muscle. Journal of Muscle Research and Cell Motility. 1998;19(8):909–921. doi: 10.1023/a:1005437517287. [DOI] [PubMed] [Google Scholar]
- 6.Fukuda N, Kajiwara H, Ishiwata S, Kurihara S. Effects of MgADP on length dependence of tension generation in skinned rat cardiac muscle. Circulation Research. 2000;86(1):e1–e6. doi: 10.1161/01.res.86.1.e1. [DOI] [PubMed] [Google Scholar]
- 7.Terui T, Shimamoto Y, Yamane M, et al. Regulatory mechanism of length-dependent activation in skinned porcine ventricular muscle: role of thin filament cooperative activation in the Frank-Starling relation. Journal of General Physiology. 2010;136(4):469–482. doi: 10.1085/jgp.201010502. [DOI] [PMC free article] [PubMed] [Google Scholar]
- 8.Bankhead P, Norman Scholfield C, Curtis TM, McGeown JG. Detecting Ca2+ sparks on stationary and varying baselines. American Journal of Physiology. 2011;301(3):C717–C728. doi: 10.1152/ajpcell.00032.2011. [DOI] [PubMed] [Google Scholar]
- 9.Katz AM. Ernest Henry Starling, his predecessors, and the ‘Law of the Heart’. Circulation. 2002;106(23):2986–2992. doi: 10.1161/01.cir.0000040594.96123.55. [DOI] [PubMed] [Google Scholar]
- 10.Fukuda N, Granzier H. Role of the giant elastic protein titin in the Frank-Starling mechanism of the heart. Current Vascular Pharmacology. 2004;2(2):135–139. doi: 10.2174/1570161043476357. [DOI] [PubMed] [Google Scholar]
- 11.Fukuda N, Granzier HL. Titin/connectin-based modulation of the Frank-Starling mechanism of the heart. Journal of Muscle Research and Cell Motility. 2005;26(6–8):319–323. doi: 10.1007/s10974-005-9038-1. [DOI] [PubMed] [Google Scholar]
- 12.Fukuda N, Granzier HL, Ishiwata S, Kurihara S. Physiological functions of the giant elastic protein titin in mammalian striated muscle. Journal of Physiological Sciences. 2008;58(3):151–159. doi: 10.2170/physiolsci.RV005408. [DOI] [PubMed] [Google Scholar]
- 13.Fukuda N, Terui T, Ishiwata S, Kurihara S. Titin-based regulations of diastolic and systolic functions of mammalian cardiac muscle. Journal of Molecular and Cellular Cardiology. 2010;48(5):876–881. doi: 10.1016/j.yjmcc.2009.11.013. [DOI] [PubMed] [Google Scholar]
- 14.Allen DG, Kurihara S. The effects of muscle length on intracellular calcium transients in mammalian cardiac muscle. Journal of Physiology. 1982;327:79–94. doi: 10.1113/jphysiol.1982.sp014221. [DOI] [PMC free article] [PubMed] [Google Scholar]
- 15.Allen DG, Kentish JC. The cellular basis of the length-tension relation in cardiac muscle. Journal of Molecular and Cellular Cardiology. 1985;17(9):821–840. doi: 10.1016/s0022-2828(85)80097-3. [DOI] [PubMed] [Google Scholar]
- 16.Fukuda N, Sasaki D, Ishiwata S, Kurihara S. Length dependence of tension generation in rat skinned cardiac muscle: role of titin in the Frank-Starling mechanism of the heart. Circulation. 2001;104(14):1639–1645. doi: 10.1161/hc3901.095898. [DOI] [PubMed] [Google Scholar]
- 17.Cazorla O, Wu Y, Irving TC, Granzier H. Titin-based modulation of calcium sensitivity of active tension in mouse skinned cardiac myocytes. Circulation Research. 2001;88(10):1028–1035. doi: 10.1161/hh1001.090876. [DOI] [PubMed] [Google Scholar]
- 18.Fukuda N, Wu Y, Farman G, Irving TC, Granzier H. Titin isoform variance and length dependence of activation in skinned bovine cardiac muscle. Journal of Physiology. 2003;553, part 1:147–154. doi: 10.1113/jphysiol.2003.049759. [DOI] [PMC free article] [PubMed] [Google Scholar]
- 19.Fukuda N, Wu Y, Farman G, Irving TC, Granzier H. Titin-based modulation of active tension and interfilament lattice spacing in skinned rat cardiac muscle. Pflugers Archiv European Journal of Physiology. 2005;449(5):449–457. doi: 10.1007/s00424-004-1354-6. [DOI] [PubMed] [Google Scholar]
- 20.Terui T, Sodnomtseren M, Matsuba D, et al. Troponin and titin coordinately regulate length-dependent activation in skinned porcine ventricular muscle. Journal of General Physiology. 2008;131(3):275–283. doi: 10.1085/jgp.200709895. [DOI] [PMC free article] [PubMed] [Google Scholar]
- 21.Bub G, Camelliti P, Bollensdorff C, et al. Measurement and analysis of sarcomere length in rat cardiomyocytes in situ and in vitro. American Journal of Physiology. 2010;298(5):H1616–H1625. doi: 10.1152/ajpheart.00481.2009. [DOI] [PMC free article] [PubMed] [Google Scholar]
- 22.King NMP, Methawasin M, Nedrud J, et al. Mouse intact cardiac myocyte mechanics: cross-bridge and titin-based stress in unactivated cells. Journal of General Physiology. 2011;137(1):81–91. doi: 10.1085/jgp.201010499. [DOI] [PMC free article] [PubMed] [Google Scholar]
- 23.Tada H, Higuchi H, Wanatabe TM, Ohuchi N. In vivo real-time tracking of single quantum dots conjugated with monoclonal anti-HER2 antibody in tumors of mice. Cancer Research. 2007;67(3):1138–1144. doi: 10.1158/0008-5472.CAN-06-1185. [DOI] [PubMed] [Google Scholar]
- 24.Gonda K, Watanabe TM, Ohuchi N, Higuchi H. In vivo nano-imaging of membrane dynamics in metastatic tumor cells using quantum dots. Journal of Biological Chemistry. 2010;285(4):2750–2757. doi: 10.1074/jbc.M109.075374. [DOI] [PMC free article] [PubMed] [Google Scholar]
- 25.Serizawa T, Terui T, Kagemoto T, et al. Real-time measurement of the length of a single sarcomere in rat ventricular myocytes: a novel analysis with quantum dots. American Journal of Physiology. 2011;301(5):C1116–C1127. doi: 10.1152/ajpcell.00161.2011. [DOI] [PubMed] [Google Scholar]
- 26.Fukuda N, Fujita H, Fujita T, Ishiwata S. Spontaneous tension oscillation in skinned bovine cardiac muscle. Pflugers Archiv European Journal of Physiology. 1996;433(1-2):1–8. doi: 10.1007/s004240050241. [DOI] [PubMed] [Google Scholar]
- 27.Fukuda N, Ishiwata S. Effects of pH on spontaneous tension oscillation in skinned bovine cardiac muscle. Pflugers Archiv European Journal of Physiology. 1999;438(2):125–132. doi: 10.1007/s004240050889. [DOI] [PubMed] [Google Scholar]
- 28.Sasaki D, Fujita H, Fukuda N, Kurihara S, Ishiwata S. Auto-oscillations of skinned myocardium correlating with heartbeat. Journal of Muscle Research and Cell Motility. 2005;26(2-3):93–101. doi: 10.1007/s10974-005-0249-2. [DOI] [PubMed] [Google Scholar]
- 29.Sasaki D, Fukuda N, Ishiwata S. Myocardial sarcomeres spontaneously oscillate with the period of heartbeat under physiological conditions. Biochemical and Biophysical Research Communications. 2006;343(4):1146–1152. doi: 10.1016/j.bbrc.2006.03.070. [DOI] [PubMed] [Google Scholar]
- 30.Ishiwata S, Shimamoto Y, Fukuda N. Contractile system of muscle as an auto-oscillator. Progress in Biophysics and Molecular Biology. 2011;105(3):187–198. doi: 10.1016/j.pbiomolbio.2010.11.009. [DOI] [PubMed] [Google Scholar]
- 31.Sarai N, Kihara Y, Izumi T, Mitsuiye T, Matsuoka S, Noma A. Nonuniformity of sarcomere shortenings in the isolated rat ventricular myocyte. Japanese Journal of Physiology. 2002;52(4):371–381. doi: 10.2170/jjphysiol.52.371. [DOI] [PubMed] [Google Scholar]
- 32.Soeller C, Cannell MB. Two-photon microscopy: imaging in scattering samples and three-dimensionally resolved flash photolysis. Microscopy Research and Technique. 1999;47(3):182–195. doi: 10.1002/(SICI)1097-0029(19991101)47:3<182::AID-JEMT4>3.0.CO;2-4. [DOI] [PubMed] [Google Scholar]
- 33.M. Berne R, N. Levy M, M. Koeppen B, A. Stanton B. Physiology. 4th edition. St. Louis, Mo, USA: Mosby; 1998. [Google Scholar]
- 34.Yagi N, Shimizu J, Mohri S, et al. X-ray diffraction from a left ventricular wall of rat heart. Biophysical Journal. 2004;86(4):2286–2294. doi: 10.1016/S0006-3495(04)74286-1. [DOI] [PMC free article] [PubMed] [Google Scholar]
- 35.Grimm AF, Lin HL, Grimm BR. Left ventricular free wall and intraventricular pressure-sarcomere length distributions. American Journal of Physiology. 1980;239(1):H101–H107. doi: 10.1152/ajpheart.1980.239.1.H101. [DOI] [PubMed] [Google Scholar]
- 36.Chung CS, Granzier HL. Contribution of titin and extracellular matrix to passive pressure and measurement of sarcomere length in the mouse left ventricle. Journal of Molecular and Cellular Cardiology. 2011;50(4):731–739. doi: 10.1016/j.yjmcc.2011.01.005. [DOI] [PMC free article] [PubMed] [Google Scholar]
- 37.Funatsu T, Kono E, Higuchi H, et al. Elastic filaments in situ in cardiac muscle: deep-etch replica analysis in combination with selective removal of actin and myosin filaments. Journal of Cell Biology. 1993;120(3):711–724. doi: 10.1083/jcb.120.3.711. [DOI] [PMC free article] [PubMed] [Google Scholar]
- 38.O-Uchi J, Sasaki H, Morimoto S, et al. Interaction of α1-adrenoceptor subtypes with different G proteins induces opposite effects on cardiac L-type Ca2+ channel. Circulation Research. 2008;102(11):1378–1388. doi: 10.1161/CIRCRESAHA.107.167734. [DOI] [PubMed] [Google Scholar]
Associated Data
This section collects any data citations, data availability statements, or supplementary materials included in this article.
Supplementary Materials
Supplemental Video 1: Movie showing ADP-SPOC in a skinned cardiomyocyte treated with anti-α-actinin antibody-QDs. Excited by blue light. Speed, 31 fps. See Figure 1 for the sarcomere structure and antibody conjugated-QDs.
Supplemental Video 2: Same myocyte as in Supplemental Video 1 but observed under the bright field. Speed, 31 fps.
Supplemental Video 3: Movie showing Ca2+ sparks at rest without stimulation followed by a Ca2+ wave propagating through a rat ventricular myocyte. Ca2+ was detected with Fluo-4 at 25°C, based on (25). Bar, 10 μm. Speed, 31 fps.