

Abstract
Uterine leiomyomata (UL), the most common neoplasm in reproductive-age women, are classified into distinct genetic subgroups based on recurrent chromosome abnormalities. To develop a molecular signature of UL with t(12;14)(q14-q15;q23-q24), we took advantage of the multiple UL arising as independent clonal lesions within a single uterus. We compared genome-wide expression levels of t(12;14) UL to non-t(12;14) UL from each of nine women in a paired analysis, with each sample weighted for the percentage of t(12;14) cells to adjust for mosaicism with normal cells. This resulted in a transcriptional profile that confirmed HMGA2, known to be overexpressed in t(12;14) UL, as the most significantly altered gene. Pathway analysis of the differentially expressed genes showed significant association with cell proliferation, particularly G1/S checkpoint regulation. This is consistent with the known larger size of t(12;14) UL relative to karyotypically normal UL or to UL in the deletion 7q22 subgroup. Unsupervised hierarchical clustering demonstrated that patient variability is relatively dominant to the distinction of t(12;14) UL compared with non-t(12;14) UL or of t(12;14) UL compared with del(7q) UL. The paired design we employed is therefore important to produce an accurate t(12;14) UL-specific gene list by removing the confounding effects of genotype and environment. Interestingly, myometrium not only clustered away from the tumors, but generally separated based on associated t(12;14) versus del(7q) status. Nine genes were identified whose expression can distinguish the myometrium origin. This suggests an underlying constitutional genetic predisposition to these somatic changes which could potentially lead to improved personalized management and treatment.
INTRODUCTION
Benign smooth muscle tumors of the uterus generally referred to as fibroids are the most common neoplasm of the female genital tract, occurring in up to 77% of women as defined by serial sectioning of uteri (1). These uterine leiomyomata (UL) are clinically detectable in 25% of reproductive-age women, many of whom have significant morbidity often necessitating surgery to alleviate excessive menstrual bleeding, pelvic pain, urinary complaints, constipation and reproductive dysfunction (2–4). UL are therefore the primary indication for hysterectomy, the cause for approximately one in five visits to a gynecologist, and result in expenditures exceeding 2.1 billion health-care dollars annually in the USA (5–7).
Molecular pathways underlying UL development and growth acceleration are largely unknown and most recent discoveries have stemmed from studying recurrent cytogenetic abnormalities identified among the ∼40% of karyotypically abnormal UL (8,9). One of the most common subgroups is characterized by rearrangement of 12q14-15, typically as a t(12;14)(q14-15;q23-24), which occurs in ∼7.5% of all UL and 20% of karyotypically abnormal UL (10). This high prevalence of t(12;14) and its frequent occurrence as the sole cytologically detectable chromosome abnormality suggest a primary importance for this translocation in UL tumorigenesis.
The presence of t(12;14) has been associated with larger sized UL than those with either normal karyotypes or interstitial 7q22 deletions (11–13). In particular, a systematic study of every palpable UL in each of 96 women undergoing hysterectomy without pretreatment removed any potential bias in determining significance due to tumor sampling (i.e. selection of only larger tumors mainly as a result of myomectomy rather than hysterectomy) or due to pretreatment with gonadotropin-releasing hormone-agonists that can be used to shrink tumors prior to surgery (11).
UL with t(12;14) have elevated expression of the high mobility group (HMGA) family member HMGA2 located at 12q14.3 (14,15). This architectural factor is a non-histone component of chromatin that alters DNA conformation to modulate access of transcription factors to their target genes, thereby influencing differentiation and proliferation of mesenchymal tissues (16–19). Consistently, transgenic mice null for Hmga2 have a 40% reduction in weight known as the pygmy phenotype (20,21). In fact, HMGA2 expression in both mice and humans is mainly restricted to proliferating embryonic tissues, predominantly mesenchymal derivatives including the myometrium from which UL arise, and are notably absent from differentiated adult non-proliferating counterparts (15,22,23). In addition, phosphorylation of HMGA proteins by cdc2 kinase modulates their DNA binding ability in a cell cycle-dependent manner (24). This role of HMGA2 in growth was recently extended to include an association with human height (25,26), which is further illustrated by an intragenic rearrangement in HMGA2 from a constitutional chromosome 12 inversion resulting in extreme multisystem overgrowth identified in the Guinness Book of World Records tallest teenager record holder (27). In contrast to such in vivo analyses, tissue culture induction of HMGA2 expression has been shown in a variety of human tissues including myometrium and karyotypically normal UL (15), attributed to a serum component or the weak estrogenic effect of phenol red in culture media (28). This confounds the use of in vitro methods and necessitates direct examination of gene expression in UL tumors.
UL provide a unique in vivo model as on average six to seven independent clonal tumors occur per woman. The clonal nature of UL was confirmed by the presence of t(12;14) UL in the same uterus as UL harboring different or no chromosomal changes (1), as well as by analysis of repeat polymorphisms in the X-linked androgen receptor and phosphoglycerokinase genes (29–31). We have taken advantage of these circumstances for expression profiling to compare directly UL with t(12;14) to UL without t(12;14) obtained concurrently from the same uterus.
We demonstrate that such a matched (or paired) study design is a requisite to identify the molecular profile associated with the t(12;14) subgroup. This design, previously validated for the interstitial 7q22 deletion UL subgroup (32), has not been exploited by any prior study of t(12;14) in UL. Importantly, it obviates the confounding effects of patient-to-patient variability due to divergent genotype, environment or genotype/environment interaction. In addition, the unique expression profiles we identify for myometrial samples from women with t(12;14) UL relative to those with del(7q) UL suggest an underlying genetic predisposition to these somatic alterations.
RESULTS
Screening for t(12;14) UL by fluorescence in situ hybridization and karyotyping
To identify UL with t(12;14), interphase fluorescence in situ hybridization (FISH) or karyotype analysis was employed (Table 1). A conservative false-positive cut-off of 15% for t(12;14) interphase FISH was established by doubling the positive rate found in normal peripheral blood lymphocytes. Probe binding to the correct target region without cross-hybridization was validated on lymphocyte metaphases. Screening of 348 tumors from 140 patients identified 35 t(12;14) UL (10%). Of these 35 UL, those with matched myometrium and non-t(12;14) samples, as well as a single case found through karyotyping that was confirmed by FISH, were selected for further analysis resulting in a total of nine cases. In these t(12;14) UL, the level of mosaicism of cells not carrying the abnormality ranged from 0 to 84%. Case 3 also had a proportion of cells (25%) with another recurrent UL karyotypic abnormality, interstitial deletion of 7q22.
Table 1.
Histopathology, karyotype and FISH results of UL
| Case number | Accession number | Sample type | Histopathology | Karyotype | % t(12;14) | Gene Expression Omnibus (GEO) identifiera |
|---|---|---|---|---|---|---|
| 1 | ST99-240 | t(12;14) UL | Usual type, low MI | 46,XX,t(12;14) (q15;q23-24)[10] | 100c | GSM452325 |
| ST99-241 | Non-t(12;14) UL | Usual type, low MI | 46,XX[12] | 0c | GSM452324 | |
| ST99-243 | Myometrium | —b | — | — | GSM452323 | |
| 2 | ST04-041 | t(12;14) UL | — | — | 30d | GSM452328 |
| ST04-043 | Non-t(12;14) UL | — | — | 0d,e | GSM452327 | |
| ST04-045 | Myometrium | — | — | — | GSM452326 | |
| 3f | ST04-065 | t(12;14) UL | — | — | 25% del(7q)/16% t(12;14)d | GSM452331 |
| ST04-066 | Non-t(12;14) UL | — | — | 1% del(7q)/7% t(12;14)d,e | GSM452330 | |
| ST04-067 | Myometrium | — | — | — | GSM452329 | |
| 4 | ST04-118F-2 | t(12;14) UL | Usual type, low MI | — | 100d | GSM452334 |
| ST04-118F-1 | Non-t(12;14) UL | Usual type, low MI | — | 4d,e | GSM452333 | |
| ST04-118M | Myometrium | Normal myometrium | — | — | GSM452332 | |
| 5 | ST05-019F-1 | t(12;14) UL | Mildly cellular, low MI | — | 48d | GSM452337 |
| ST05-019F-2 | Non-t(12;14) UL | Mildly cellular, low MI | — | 0d,e | GSM452336 | |
| ST05-019M | Myometrium | — | — | — | GSM452335 | |
| 6g | ST05-024F-4 | t(12;14) UL | Usual type, low MI | — | 30d | GSM452341 |
| ST05-024F-5 | Non-t(12;14) UL | Usual type, low MI | — | 5d,e | GSM452340 | |
| ST05-024M | Myometrium | — | — | — | GSM452339 | |
| 7 | ST05-031F-1 | t(12;14) UL | Usual type, low MI | — | 63d | GSM452344 |
| ST05-031F-3 | Non-t(12;14) UL | Usual type, low MI | — | 3d,e | GSM452343 | |
| ST05-031M | Myometrium | — | — | — | GSM452342 | |
| 8 | ST06-040F-1 | t(12;14) UL | Usual type, low MI | — | 77d | GSM452347 |
| ST06-040F-2 | Non-t(12;14) UL | Usual type, low MI | — | 8d,e | GSM452346 | |
| ST06-040M | Myometrium | — | — | — | GSM452345 | |
| 9 | ST06-042F-5 | t(12;14) UL | Usual type, low MI | — | 83d | GSM452350 |
| ST06-042F-1 | Non-t(12;14) UL | Usual type, low MI | — | 4d,e | GSM452349 | |
| ST06-042M | Myometrium | — | — | — | GSM452348 |
bDash indicates unknown.
cPercentage of t(12;14) cells determined by karyotype.
dPercentage of t(12;14) cells determined by FISH.
eValue below FISH false-positive cut-off for t(12;14) of 15%.
fCase 3 is a mosaic del(7q)(q22q32)/t(12;14)(q15;q23-q24) UL also reported as Case 5 in Hodge et al. (32).
gCase 6 has an independent del(7q) UL which is reported as Case 10 in Hodge et al. (32).
Identification of t(12;14)-specific UL genes
RNA from each t(12;14) UL as well as from concurrently collected non-t(12;14) UL and normal myometrium tissues from each of nine cases was hybridized on Affymetrix GeneChip Human Genome U133 Plus 2.0 oligonucleotide arrays for expression analysis. Among these cases, multiple clinical features were variable such as UL size, patient age, race and stage of menstrual cycle at the time of surgical removal (Table 2). To control for such variables, a direct comparison of the array expression data was made between tissues obtained from each individual to identify differences in expression specifically resulting from the t(12;14). A heatmap from an unsupervised hierarchical cluster analysis of the 500 most variable genes demonstrates a tendency of myometrium tissues to cluster separately from UL samples and for the t(12;14) UL and non-t(12;14) UL to cluster by patient rather than by presence or absence of the translocation (Fig. 1A). Separation of the myometrial samples from the overlapping UL groups can be visualized in three dimensions through principal component analysis (Fig. 1B). These results suggest that incorporation of the myometrial array data is suited to determining genes that differentiate any UL from the normal myometrial tissue rather than identifying the t(12;14)-specific UL genes. Therefore, myometrial samples were not included in further analyses of t(12;14)-specific genes.
Table 2.
Clinical features of UL
| Case number | Size of t(12;14) tumor (cm) | Size of non-t(12;14) tumor (cm) | Total number of tumors | Race | Age of onset (years)a | Age at surgery (years) | Menstrual cycleb |
|---|---|---|---|---|---|---|---|
| 1 | 11.5 | 14.7 | 3 | White | 47 | 47 | Proliferative |
| 2 | —c | — | 4 | White | 56 | 57 | Menopausal |
| 3 | — | — | 3 | White | 40 | 43 | Menstruation |
| 4 | 9.5 × 7.5 × 7 | 2.5 × 1.9 × 1.4 | 8 | Asian | 38 | 42 | Artificial menopause (gonadotropin-releasing hormone-agonist pretreatment) |
| 5 | 10 × 8.9 × 8.4 | 2.8 × 2.4 × 2.2 | 3 | White | 49 | 49 | Secretory |
| 6 | 5 × 4.5 × 4.5 | 5 × 4 × 4 | 10 | White | 51 | 59 | Menopausal |
| 7 | 18.5 × 12.5 × 10.5 | 4.5 × 4 × 3.6 | 5 | White | 41 | 51 | Menopausal |
| 8 | 15 × 13 × 13 | 1.5 × 1.5 × 1.5 | 4 | White | 36 | 46 | Secretory |
| 9 | 4 × 4 × 2.5 | 11 × 6 × 5.5 | 12 | Asian | 35 | 36 | Secretory |
aSelf-reported by patient.
bBased on day 1 of last menstrual period relative to surgery date (days 1–5 = menstruation; 6–14 = proliferative; 14–28+ = secretory; >100 days = menopausal).
cDash indicates unknown.
Figure 1.

Paired analysis of the t(12;14) UL and non-t(12;14) UL microarray data to control for patient-to-patient variability without involvement of the myometrium is necessary to generate an accurate t(12;14) UL-specific gene list. (A) A heatmap of an unsupervised hierarchical cluster analysis of the 500 most variable genes between myometrium (M), t(12;14) UL (T) and non-t(12;14) UL (N) from each of the nine women shows a trend of myometrial separation from all UL tissues and of UL clustering based on patient rather than t(12;14) status. A similar result is obtained when more genes are included in the analysis. (B) Unsupervised principal component analysis displays in three dimensions the tendency of the myometrial samples (green) to cluster and have only minimal overlap with the t(12;14) (blue) and non-t(12;14) UL tissues (red). (C) A comparison of the percent of genes in common between a paired and unpaired analysis of t(12;14) UL versus non-t(12;14) UL indicates that the two modes of analysis produce different gene lists. (D) The distribution of P-values for two-group comparison t-tests using a paired analysis includes a peak on the left side, indicating that more genes were found with significant P-values than expected in a random data set. In contrast, the unpaired analysis generates a decreased or nearly flat distribution, suggesting that genes with significant P-values identified by such an assessment are not likely to be true positives.
The importance of controlling for patient-to-patient variability is illustrated by comparing the percent of genes overlapping between gene lists generated by a paired and an unpaired analysis of the t(12;14) UL and non-t(12;14) UL expression data. The two analyses had an ∼50% gene overlap (Fig. 1C). Another demonstration of the need to account for variability between patients is shown by examining the distribution of P-values from paired and unpaired t-tests for a two-group comparison (Fig. 1D). In the paired case, which considers the difference between samples of the same individual, the resultant peak on the left side of the distribution indicates that more genes with significant P-values were identified than expected from a random data set. In contrast, the unpaired analysis ignores the sample pairing and results in a distribution showing no clear evidence that genes appearing to have significant P-values from such a study design would be true positives. Based on these analyses, paired t-tests directly contrasting the t(12;14) UL and the non-t(12;14) UL from each individual were chosen to determine t(12;14)-associated genes. This resulted in a list of genes ordered by their genome-wide significance levels corrected for multiple testing by the false discovery rate (Q-value) (33). Of the 100 most significant t(12;14) UL-specific genes, those with decreased expression are reported in Table 3 and those with increased expression in Table 4. A more extensive data set of 300 genes is provided as Supplementary Material, Table S1.
Table 3.
Genes down-regulated in t(12;14) UL compared with non-t(12;14) UL
| Numbera | Probe set | Ref. Seq. | Gene symbol | Gene title | Fold change | P-value | Q-value | Chromosome |
|---|---|---|---|---|---|---|---|---|
| 2 | 225619_at | NM_001040153 | SLAIN1 | SLAIN motif family, member 1 | −3.1 | 2.30E − 05 | 0.25 | 13q22.3 |
| 4 | 238018_at | NM_001002919 | FAM150B | Family with sequence similarity 150, member B | −4.2 | 0.00015 | 0.43 | 2p25.3 |
| 8 | 219290_x_at | NM_014395 | DAPP1 | Dual adaptor of phosphotyrosine and 3-phosphoinositides | −3.6 | 0.00024 | 0.43 | 4q23 |
| 10 | 222549_at | NM_021101 | CLDN1 | Claudin 1 | −5.5 | 0.00027 | 0.43 | 3q28 |
| 13 | 241835_at | —b | — | CDNA clone IMAGE:4822225 | −2.1 | 0.00036 | 0.43 | 1p36.13 |
| 20 | 211276_at | NM_080390 | TCEAL2 | Transcription elongation factor A (SII)-like 2 | −4.9 | 0.00039 | 0.43 | Xq22.1 |
| 34 | 229515_at | NM_002583 | PAWR | PRKC, apoptosis, WT1, regulator | −1.8 | 0.00086 | 0.5 | 12q21.2 |
| 36 | 239381_at | NM_005046 | KLK7 | Kallikrein-related peptidase 7 | −2.4 | 0.00092 | 0.5 | 19q13.33 |
| 38 | 204485_s_at | NM_005486 | TOM1L1 | Target of myb1 (chicken)-like 1 | −2 | 0.001 | 0.5 | 17q22 |
| 44 | 204591_at | NM_006614 | CHL1 | Cell adhesion molecule with homology to L1CAM (close homolog of L1) | −3.2 | 0.0011 | 0.5 | 3p26.3 |
| 45 | 230353_at | — | LOC284112 | Hypothetical protein LOC284112 | −2.5 | 0.0011 | 0.5 | 17p13.2 |
| 51 | 213905_x_at | NM_001711 | BGN | Biglycan | −1.8 | 0.0013 | 0.5 | Xq28 |
| 57 | 226231_at | — | — | Transcribed locus | −3 | 0.0013 | 0.5 | 20q13.12//12q21.2 |
| 61 | 226863_at | NM_001077710 | FAM110C | Family with sequence similarity 110, member C | −2.4 | 0.0014 | 0.5 | 2p25.3 |
| 64 | 219737_s_at | NM_020403 | PCDH9 | Protocadherin 9 | −2.8 | 0.0016 | 0.52 | 13q21.32 |
| 77 | 228155_at | NM_032333 | C10orf58 | Chromosome 10 open reading frame 58 | −1.8 | 0.002 | 0.52 | 10q23.1 |
| 88 | 239153_at | — | FLJ41747 | Hypothetical gene supported by AK123741 | −4.7 | 0.0024 | 0.52 | 12q13.13 |
| 90 | 217428_s_at | NM_000493 | COL10A1 | Collagen, type X, alpha 1(Schmid metaphyseal chondrodysplasia) | −2.9 | 0.0025 | 0.52 | 6q22.1 |
| 94 | 222858_s_at | NM_014395 | DAPP1 | Dual adaptor of phosphotyrosine and 3-phosphoinositides | −3.7 | 0.0026 | 0.52 | 4q23 |
| 97 | 229849_at | — | — | Transcribed locus | −2.1 | 0.0028 | 0.52 | 7p15.1 |
aGenes are those in the top 100 t(12;14) UL-specific list (a more extensive list can be found as Supplementary Material).
bDash indicates unknown.
Table 4.
Genes up-regulated in t(12;14) UL compared with non-t(12;14) UL
| Numbera | Probe set | Ref. Seq. | Gene symbol | Gene title | Fold change | P-value | Q-value | Chromosome |
|---|---|---|---|---|---|---|---|---|
| 1 | 220037_s_at | NM_006691 | LYVE1 | Lymphatic vessel endothelial hyaluronan receptor 1 | 3.2 | 3.70E − 06 | 0.082 | 11p15.4 |
| 3 | 214767_s_at | NM_144617 | HSPB6 | Heat shock protein, α-crystallin-related, B6 | 3.2 | 3.40E − 05 | 0.25 | 19q13.12 |
| 5 | 208025_s_at | NM_003483 | HMGA2 | High mobility group AT-hook 2 | 23 | 0.00017 | 0.43 | 12q14.3 |
| 6 | 211792_s_at | NM_001262 | CDKN2C | Cyclin-dependent kinase inhibitor 2C (p18, inhibits CDK4) | 4.4 | 2.00E − 04 | 0.43 | 1p33 |
| 7 | 240815_at | —b | — | Transcribed locus | 2.5 | 0.00024 | 0.43 | 7q21.11 |
| 9 | 224438_at | — | — | — | 3.4 | 0.00026 | 0.43 | 19q13.11 |
| 11 | 225954_s_at | NM_177401 | MIDN | Midnolin | 1.7 | 0.00035 | 0.43 | 19p13.3 |
| 12 | 221288_at | NM_005295 | GPR22 | G protein-coupled receptor 22 | 7.6 | 0.00036 | 0.43 | 7q22.3 |
| 14 | 237696_at | — | — | Transcribed locus | 2.1 | 0.00036 | 0.43 | 4q12 |
| 15 | 231259_s_at | — | — | Transcribed locus | 2 | 0.00036 | 0.43 | 12p13.32 |
| 16 | 243041_s_at | — | — | Transcribed locus | 2.1 | 0.00037 | 0.43 | 3p24.1 |
| 17 | 212384_at | NM_004640 | BAT1 | HLA-B-associated transcript 1 | 2 | 0.00038 | 0.43 | 6p21.33 |
| 18 | 239999_at | NM_001005732 | C21orf34 | Chromosome 21 open reading frame 34 | 1.7 | 0.00039 | 0.43 | 21q21.1 |
| 19 | 208321_s_at | NM_001033677 | CABP1 | Calcium-binding protein 1 | 2.9 | 0.00039 | 0.43 | 12q24.31 |
| 21 | 225128_at | NM_153705 | KDELC2 | KDEL (Lys-Asp-Glu-Leu) containing 2 | 1.7 | 0.00043 | 0.44 | 11q22.3 |
| 22 | 204035_at | NM_003469 | SCG2 | Secretogranin II (chromogranin C) | 4.7 | 0.00046 | 0.44 | 2q36.1 |
| 23 | 214989_x_at | — | — | CDNA FLJ11875 fis, clone HEMBA1007078 | 2.1 | 0.00047 | 0.44 | 12p12.3 |
| 24 | 205381_at | NM_001031692 | LRRC17 | Leucine-rich repeat containing 17 | 1.9 | 0.00049 | 0.44 | 7q22.1 |
| 25 | 1553179_at | NM_133638 | ADAMTS19 | ADAM metallopeptidase with thrombospondin type 1 motif, 19 | 2.5 | 0.00055 | 0.45 | 5q23.3 |
| 26 | 241509_at | — | — | — | 2.7 | 0.00056 | 0.45 | 12p12.3 |
| 27 | 230577_at | — | — | Transcribed locus | 6.7 | 0.00056 | 0.45 | 10q21.1 |
| 28 | 210202_s_at | NM_004305 | BIN1 | Bridging integrator 1 | 1.9 | 0.00066 | 0.5 | 2q14.3 |
| 29 | 1555250_a_at | NM_014912 | CPEB3 | Cytoplasmic polyadenylation element-binding protein 3 | 2.3 | 0.00067 | 0.5 | 10q23.32 |
| 30 | 238546_at | NM_001112800 | SLC8A1 | Solute carrier family 8 (sodium/calcium exchanger), member 1 | 1.9 | 0.00076 | 0.5 | 2p22.1 |
| 31 | 226304_at | NM_144617 | HSPB6 | Heat shock protein, α-crystallin-related, B6 | 2.5 | 0.00082 | 0.5 | 19q13.12 |
| 32 | 210230_at | — | — | CDNA: FLJ23438 fis, clone HRC13275 | 2.3 | 0.00084 | 0.5 | 17p13.3 |
| 33 | 207133_x_at | NM_001102406 | ALPK1 | α-Kinase 1 | 3.2 | 0.00084 | 0.5 | 4q25 |
| 35 | 243428_at | NR_002728 | KCNQ1OT1 | KCNQ1 overlapping transcript 1 (non-protein coding) | 2.5 | 0.00091 | 0.5 | 11p15.5 |
| 37 | 226407_at | — | — | CDNA FLJ30519 fis, clone BRAWH2000859 | 2.4 | 0.00094 | 0.5 | 13q14.12 |
| 39 | 239910_at | NM_001031850 | PSG6 | Pregnancy specific β-1-glycoprotein 6 | 1.6 | 0.001 | 0.5 | 19q13.31 |
| 40 | 244614_at | NM_001007565 | TFG | TRK-fused gene | 2.2 | 0.0011 | 0.5 | 3q12.2 |
| 41 | 1554504_at | NM_005467 | NAALAD2 | N-acetylated α-linked acidic dipeptidase 2 | 2.5 | 0.0011 | 0.5 | 11q14.3 |
| 42 | 205677_s_at | NR_002605 | DLEU1 | Deleted in lymphocytic leukemia, 1 | 1.9 | 0.0011 | 0.5 | 13q14.3 |
| 43 | 200952_s_at | NM_001759 | CCND2 | Cyclin D2 | 3 | 0.0011 | 0.5 | 12p13.32 |
| 46 | 240245_at | — | — | — | 2.2 | 0.0012 | 0.5 | 3p24.1 |
| 47 | 1556820_a_at | NR_002612 | DLEU2 | Deleted in lymphocytic leukemia, 2 | 1.7 | 0.0012 | 0.5 | 13q14.3 |
| 48 | 243874_at | NM_005578 | LPP | LIM domain containing preferred translocation partner in lipoma | 1.9 | 0.0012 | 0.5 | 3q28 |
| 49 | 237521_x_at | — | — | Transcribed locus | 1.7 | 0.0012 | 0.5 | 11q23.3 |
| 50 | 227192_at | NM_145239 | PRRT2 | Proline-rich transmembrane protein 2 | 1.8 | 0.0012 | 0.5 | 16p11.2 |
| 52 | 241789_at | — | — | CDNA FLJ36544 fis, clone TRACH2006378 | 1.9 | 0.0013 | 0.5 | 3p24.1 |
| 53 | 208712_at | NM_053056 | CCND1 | cyclin D1 | 2.5 | 0.0013 | 0.5 | 11q13.2 |
| 54 | 202921_s_at | NM_001148 | ANK2 | Ankyrin 2, neuronal | 2.4 | 0.0013 | 0.5 | 4q26 |
| 55 | 235133_at | — | — | Homo sapiens, clone IMAGE:5787583, mRNA | 1.8 | 0.0013 | 0.5 | 6q25.3 |
| 56 | 229245_at | NM_014935 | PLEKHA6 | Pleckstrin homology domain containing, family A member 6 | 2 | 0.0013 | 0.5 | 1q32.1 |
| 58 | 1566163_at | — | — | Transcribed locus | 1.9 | 0.0013 | 0.5 | 15q14 |
| 59 | 208711_s_at | NM_053056 | CCND1 | Cyclin D1 | 3.3 | 0.0014 | 0.5 | 11q13.2 |
| 60 | 213367_at | NR_015357 | LOC791120 | Hypothetical LOC791120 | 1.6 | 0.0014 | 0.5 | 7q36.1 |
| 62 | 223963_s_at | NM_001007225 | IGF2BP2 | Insulin-like growth factor 2 mRNA-binding protein 2 | 2.6 | 0.0014 | 0.5 | 3q27.2 |
| 63 | 232405_at | — | — | CDNA: FLJ22832 fis, clone KAIA4195 | 2.1 | 0.0014 | 0.5 | 4q26 |
| 65 | 242565_x_at | NM_001006114 | C21orf57 | Chromosome 21 open reading frame 57 | 1.6 | 0.0016 | 0.52 | 21q22.3 |
| 66 | 1567224_at | NM_003483 | HMGA2 | High mobility group AT-hook 2 | 13 | 0.0017 | 0.52 | 12q14.3 |
| 67 | 227985_at | — | — | — | 2.2 | 0.0017 | 0.52 | 7p15.3 |
| 68 | 219025_at | NM_020404 | CD248 | CD248 molecule, endosialin | 1.6 | 0.0018 | 0.52 | 11q13.1 |
| 69 | 239320_at | NM_001080457 | LRRC4B | Leucine-rich repeat containing 4B | 2 | 0.0019 | 0.52 | 19q13.33 |
| 70 | 200953_s_at | NM_001759 | CCND2 | Cyclin D2 | 2.6 | 0.0019 | 0.52 | 12p13.32 |
| 71 | 1561657_at | — | — | Full-length insert cDNA clone YZ55H04 | 1.9 | 0.0019 | 0.52 | 11q23.1 |
| 72 | 242239_at | — | — | CDNA clone IMAGE:5314281 | 1.7 | 0.002 | 0.52 | 10p12.33 |
| 73 | 1562434_at | NM_001080419 | UNK | Unkempt homolog (Drosophila) | 2 | 0.002 | 0.52 | 17q25.1 |
| 74 | 220266_s_at | NM_004235 | KLF4 | Kruppel-like factor 4 (gut) | 1.6 | 0.002 | 0.52 | 9q31.2 |
| 75 | 239281_at | — | — | Homo sapiens, clone IMAGE:5787583, mRNA | 1.8 | 0.002 | 0.52 | 6q25.3 |
| 76 | 201282_at | NM_001003941 | OGDH | Oxoglutarate (α-ketoglutarate) dehydrogenase (lipoamide) | 2.1 | 0.002 | 0.52 | 7p13 |
| 78 | 224566_at | NR_002802 | TncRNA | Trophoblast-derived non-coding RNA | 2.1 | 0.0021 | 0.52 | 11q13.1 |
| 79 | 227835_at | XM_001722051 | LOC100132181 | Hypothetical protein LOC100132181 | 1.7 | 0.0021 | 0.52 | 17p13.3//7p22.3 |
| 80 | 202672_s_at | NM_001030287 | ATF3 | Activating transcription factor 3 | 2.1 | 0.0022 | 0.52 | 1q32.3 |
| 81 | 238447_at | NM_001003792 | RBMS3 | RNA-binding motif, single-stranded interacting protein | 1.8 | 0.0022 | 0.52 | 3p24.1 |
| 82 | 219370_at | NM_019845 | RPRM | Reprimo, TP53-dependent G2 arrest mediator candidate | 1.7 | 0.0023 | 0.52 | 2q23.3 |
| 83 | 203186_s_at | NM_002961 | S100A4 | S100 calcium-binding protein A4 | 3.2 | 0.0023 | 0.52 | 1q21.3 |
| 84 | 219089_s_at | NM_024327 | ZNF576 | Zinc finger protein 576 | 1.5 | 0.0023 | 0.52 | 19q13.31 |
| 85 | 241345_at | NM_005455 | ZRANB2 | Zinc finger, RAN-binding domain containing 2 | 2.1 | 0.0023 | 0.52 | 1p31.1 |
| 86 | 215303_at | NM_004734 | DCLK1 | Doublecortin-like kinase 1 | 1.6 | 0.0023 | 0.52 | 13q13.3 |
| 87 | 1559891_at | NM_003483 | HMGA2 | High-mobility group AT-hook 2 | 3.4 | 0.0024 | 0.52 | 12q14.3 |
| 89 | 200951_s_at | NM_001759 | CCND2 | cyclin D2 | 2.7 | 0.0025 | 0.52 | 12p13.32 |
| 91 | 240452_at | NM_002094 | GSPT1 | G1 to S phase transition 1 | 1.7 | 0.0025 | 0.52 | 16p13.13 |
| 92 | 219059_s_at | NM_006691 | LYVE1 | Lymphatic vessel endothelial hyaluronan receptor 1 | 2.1 | 0.0026 | 0.52 | 11p15.4 |
| 93 | 241817_at | NM_198562 | C3orf62 | Chromosome 3 open reading frame 62 | 1.7 | 0.0026 | 0.52 | 3p21.31 |
| 95 | 206738_at | NM_001646 | APOC4 | Apolipoprotein C-IV | 1.6 | 0.0027 | 0.52 | 19q13.32 |
| 96 | 241752_at | NM_001112800 | SLC8A1 | Solute carrier family 8 (sodium/calcium exchanger), member 1 | 2 | 0.0027 | 0.52 | 2p22.1 |
| 98 | 228632_at | — | — | CDNA FLJ37243 fis, clone BRAMY2004387 | 2.4 | 0.0028 | 0.52 | 14q32.31 |
| 99 | 225660_at | NM_020796 | SEMA6A | Sema domain, transmembrane domain (TM), and cytoplasmic domain, (semaphorin) 6A | 1.9 | 0.0028 | 0.52 | 5q23.1 |
| 100 | 214657_s_at | NR_002802 | TncRNA | Trophoblast-derived non-coding RNA | 2.3 | 0.0028 | 0.52 | 11q13.1 |
aGenes are those in the top 100 t(12;14) UL-specific list (a more extensive list can be found as Supplementary Material).
bDash indicates unknown.
Identification of t(12;14)-specific UL genes weighted for percent mosaicism of t(12;14) cells
Karyotypically abnormal UL are frequently found as mosaic tumors that include chromosomally normal cells. In contrast to previously published expression profiling studies, the impact of this biology was integrated by weighting each sample pair [t(12;14) UL and non-t(12;14) UL from the same uterus] for percent t(12;14) mosaicism of the tumor in a paired differential expression analysis: the higher the percentage of t(12;14) cells present, the more heavily weighted was that sample. The 50 most significant genes based on Q-value in this modified t(12;14) UL-specific gene list are given in Table 5. A more expansive list of 300 genes is also presented (Supplementary Material, Table S2). The top eight genes from this mosaicism-weighted list, which have significant Q-values of ≤0.10, are illustrated by scatter plots (Fig. 2A) with details tabulated (Fig. 2B). This demonstration of a relationship between expression and percent mosaicism suggests that weighting the samples for mosaicism level is necessary to compensate for background noise caused by the karyotypically normal cells in order to identify those genes specific to the t(12;14). The validity of this approach is supported by the movement of HMGA2, which is known to be highly up-regulated in t(12;14) UL, to the first position on the mosaicism-weighted list from its fifth position on the non-weighted list.
Table 5.
Genes up- or down-regulated in t(12;14) UL compared with non-t(12;14) UL weighted for percent mosaicism
| Numbera | Non-weightedb | Probe set | Ref. Seq. | Gene symbol | Gene title | Fold changec | P-value | Q-value | Chromosome |
|---|---|---|---|---|---|---|---|---|---|
| 1 | 5 | 208025_s_at | NM_003483 | HMGA2 | High mobility group AT-hook 2 | 49 | 2.90E − 06 | 0.035 | 12q14.3 |
| 2 | 9 | 224438_at | —d | — | — | 4 | 4.10E − 06 | 0.035 | 19q13.11 |
| 3 | 20 | 211276_at | NM_080390 | TCEAL2 | Transcription elongation factor A (SII)-like 2 | −7.6 | 5.70E − 06 | 0.035 | Xq22.1 |
| 4 | 10 | 222549_at | NM_021101 | CLDN1 | Claudin 1 | −7.5 | 6.20E − 06 | 0.035 | 3q28 |
| 5 | 4 | 238018_at | NM_001002919 | FAM150B | Family with sequence similarity 150, member B | −5.5 | 1.10E − 05 | 0.05 | 2p25.3 |
| 6 | 1 | 220037_s_at | NM_006691 | LYVE1 | Lymphatic vessel endothelial hyaluronan receptor 1 | 3.1 | 1.50E − 05 | 0.056 | 11p15.4 |
| 7 | 12 | 221288_at | NM_005295 | GPR22 | G protein-coupled receptor 22 | 10 | 2.30E − 05 | 0.073 | 7q22.3 |
| 8 | 59 | 208711_s_at | NM_053056 | CCND1 | Cyclin D1 | 4 | 3.40E − 05 | 0.095 | 11q13.2 |
| 9 | 81 | 238447_at | NM_001003792 | RBMS3 | RNA-binding motif, single-stranded interacting protein | 2.1 | 4.60E − 05 | 0.11 | 3p24.1 |
| 10 | 2 | 225619_at | NM_001040153 | SLAIN1 | SLAIN motif family, member 1 | −3.1 | 5.30E − 05 | 0.12 | 13q22.3 |
| 11 | 87 | 1559891_at | NM_003483 | HMGA2 | High mobility group AT-hook 2 | 4.8 | 5.90E − 05 | 0.12 | 12q14.3 |
| 12 | 53 | 208712_at | NM_053056 | CCND1 | Cyclin D1 | 3.2 | 7.30E − 05 | 0.12 | 11q13.2 |
| 13 | 45 | 230353_at | — | LOC284112 | Hypothetical protein LOC284112 | −3 | 7.70E − 05 | 0.12 | 17p13.2 |
| 14 | 89 | 200951_s_at | NM_001759 | CCND2 | cyclin D2 | 3.3 | 7.80E − 05 | 0.12 | 12p13.32 |
| 15 | 3 | 214767_s_at | NM_144617 | HSPB6 | Heat shock protein, α-crystallin-related, B6 | 3.1 | 7.80E − 05 | 0.12 | 19q13.12 |
| 16 | 150 | 204359_at | NM_013231 | FLRT2 | Fibronectin leucine-rich transmembrane protein 2 | −2.9 | 1.00E − 04 | 0.12 | 14q31.3 |
| 17 | 43 | 204359_at | NM_001759 | CCND2 | Cyclin D2 | 3.2 | 0.00011 | 0.12 | 12p13.32 |
| 18 | 32 | 210230_at | — | — | CDNA: FLJ23438 fis, clone HRC13275 | 2.8 | 0.00011 | 0.12 | 17p13.3 |
| 19 | 6 | 211792_s_at | NM_001262 | CDKN2C | Cyclin-dependent kinase inhibitor 2C (p18, inhibits CDK4) | 5 | 0.00011 | 0.12 | 1p33 |
| 20 | 521 | 218182_s_at | NM_021101 | CLDN1 | Claudin 1 | −6.4 | 0.00011 | 0.12 | 3q28 |
| 21 | 8 | 219290_x_at | NM_014395 | DAPP1 | Dual adaptor of phosphotyrosine and 3-phosphoinositides | −4 | 0.00012 | 0.12 | 4q23 |
| 22 | 58 | 1566163_at | — | — | Transcribed locus | 2 | 0.00013 | 0.13 | 15q14 |
| 23 | 52 | 241789_at | — | — | CDNA FLJ36544 fis, clone TRACH2006378 | 1.9 | 0.00017 | 0.17 | 3p24.1 |
| 24 | 456 | 222940_at | NM_005420 | SULT1E1 | Sulfotransferase family 1E, estrogen-preferring, member 1 | −4.2 | 0.00019 | 0.17 | 4q13.3 |
| 25 | 18 | 239999_at | NM_001005732 | C21orf34 | Chromosome 21 open reading frame 34 | 1.7 | 2.00E − 04 | 0.17 | 21q21.1 |
| 26 | 15 | 231259_s_at | — | — | Transcribed locus | 2 | 2.00E − 04 | 0.17 | 12p13.32 |
| 27 | 64 | 219737_s_at | NM_020403 | PCDH9 | Protocadherin 9 | −3.3 | 0.00022 | 0.18 | 13q21.32 |
| 28 | 57 | 226231_at | — | — | Transcribed locus | −3.3 | 0.00027 | 0.19 | 20q13.12//12q21.2 |
| 29 | 46 | 240245_at | — | — | — | 2.3 | 0.00032 | 0.19 | 3p24.1 |
| 30 | 71 | 1561657_at | — | — | Full-length insert cDNA clone YZ55H04 | 2.2 | 0.00034 | 0.19 | 11q23.1 |
| 31 | 394 | 243808_at | — | — | Transcribed locus | 2.4 | 0.00035 | 0.19 | 7q21.2 |
| 32 | 14 | 237696_at | — | — | Transcribed locus | 2 | 0.00035 | 0.19 | 4q12 |
| 33 | 7 | 240815_at | — | — | Transcribed locus | 2.5 | 0.00035 | 0.19 | 7q21.11 |
| 34 | 22 | 204035_at | NM_003469 | SCG2 | Secretogranin II (chromogranin C) | 4.8 | 0.00035 | 0.19 | 2q36.1 |
| 35 | 16 | 243041_s_at | — | — | Transcribed locus | 2.2 | 0.00036 | 0.19 | 3p24.1 |
| 36 | 34 | 229515_at | NM_002583 | PAWR | PRKC, apoptosis, WT1, regulator | −1.9 | 0.00037 | 0.19 | 12q21.2 |
| 37 | 67 | 227985_at | — | — | — | 2.3 | 0.00037 | 0.19 | 7p15.3 |
| 38 | 70 | 200953_s_at | NM_001759 | CCND2 | cyclin D2 | 3.2 | 0.00037 | 0.19 | 12p13.32 |
| 39 | 21 | 225128_at | NM_153705 | KDELC2 | KDEL (Lys-Asp-Glu-Leu) containing 2 | 1.6 | 0.00038 | 0.19 | 11q22.3 |
| 40 | 61 | 226863_at | NM_001077710 | FAM110C | Family with sequence similarity 110, member C | −2.5 | 0.00038 | 0.19 | 2p25.3 |
| 41 | 949 | 205347_s_at | NM_021992 | TMSL8 | Thymosin-like 8 /// thymosin β15b | −2.2 | 0.00038 | 0.19 | Xq22.1 |
| 42 | 228 | 1556069_s_at | NM_022462 | HIF3A | Hypoxia-inducible factor 3, α-subunit | 2.4 | 0.00039 | 0.19 | 19q13.32 |
| 43 | 200 | 218847_at | NM_001007225 | IGF2BP2 | Insulin-like growth factor 2 mRNA-binding protein 2 | 6.2 | 0.00039 | 0.19 | 3q27.2 |
| 44 | 77 | 228155_at | NM_032333 | C10orf58 | Chromosome 10 open reading frame 58 | −1.9 | 4.00E − 04 | 0.19 | 10q23.1 |
| 45 | 31 | 226304_at | NM_144617 | HSPB6 | Heat shock protein, α-crystallin-related, B6 | 2.6 | 4.00E − 04 | 0.19 | 19q13.12 |
| 46 | 48 | 243874_at | NM_005578 | LPP | LIM domain containing preferred translocation partner in lipoma | 2 | 0.00041 | 0.19 | 3q28 |
| 47 | 252 | 240813_at | — | — | Transcribed locus | 2.1 | 0.00041 | 0.19 | 11q23.1 |
| 48 | 24 | 205381_at | NM_001031692 | LRRC17 | Leucine-rich repeat containing 17 | 2 | 0.00041 | 0.19 | 7q22.1 |
| 49 | 11 | 225954_s_at | NM_177401 | MIDN | Midnolin | 1.7 | 0.00042 | 0.19 | 19p13.3 |
| 50 | 517 | 33767_at | NM_021076 | NEFH | neurofilament, heavy polypeptide 200 kDa | −2.5 | 0.00043 | 0.19 | 22q12.2 |
aGenes are those in the top 50 t(12;14) UL-specific list that have been weighted for the percent mosaicism (a more extensive list can be found as Supplementary Material).
bNumber on non-weighted t(12;14) UL-specific gene list.
cExpression fold change between t(12;14) and non-t(12;14) UL weighted for percent mosaicism.
dDash indicates unknown.
Figure 2.

Weighting the microarray data for the level of t(12;14) cell mosaicism in each UL results in identification of eight significant genes with a Q-value of ≤0.10. (A) Scatter plots show the relationship between the percent of t(12;14) cells and the log2 fold change ratio of gene expression in t(12;14) UL relative to the non-t(12;14) UL in each of the nine women. (B) Details about the eight genes, which include HMGA2 and CCND1.
Quantitative polymerase chain reaction and immunohistochemistry confirmation of elevated HMGA2 expression
In the nine cases investigated by microarray expression analysis, quantitative polymerase chain reaction (Q-PCR) confirmed that t(12;14) UL have significantly increased HMGA2 mRNA compared with matched myometrium using a Wilcoxon signed-rank test (P = 0.0039). In addition, HMGA2 mRNA in t(12;14) UL relative to matched myometrium was generally equivalent among tumors with >50% t(12;14) cells, suggesting a potential saturation effect in gene expression (Supplementary Material, Fig. S1). Elevated HMGA2 protein was also detected in t(12;14) UL relative to matched non-t(12;14) UL in both cases for which immunohistochemistry of paraffin sections was performed (an increase of 2.25-fold in Case 4 and of 1.77-fold in Case 5).
Q-PCR confirmation of elevated CCND1 and CCND2 RNA expression and immunohistochemistry confirmation of increased CCND1 protein expression
Cases 1, 4, 6, 8 and 9 for which additional RNA was available were evaluated by Q-PCR for expression of CCND1 (cyclin D1). The 2.3-fold increase in RNA expression of CCND1 in t(12;14) UL relative to matched non-t(12;14) tumors after normalization to the housekeeping gene GAPDH correlated with the 2.9-fold elevation in expression detected by microarray after averaging the fold change of all probe sets in CCND1. Similarly examined was CCND2 (cyclin D2), which showed a 1.8-fold expression increase by Q-PCR in t(12;14) UL, consistent with the finding by microarray of a 2.1-fold higher average expression across all probe sets. Evaluation of CCND1 protein by immunohistochemistry with manual scoring confirmed increased expression in t(12;14) UL relative to matched non-t(12;14) UL (an elevation of 12.50-fold in Case 4 and of 3.84-fold in Case 5); both cases were previously shown in a semi-automated analysis to have a similar HMGA2 protein distribution pattern.
Functional significance of t(12;14)-specific UL genes
To extract biological insight from the transcriptional profile of t(12;14) UL, the 374 probe sets with P ≤ 0.005 from the t(12;14) mosaicism-weighted gene list were investigated with Ingenuity Pathways Analysis (IPA). IPA is a web-supported tool based on a database of functional relationships between genes manually curated from scientific publications. There were 13 highly significant networks of dependencies generated, each involving 7–25 genes from the t(12;14) UL-specific list. The two most significant networks (Fig. 3A and B) are principally associated with cell proliferation and development. The other networks involving 7–20 t(12;14) UL-specific genes are generally associated with cell cycle, growth and signaling, cancer, cell and tissue morphology, nucleic acid and lipid metabolism, developmental and other disorders, and normal development pathways of multiple different systems. Among well-characterized canonical pathways, cell cycle G1/S checkpoint regulation was the most significant (P = 0.0042), involving increased expression of four t(12;14) UL-specific genes: CCND1, CCND2, CCND3 and CDK6.
Figure 3.

The use of IPA to identify highly significant networks of functional dependencies of genes represented by the 374 probe sets with a P-value of ≤0.005 from the t(12;14) UL-specific gene list weighted for percent of t(12;14) cells. The functions of the two networks of highest significance are involved in (A) cell development, cell proliferation and respiratory system development and function [score = 46, genes from t(12;14) list = 25], which includes HMGA2, and (B) cellular assembly and organization, and embryonic and organ development [score = 36, genes from t(12;14) list = 21]. Each node in the network corresponds to a gene and each arc to a published article reporting a functional relationship between those two linked genes. Pink shading indicates up-regulated gene expression, green shading down-regulated gene expression, solid lines a direct relationship between connected genes and dotted lines an indirect relationship between linked genes.
Gene Set Enrichment Analysis (GSEA) was also employed which uses a continuum of differential expression scores for all genes rather than dividing the genes into significant versus non-significant categories (34). Application of GSEA to the mosaicism-weighted t(12;14) UL-specific gene list identified significant enrichment (a false discovery rate of <0.2) for eight gene sets including two associated with mitotic cell cycle (G1/S checkpoint and interphase), which is consistent with the IPA (Fig. 4). The six other significant gene sets were primarily associated with GTPase or kinase activity, possibly indicating additional molecular pathways differentially activated between t(12;14) and non-t(12;14) UL.
Figure 4.

GSEA found eight molecular functions, including two involving the cell cycle, significantly enriched with genes which were differentially expressed between t(12;14) UL and non-t(12;14) UL based on a false discovery rate (FDR) of <0.2. Plots of these eight molecular functions show the enrichment score (y-axis) across the genes (x-axis) sorted in the order of differential expression (upper section, each panel). Vertical bars represent genes that belong to the functional set (middle section, each panel). The leading edge gene subset is provided as a list of gene symbols (bottom section, each panel). The peak value of the enrichment score is reported as ES and the normalized value as NES.
Menopause or medications creating a hypogonadal state do not appear to significantly alter the t(12;14) expression analysis
UL are hormonally responsive to the gonadal steroids estrogen and progesterone, and four of the nine women in this study were menopausal or on medications creating a hypogonadal state at the time of tumor collection (Table 2). Thus, an assessment was undertaken of whether the same genes are significantly changed when only the non-menopausal/non-medicated subset is examined. The mosaicism-weighted fold changes (log2 scale) between the whole data set (n = 9) and the non-menopausal/non-medicated subset (n = 5) showed a high Pearson's correlation (r = 0.875). Further, both in total and non-menopausal/non-medicated cases, the top variable probes corresponded to HMGA2 (Supplementary Material, Fig. S2). As anticipated, the results favor the premise that a paired comparison of a t(12;14) UL and a non-t(12;14) UL from each woman neutralizes environmental influences such as menopausal status from significantly affecting the gene expression analysis. In addition, application of GSEA to only the non-menopause data subset confirmed the importance of the mitotic G1/S checkpoint with a false discovery rate of 0.18.
Genetic heterogeneity among UL subgroups
After combining the t(12;14) UL expression data set with the previously published del(7q) UL data set (GEO accession GSE12814) (32), the top 1000 most variable genes were selected for an unsupervised hierarchical cluster analysis with adjustment for batch effect (Fig. 5) (35). The results substantiate the previous findings of the individual t(12;14) or del(7q) analyses where myometrium samples largely separated from the tumors while the tumors generally clustered by patient rather than by non-t(12;14)/non-del(7q) versus t(12;14)/del(7q) status. In addition, although there was not a distinct separation of t(12;14) and del(7q) tumors, the weighted t(12;14) UL- and the weighted del(7q) UL-specific gene lists were mutually exclusive (i.e., only three common genes were observed between the top 500 genes; P-value of exclusivity = 0.0071 using Fisher's exact test). These results indicate patient bias (constitutional genetics and/or environmental exposures) likely significantly interferes with identifying the transcriptional effects of the t(12;14) and del(7q) somatic changes, suggesting the necessity of matched sample analysis to remove this bias.
Figure 5.

Merging the microarray expression profiles of the t(12;14) and del(7q) data sets confirmed the need for paired analysis to control for patient-to-patient variability and demonstrated a potential underlying genetic predisposition to these karyotypic abnormalities based on the clustering pattern of their myometrial samples. A heatmap of an unsupervised hierarchical cluster analysis of the 1000 most variable genes between t(12;14) UL [T (translocation) followed by the case number], non-t(12;14) UL [N (non) following T and the case number] and myometrium [M following T and the case number] from each of the 9 women in the t(12;14) data set as well as del(7q) UL [D (deletion) followed by the case number], non-del(7q) UL [N following D and the case number] and myometrium [M following D and the case number] from each of 11 women in the del(7q) data set. Of note, one case is a mosaic t(12;14)/del(7q) UL which is denoted as D5/T3, D5N/T3N and D5M/T3M and is included in the combined analysis only once. Also, one case had a t(12;14) UL [designated T6] and a separate del(7q) UL [designated D10] within the same uterus, and therefore these tumors have in common a myometrium [designated D10M/T6M] and a non-t(12;14)/non-del(7q) sample [designated D10N/T6N] which are included in the combined analysis only once. As was previously observed in the individual analyses, a trend of myometrial separation from all UL tissues and of UL clustering based on patient rather than t(12;14) or del(7q) status was found. In addition, the myometrium samples generally clustered based on their associated tumor karyotypic abnormality.
Genetic heterogeneity among myometrial samples
The myometrium samples not only segregated from the tumors, but within the myometrium group, t(12;14) patients generally clustered separately from the del(7q) patients even after batch effect correction (Fig. 5). The ability to distinguish myometrium obtained from t(12;14) UL patients versus those with del(7q) UL was confirmed by the finding of 100% accuracy to call the tumor karyotypic abnormalities associated with each myometrium sample using a leave-one-out cross-validation test [n = 7 t(12;14) patients and n = 9 del(7q) patients]. Myometrium samples excluded from this analysis were from two patients with both a t(12;14) and a del(7q) tumor (samples D5M/T3M and D10M/T6M). Nine genes were identified using the k-NN (k-nearest neighbor) method that can distinguish the myometrium origin and are illustrated with a heatmap (Fig. 6).
Figure 6.
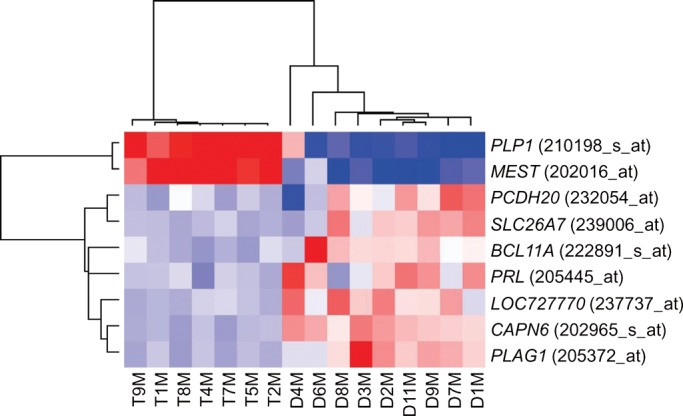
Nine genes distinguish the myometrial origin from t(12;14) UL or del(7q) UL patients. A heatmap showing the expression signature of these nine genes in the myometrium from each of seven women with t(12;14) UL and nine women with del(7q) UL. The myometrium from two patients were excluded due to the presence of both a t(12;14) and a del(7q) tumor (samples D5M/T3M and D10M/T6M).
DISCUSSION
Identification of recurrent primary chromosome abnormalities in UL suggests that these tumors arise through multiple genetic pathways. One major UL cytogenetic subgroup, t(12;14)(q14-15;q23-24), has the pathogenetic target HMGA2 that is involved in multiple mesenchymal solid tumors (36,37). The presence of t(12;14) in UL leads to elevated expression of HMGA2 (14,15). Real-time PCR and immunohistochemistry in the current investigation confirmed increased HMGA2 in t(12;14) UL relative to matched non-t(12;14) UL and myometrium. Elevated HMGA2 has also been noted in many malignant tumors (38).
In the present study, a molecular signature of t(12;14) UL was identified by directly comparing expression profiles of t(12;14) UL and non-t(12;14) UL removed concurrently from the same uterus in each of nine women. This approach is different from previously published expression studies which compare UL with normal myometrial tissue. Our data demonstrated that t(12;14) UL and non-t(12;14) UL clustered separately from myometrium, which suggests that expression profiling of myometrium does not help elucidate t(12;14) UL-specific genes. UL were also noted to generally cluster by patient rather than t(12;14) versus non-t(12;14) status, suggesting a need to control for patient variability caused by genetic and environmental factors such as menstrual cycle status. Therefore, a paired comparison of t(12;14) UL to non-t(12;14) UL to increase specificity was used to develop a molecular signature of the t(12;14) abnormality. In addition, data were further refined through weighting based on the percent of abnormal t(12;14) cells in each neoplasm to account for the mosaic nature of UL.
The need for a paired design is illustrated by the finding that menopause, the absence of steroid hormones which are a known environmental influence on UL growth, does not appear to significantly affect the t(12;14) gene list in this study. This was demonstrated by a significant correlation in gene expression between the non-menopausal case subset and the whole data set, including HMGA2 as the most highly expressed transcript in both groups.
To study further the genetic expression of t(12;14) UL, this data set including the myometrium was combined with that of a previously published 7q22 deletion cytogenetic subgroup (32), and an unsupervised hierarchical cluster analysis was performed. The tumors tended to cluster by patient rather than by the presence or absence of the cytogenetic abnormality. The t(12;14) UL were also not clearly distinguishable from the del(7q) UL. This suggests that patient variability due to constitutional genetics and/or environment has a predominant effect, and therefore, a paired analysis is likely required to determine t(12;14) UL-specific genes. This patient variability effect is so strong that in a single case with independent del(7q) and t(12;14) UL [Case 6 in Table 1 and Case 10 in (32)], it was found that those tumors clustered together along with the non-del(7q)/non-t(12;14) UL from the same woman (D10, T6, D10N/T6N in Fig. 5). In addition, the single tumor that is a low-level mosaic for both del(7q) and t(12;14) [Case 3 in Table 1 and Case 5 in (32)] presented within the myometrium branch (D5/T3, D5N/T3N, D5M/T3M in Fig. 5), suggesting the genetic effects of both cytogenetic abnormalities are diluted by the mosaicism with each other and with normal cells.
A second result of this analysis was the finding that within the myometrium cluster, t(12;14) patients generally gathered separately from the del(7q) patients. Nine genes were identified that could predict whether a myometrium sample came from a woman with a t(12;14) UL versus a woman with a del(7q) UL. This suggests that there are different constitutional genetic predisposition alleles in women for these specific cytogenetic subgroups. Alternative potential mechanisms affecting myometrium expression can include a paracrine effect of UL with different cytogenetic abnormalities on adjacent myometrium or unappreciated microscopic UL in one or more of the myometrial samples. Precedent for general UL genetic predisposition was established by a genome-wide association study in which three loci were significantly associated with UL susceptibility (39). Further investigations are required to determine whether genetic predilection to UL formation in general is related to the potential constitutional predisposition to specific cytogenetic abnormalities in UL.
Among the nine genes that can differentiate between the myometrium of t(12;14) and del(7q) patients, PLAG1 (pleomorphic adenoma gene 1) is significant as this proto-oncogene is ectopically overexpressed through recurrent translocations or amplifications in multiple neoplasms. Pleomorphic adenoma of the salivary gland is one such tumor; this benign growth is of particular interest as a subset harbor HMGA2 rearrangement similar to the t(12;14) subgroup of UL (40). Further, like HMGA2, the expression of PLAG1 is usually restricted to fetal development (41). PLAG1 has also been shown to drive cell proliferation and oncogenic transformation, likely through its known mitogenic target genes such as IGF2 (42,43). In fact, PLAG1 increases proliferation by inducing G1/S transition in hematopoietic progenitors in cooperation with CBFB/MYH11 fusion (44) and its disruption in mice results in growth retardation (41). These roles are interesting to consider in relation to PLAG1 expression in the myometrium, and the question remains whether there is any relationship between PLAG1 and HMGA2 in pleomorphic adenomas or other tumors such as UL.
Another gene of interest in the myometrial differential data set, PRL (prolactin), induces phosphorylation of mitogen-activated protein (MAP) kinase and DNA synthesis in UL-derived smooth muscle cells (45). This suggests that PRL promotes UL cell proliferation via the MAP kinase cascade. Myometrial and UL cells were further shown to express the PRL receptor and to have a significant decrease in cell number in vitro after treatment with anti-PRL antibody (46). Therefore, even a modest overproduction of the stimulatory growth factor PRL in the myometrium could result through an autocrine mechanism in sustained, self-stimulated proliferation, predisposing to tumor formation.
Other genes among the nine that are of potential relevance include MEST, CAPN6 and BCL11A due to their known neoplastic associations. MEST (mesoderm-specific transcript) is overexpressed in UL relative to myometrium across multiple expression array studies (47) and is also involved in proliferation as mice lacking MEST demonstrate growth retardation (48). CAPN6 (calpain 6) is also overexpressed in UL relative to myometrium (49) and supports tumorigenesis through apoptosis inhibition and angiogenesis promotion (50). BCL11A (B-cell lymphoma/leukemia 11A) codes for a proto-oncogene transcription factor which is rearranged or amplified in a variety of B-cell malignancies (51).
The myometrium of the del(7q) and t(12;14) UL cytogenetic subgroups not only differ, but in contrast to the expression profile of del(7q) (32), the mosaicism-weighted t(12;14) UL-specific gene list suggests that cell cycle regulation is of primary importance. Application of IPA to the significant probe sets (P ≤ 0.005) indicates that the top networks are principally associated with cell proliferation and development while the most-related canonical pathway is G1/S checkpoint regulation. Consistently, application of another functional analysis method, GSEA, showed significant enrichment for mitotic cell cycle function, particularly G1/S transition and interphase. Interestingly, when GSEA analysis was applied to only the subset of women who were non-menopausal, the significance of the mitotic G1/S transition function remained.
During the G1 phase of the cell cycle, D-type cyclins accumulate in response to growth signals and activate their associated cyclin-dependent kinases (CDKs), promoting progression through the restriction point to achieve S phase commitment and mitogen independence. In t(12;14) UL, the genes significantly up-regulated include multiple D-type cyclins (CCND1, CCND2, CCND3) and a CDK (CDK6). Overexpression of CDK6 or CCND1 has been shown to shorten the G1 phase and accelerate the G1/S transition (52,53). In addition, increased CDK6 expression was observed in squamous cell carcinomas, gliomas and neuroblastomas while CCND1 expression is characteristically elevated in multiple primary human tumors and cell lines (54–57).
Additional support for a relationship between t(12;14) and the cell cycle is shown by the marked growth advantage of t(12;14) UL, which was found in a systematic study of all palpable UL from hysterectomy specimens to be significantly larger in size than those with either interstitial 7q22 deletions or normal karyotypes (11). This may be directly related to increased expression of HMGA2, which has been identified as a delayed early response gene in multiple cell types (58–61). Since delayed early response genes normally promote progression to S phase in response to growth factors, UL cells with up-regulation of HMGA2 due to t(12;14) may bypass the need for mitogen stimulation.
This connection between HMGA2 and the cell cycle is also shown by insertional mutagenesis of HMGA2 in mice which have significantly reduced body size as a result of widespread mesenchymal tissues growth restriction (21). A gene directly regulated by HMGA2 and known to have decreased expression in these pygmy mice is insulin-like growth factor II mRNA-binding protein 2 (62,63). In the current study, IMP2 (also known as IGF2BP2) is number 43 on the mosaicism-weighted t(12;14) UL-specific gene list with a significant 6.2-fold increase in expression relative to non-t(12;14) UL (P = 0.00039). IMP2 encodes a mRNA-binding protein involved in regulating post-transcriptional processes, including influencing the major fetal period growth factor IGF-II (64). IMP2 may therefore function as an effector through which HMGA2 contributes to growth in t(12;14) UL.
HMGA2 or other t(12;14)-associated genes may also potentially contribute to an injury-like response in UL as is known to occur during normal menstruation when increased uterine vasoconstrictive substances induce myometrial cell hypoxia (65). Decreased oxygen levels activate hypoxia-inducible factors (HIFs) which in turn induce transcription of genes involved in many functions including angiogenesis and cell survival (66). HIF1A is key in the initial adaptation of cells to an oxygen-poor environment, but recent data suggest that HIF3A takes over in maintaining long-term response to hypoxia (67). In the current study, HIF3A is a significant t(12;14) UL-specific gene, at number 24 with 2.4-fold increased expression (P = 0.00039) as well as being present four additional times in the top 437 probes with an overall average fold-change of 2.1 on the mosaicism-weighted gene list. IPA indicated HIF3A as a gene involved in the second most significant network. HIF3A may not only have a tumorigenic function but, as larger tumors are prone to hypoxia at their core and t(12;14) UL are known to generally be larger, t(12;14)-induced expression of HIF3A may allow UL with this translocation to remain viable during hypoxia-inducing rapid growth.
In conclusion, this study provides an expression profile of the t(12;14) cytogenetic subgroup of UL. The unique design employed to target t(12;14) UL-specific genes included a paired comparison to non-t(12;14) UL from the same women and weighting of the data for percent of t(12;14) cells to account for mosaicism with normal cells. This paired strategy was demonstrated to be required to remove the significant impact of patient variability. The resultant gene list with the known t(12;14)-associated gene HMGA2 as the most significant gene strongly implicates the importance in t(12;14) UL of the G1–S cell cycle checkpoint. By examining expression profiles of morphologic variants and recurrent cytogenetic subgroups of UL, it is becoming clear that UL is not a single disease. In fact, analysis of myometrium from t(12;14) and del(7q) UL cases suggests distinct constitutional genetic predisposition for these somatic changes. Recognizing this genetic heterogeneity and establishing genetic profiles of the different entities are taking the first steps toward understanding the implications of how genetic variability impacts disease occurrence, severity and recurrence, particularly as less invasive uterus-sparing procedures are becoming the standard of care.
MATERIALS AND METHODS
Clinical material
For each woman, the total number of tumors present were counted and tissue was obtained from the myometrium and a minimum of three UL (as in Cases 1–3) or up to five UL when available (as in Cases 4–9), selecting the tumor with the largest diameter first and others in a descending size order. All collected tumors were then screened for t(12;14)(q14-15;q23-24) and del(7)(q22q32) using GTG-banded karyotyping according to established protocols (9) or FISH. Selection of cases for further studies required the t(12;14) UL had matched myometrium and non-t(12;14) UL samples acquired and screened concurrently with the karyotypically abnormal tumor. Two UL with t(12;14) (Cases 1 and 2) and one UL that was mosaic for both t(12;14) and del(7q) (Case 3) were obtained from surgical specimens at Brigham and Women's Hospital (BWH) through a Partners HealthCare IRB-approved protocol between 1990 and 2004. Six UL with t(12;14) (Cases 4–9) were identified from an IRB-approved tissue bank of over 100 consented, premenopausal, 25- to 50-year-old women who underwent myomectomy or hysterectomy at BWH between 2003 and 2007. Diagnosis of UL was confirmed through medical record review. Participants consented for the tissue bank also completed detailed epidemiological questionnaires surveying clinical, reproductive, sexual, dietary and family history. Each case was grossly confirmed to be a UL or myometrial specimen, and when possible, hematoxylin- and eosin-stained tissue sections underwent pathologic evaluation (Table 1).
Fluorescence in situ hybridization
End-sequenced and FISH-verified bacterial artificial chromosomes (68) were selected using the University of California Santa Cruz Biotechnology Genome Browser and Database (http://genome.ucsc.edu) (69) and then obtained from the RP11 library (BACPAC Resource Center at the Children's Hospital Oakland Research Institute, Oakland, CA, USA) or the CTD library (Invitrogen). DNA was isolated from bacterial cultures following a standard protocol consisting of alkaline lysis, neutralization and ethanol precipitation.
UL with t(12;14)(q14-15;q23-24) were identified by the presence of a fusion signal of probes RP11-185D13 located at 12q14.3 and CTD-3225F7 at 14q24 by interphase FISH on nuclei from fresh fixed cell pellets as described previously (70). A total of 100 interphase nuclei were scored for each specimen. The probe set was validated on both normal metaphases from peripheral blood lymphocytes and on interphase nuclei from karyotype-confirmed t(12;14) UL.
Immunohistochemistry for HMGA2
Detection of HMGA2 protein in formalin-fixed, paraffin-embedded t(12;14) UL and matched non-t(12;14) UL tissue sections for Cases 4 and 5 involved pressure cooker heat-induced antigen retrieval for 2 min in citrate buffer followed by a 20 min cool down, a 5 min 0.05 M Tris/Tween 20 wash, a 5 min peroxidase block (Dako) and a 5 min Tris incubation. A 1:2000 dilution of a primary polyclonal anti-HMGA2 antibody (Biocheck, Inc.) was used for 40 min. The Envision Plus detection system (Dako) was then applied, including a 30 min incubation with goat anti-rabbit immunoglobulin conjugated to a peroxidase-labeled polymer [horseradish peroxidase (HRP)] followed by a 5 min exposure to the substrate diaminobenzidine (DAB) to produce a brown precipitate visible by microscopy. Hematoxylin was used as the counterstain. All steps were performed at room temperature unless otherwise noted. HMGA2 protein expression (brown) versus background (blue) staining was evaluated using a semi-automated image analysis system (ACISII, Chromavision) (71), and the results of two separate sections from each sample were averaged. HMGA2 staining for each t(12;14) UL sample is expressed as a fold change compared with a matched non-t(12;14) UL from the same patient.
Immunohistochemistry for CCND1
Immunohistochemistry to detect CCND1 protein in t(12;14) UL and matched non-t(12;14) UL for Cases 4 and 5 was performed in the Specialized Histology Core of the Dana-Farber/Harvard Cancer Center. Five-micron formalin-fixed, paraffin-embedded tissue sections were deparaffinized and subjected to antigen retrieval in a pressure cooker for 2 min in citrate buffer. After washing, the endogenous peroxidase activity was quenched (Peroxidase block, Dako) for 20 min and slides were incubated with rabbit polyclonal anti-cyclin D1 antibody (1:40, Thermo Fisher Scientific) for 60 min. Following washing, the Envision Plus detection system (Dako) was applied, including a 30 min incubation with goat anti-rabbit immunoglobulin conjugated to a peroxidase-labeled polymer (HRP) followed by a 5 min exposure to the substrate diaminobenzidine (DAB) to produce a brown precipitate visible by microscopy. Hematoxylin was used as the counterstain. All steps subsequent to antigen retrieval were performed at room temperature. CCND1 protein expression (brown) versus background (blue) staining was evaluated by dividing each stained tumor into four quadrants, visually assessing 20 nuclei in each quadrant and then averaging the data from the four quadrants. The results of two separate sections from each tumor were also averaged. CCND1 staining for each t(12;14) UL sample is expressed as fold change compared with a non-t(12;14) UL from the same patient.
RNA isolation
A portion of each of the myometrial, non-t(12;14) UL and t(12;14) UL tissues was frozen in liquid nitrogen immediately after surgical removal or placed directly into RNAlater solution (QIAGEN). RNA was isolated using the RNeasy Fibrous Tissue kit with a provided standard protocol (QIAGEN) and assessed for purity and quantity on a Nanodrop spectrophotometer (Thermo Scientific).
Q-PCR for HMGA2
Quantitative PCR was performed as previously described (14) using the standard curve method and normalizing the level of HMGA2 in each tissue to that of GAPDH.
Q-PCR for CCND1 and CCND2
Total RNA from the t(12;14) and non-t(12;14) UL from each of five women (Cases 1, 4, 6, 8 and 9) was examined for CCND1 and CCND2 gene expression. PCR was performed on the ABI PRISM 7900HT Sequence Detection System in a 384-well format. TaqMan Universal PCR MasterMix and a pre-designed and optimized Taqman Gene Expression Assay for quantitation of human CCND1 or CCND2 RNA (Applied Biosystems) were used according to the manufacturer's instructions. Each RNA was run in quadruplicate and the Ct (cycle threshold) values of these replicates were averaged and then normalized by subtracting the Ct value of the co-amplified internal control housekeeping gene GAPDH for a ΔCt value. Data analysis used the comparative Ct method where the ΔCt of a non-t(12;14) UL was used as a calibrator reference and subtracted from the ΔCt of the corresponding t(12;14) UL to yield a ΔΔCt value. This was then converted into a fold-change relative to one using the following formula: CCND1 or CCND2 expression =  . For each gene, this number was then averaged across the five samples.
Transcriptional profiling
Total RNA isolated from the myometrial, non-t(12;14) UL and t(12;14) UL tissues from each of nine cases was assessed for quality by RNA Nano LabChip analysis on an Agilent Bioanalyzer 2100 and then applied to GeneChip Human Genome U133 Plus 2.0 oligonucleotide expression microarrays (Affymetrix). Standard protocols as described in the Affymetrix GeneChip Expression Analysis Technical Manual revision 5 were employed at the Harvard Medical School—Partners HealthCare Center for Genetics and Genomics (HPCGG). Briefly, 5 μg of total RNA template from each sample was reverse-transcribed into cDNA using oligo-dT primer containing T7 RNA polymerase-binding sites using the GeneChip Expression 3′-Amplification Reagents One-Cycle cDNA Synthesis kit with subsequent purification of the double-stranded product with Affymetrix GeneChip Cleanup Module (Affymetrix). In vitro transcription to produce complementary RNA (cRNA) using T7 Polymerase and biotinylated dUTP and dCTP was performed with the GeneChip Expression Amplification Reagents kit (Affymetrix) and the biotin-labeled product quantitated on a UV plate reader (Bio-Tek). Following purification and fragmentation to reduce secondary structure, hybridization occurred overnight at 45°C in a Model 640 hybridization chamber to expression microarrays containing over 54 000 oligonucleotide probe sets representing more than 47 000 transcripts and 38 500 well-characterized genes. Arrays were washed using a Model 450 Fluidics station with GeneChip Operating Software (Affymetrix) and then scanned by the GeneChip Model 3000 7G. Array images were inspected visually for experimental artifacts and various quality measurements such as present versus absent calls and RNA degradation were examined to verify the quality of the data. Probe set expression values were calculated by GeneChip software using the MAS 5.0 algorithm. Probe sets with fewer than five present calls among the t(12;14), non-t(12;14) and myometrium arrays were excluded. Paired differential expression analysis (not accounting for percent mosaicism) between t(12;14) and non-t(12;14) UL was computed using paired t-tests in which tissue samples were analyzed as matched pairs based on patient status. Mosaicism-weighted paired differential expression analysis was implemented in the Bioconductor (72) package limma (73) by fitting a linear model with weights equal to the percent mosaicism. All differential expression analyses were corrected for multiple testing using the false discovery rate (Q-value). Data analysis was carried out in the statistical language R (http://www.r-project.org).
Expression data were deposited at the NCBI Gene Expression Omnibus (GEO; http://www.ncbi.nlm.nih.gov/geo/); the series entry number is GSE18096 and the specific accession identifiers are listed in Table 1.
Ingenuity Pathways Analysis and Gene Set Enrichment Analysis
Functional analysis of the 374 probe sets with a P-value of ≤0.005 from the t(12;14) UL-specific gene list weighted for t(12;14) cell mosaicism was performed using IPA (Ingenuity Systems, www.Ingenuity.com). Networks were generated to look for interactions of the t(12;14) UL-specific genes with others based on the literature as curated in the Ingenuity Pathway Knowledge Base. Fisher's exact test was used to calculate statistical significance of a network, which is the probability of observing the number of genes from the t(12;14) UL-specific gene list given the number of genes belonging to the network. The network score is calculated by −log10(P-value). Networks with a score of 8–46 were highly significant and included 7–25 genes from the t(12;14) UL-specific list.
For the GSEA method, 700 gene ontology (GO) functional annotations that have ≥20 genes and ≤500 genes were collected from MSigDB (http://www.broadinstitute.org/gsea/msigdb/index.jsp; MSigDB c5 GO category). The extent of enrichment (enrichment score) was calculated for the individual GO categories using the weighted Kolmogorov–Smirnov statistic as described previously (34). The significance was determined based on 1000 gene permutation tests and adjusted for multiple tests.
Analysis of merged del(7q) UL and t(12;14) UL data sets
The t(12;14) UL expression data and the published del(7q) UL data (GEO accession GSE12814) (32), which used the same array platform (GeneChip Human Genome U133 Plus 2.0), were merged. The combined expression profile was processed using ComBat (35) to adjust for batch effect. Agglomerative hierarchical clustering was performed on the 1000 top variable genes using Pearson's correlation as distance with average linkage. To test the hypothesis that myometrium from t(12;14) versus del(7q) patients can be distinguished based on expression profiles, the k-NN method was employed (74). In leave-one-out cross-validation tests for 16 predictions of seven t(12;14) and nine del(7q) myometrium, the prediction accuracy of 100% was achieved with a class predictor size of 20 genes. We report nine genes (PLP1, MEST, PCDH20, SLC26A7, BCL11A, PRL, LOC727770, CAPN6 and PLAG1) that were observed in all 16 sets of class predictors.
SUPPLEMENTARY MATERIAL
Supplementary Material is available at HMG online.
ACKNOWLEDGEMENTS
We thank all of the women who participated in this study, Dr Christopher Fletcher for his facilitation of HMGA2 immunohistochemistry, Christopher Lafargue and Zune Khalifa in Dr Mark Rubin's laboratory for technical assistance in quantitation of the resulting stained slides, Karen T.Cuenco for discussion of a data analysis method for the real-time PCR results and the Dana Farber Harvard Cancer Center Specialized Histology Core (P30 CA006516) for CCND1 immunohistochemistry.
Conflict of Interest statement. None declared.
FUNDING
This work was supported by the National Institutes of Health (grant numbers RO1HD046226 and RO1CA78895 to C.C.M.). J.C.H. was supported by the National Institutes of Health (grant number T32GM007748 to C.C.M.).
REFERENCES
- 1.Cramer S.F., Patel A. The frequency of uterine leiomyomas. Am. J. Clin. Pathol. 1990;94:435–438. doi: 10.1093/ajcp/94.4.435. [DOI] [PubMed] [Google Scholar]
- 2.Coronado G.D., Marshall L.M., Schwartz S.M. Complications in pregnancy, labor, and delivery with uterine leiomyomas: a population-based study. Obstet. Gynecol. 2000;95:764–769. doi: 10.1016/s0029-7844(99)00605-5. [DOI] [PubMed] [Google Scholar]
- 3.Buttram V.C., Jr, Reiter R.C. Uterine leiomyomata: etiology, symptomatology, and management. Fertil. Steril. 1981;36:433–445. doi: 10.1016/s0015-0282(16)45789-4. [DOI] [PubMed] [Google Scholar]
- 4.Viswanathan M., Hartmann K., McKoy N., Stuart G., Rankins N., Thieda P., Lux L.J., Lohr K.N. Management of uterine fibroids: an update of the evidence. Evid. Rep. Technol. Assess. (Full Rep) 2007;154:1–122. [PMC free article] [PubMed] [Google Scholar]
- 5.Flynn M., Jamison M., Datta S., Myers E. Health care resource use for uterine fibroid tumors in the United States. Am. J. Obstet. Gynecol. 2006;195:955–964. doi: 10.1016/j.ajog.2006.02.020. [DOI] [PubMed] [Google Scholar]
- 6.Hartmann K.E., Birnbaum H., Ben-Hamadi R., Wu E.Q., Farrell M.H., Spalding J., Stang P. Annual costs associated with diagnosis of uterine leiomyomata. Obstet. Gynecol. 2006;108:930–937. doi: 10.1097/01.AOG.0000234651.41000.58. [DOI] [PubMed] [Google Scholar]
- 7.Lepine L.A., Hillis S.D., Marchbanks P.A., Koonin L.M., Morrow B., Kieke B.A., Wilcox L.S. Hysterectomy surveillance—United States, 1980–1993. MMWR CDC Surveill. Summ. 1997;46:1–15. [PubMed] [Google Scholar]
- 8.Nilbert M., Heim S. Uterine leiomyoma cytogenetics. Genes Chrom. Cancer. 1990;2:3–13. doi: 10.1002/gcc.2870020103. [DOI] [PubMed] [Google Scholar]
- 9.Rein M.S., Friedman A.J., Barbieri R.L., Pavelka K., Fletcher J.A., Morton C.C. Cytogenetic abnormalities in uterine leiomyomata. Obstet. Gynecol. 1991;77:923–926. [PubMed] [Google Scholar]
- 10.Meloni A.M., Surti U., Contento A.M., Davare J., Sandberg A.A. Uterine leiomyomas: cytogenetic and histologic profile. Obstet. Gynecol. 1992;80:209–217. [PubMed] [Google Scholar]
- 11.Hennig Y., Deichert U., Bonk U., Thode B., Bartnitzke S., Bullerdiek J. Chromosomal translocations affecting 12q14–15 but not deletions of the long arm of chromosome 7 associated with a growth advantage of uterine smooth muscle cells. Mol. Hum. Reprod. 1999;5:1150–1154. doi: 10.1093/molehr/5.12.1150. [DOI] [PubMed] [Google Scholar]
- 12.Brosens I., Deprest J., Dal Cin P., Van den Berghe H. Clinical significance of cytogenetic abnormalities in uterine myomas. Fertil. Steril. 1998;69:232–235. doi: 10.1016/s0015-0282(97)00472-x. [DOI] [PubMed] [Google Scholar]
- 13.Rein M.S., Powell W.L., Walters F.C., Weremowicz S., Cantor R.M., Barbieri R.L., Morton C.C. Cytogenetic abnormalities in uterine myomas are associated with myoma size. Mol. Human Repro. 1998;4:83–86. doi: 10.1093/molehr/4.1.83. [DOI] [PubMed] [Google Scholar]
- 14.Gross K.L., Neskey D.M., Manchanda N., Weremowicz S., Kleinman M.S., Nowak R.A., Ligon A.H., Rogalla P., Drechsler K., Bullerdiek J., et al. HMGA2 expression in uterine leiomyomata and myometrium: quantitative analysis and tissue culture studies. Genes Chrom. Cancer. 2003;38:68–79. doi: 10.1002/gcc.10240. [DOI] [PubMed] [Google Scholar]
- 15.Gattas G.J., Quade B.J., Nowak R.A., Morton C.C. HMGIC expression in human adult and fetal tissues and in uterine leiomyomata. Genes Chrom. Cancer. 1999;25:316–322. [PubMed] [Google Scholar]
- 16.Wolffe A.P. Architectural transcription factors. Science. 1994;264:1100–1101. doi: 10.1126/science.8178167. [DOI] [PubMed] [Google Scholar]
- 17.Reeves R. Molecular biology of HMGA proteins: hubs of nuclear function. Gene. 2001;277:63–81. doi: 10.1016/s0378-1119(01)00689-8. [DOI] [PubMed] [Google Scholar]
- 18.Ashar H.R., Cherath L., Przybysz K.M., Chada K. Genomic characterization of human HMGIC, a member of the accessory transcription factor family found at translocation breakpoints in lipomas. Genomics. 1996;31:207–214. doi: 10.1006/geno.1996.0033. [DOI] [PubMed] [Google Scholar]
- 19.Grosschedl R., Giese K., Pagel J. HMG domain proteins: architectural elements in the assembly of nucleoprotein structures. Trends Genet. 1994;10:94–100. doi: 10.1016/0168-9525(94)90232-1. [DOI] [PubMed] [Google Scholar]
- 20.Hirning-Folz U., Wilda M., Rippe V., Bullerdiek J., Hameister H. The expression pattern of the Hmgic gene during development. Genes Chrom. Cancer. 1998;23:350–357. [PubMed] [Google Scholar]
- 21.Zhou X., Benson K.F., Ashar H.R., Chada K. Mutation responsible for the mouse pygmy phenotype in the developmentally regulated factor HMGI-C. Nature. 1995;376:771–774. doi: 10.1038/376771a0. [DOI] [PubMed] [Google Scholar]
- 22.Rogalla P., Drechsler K., Frey G., Hennig Y., Helmke B., Bonk U., Bullerdiek J. HMGI-C expression patterns in human tissues. Implications for the genesis of frequent mesenchymal tumors. Am. J. Pathol. 1996;149:775–779. [PMC free article] [PubMed] [Google Scholar]
- 23.Zhou X., Benson K.F., Przybysz K., Liu J., Hou Y., Cherath L., Chada K. Genomic structure and expression of the murine Hmgi-c gene. Nucleic Acids Res. 1996;24:4071–4077. doi: 10.1093/nar/24.20.4071. [DOI] [PMC free article] [PubMed] [Google Scholar]
- 24.Nissen M.S., Langan T.A., Reeves R. Phosphorylation by cdc2 kinase modulates DNA binding activity of high mobility group I nonhistone chromatin protein. J. Biol. Chem. 1991;266:19945–19952. [PubMed] [Google Scholar]
- 25.Hodge J.C., T Cuenco, K., Huyck K.L., Somasundaram P., Panhuysen C.I., Stewart E.A., Morton C.C. Uterine leiomyomata and decreased height: a common HMGA2 predisposition allele. Hum. Genet. 2009;125:257–263. doi: 10.1007/s00439-008-0621-6. [DOI] [PMC free article] [PubMed] [Google Scholar]
- 26.Weedon M.N., Lettre G., Freathy R.M., Lindgren C.M., Voight B.F., Perry J.R., Elliott K.S., Hackett R., Guiducci C., Shields B., et al. A common variant of HMGA2 is associated with adult and childhood height in the general population. Nat. Genet. 2007;39:1245–1250. doi: 10.1038/ng2121. [DOI] [PMC free article] [PubMed] [Google Scholar]
- 27.Ligon A.H., Moore S.D., Parisi M.A., Mealiffe M.E., Harris D.J., Ferguson H.L., Quade B.J., Morton C.C. Constitutional rearrangement of the architectural factor HMGA2: a novel human phenotype including overgrowth and lipomas. Am. J. Hum. Genet. 2005;76:340–348. doi: 10.1086/427565. [DOI] [PMC free article] [PubMed] [Google Scholar]
- 28.Berthois Y., Katzenellenbogen J.A., Katzenellenbogen B.S. Phenol red in tissue culture media is a weak estrogen: implications concerning the study of estrogen-responsive cells in culture. Proc. Natl Acad. Sci. USA. 1986;83:2496–2500. doi: 10.1073/pnas.83.8.2496. [DOI] [PMC free article] [PubMed] [Google Scholar]
- 29.Hashimoto K., Azuma C., Kamiura S., Kimura T., Nobunaga T., Kanai T., Sawada M., Noguchi S., Saji F. Clonal determination of uterine leiomyomas by analyzing differential inactivation of the X-chromosome-linked phosphoglycerokinase gene. Gynecol. Obstet. Invest. 1995;40:204–208. doi: 10.1159/000292336. [DOI] [PubMed] [Google Scholar]
- 30.Linder D., Gartler S.M. Glucose-6-phosphate dehydrogenase mosaicism: utilization as a cell marker in the study of leiomyomas. Science. 1965;150:67–69. doi: 10.1126/science.150.3692.67. [DOI] [PubMed] [Google Scholar]
- 31.Mashal R.D., Fejzo M.L., Friedman A.J., Mitchner N., Nowak R.A., Rein M.S., Morton C.C., Sklar J. Analysis of androgen receptor DNA reveals the independent clonal origins of uterine leiomyomata and the secondary nature of cytogenetic aberrations in the development of leiomyomata. Genes Chrom. Cancer. 1994;11:1–6. doi: 10.1002/gcc.2870110102. [DOI] [PubMed] [Google Scholar]
- 32.Hodge J.C., Park P.J., Dreyfuss J.M., Assil-Kishawi I., Somasundaram P., Semere L.G., Quade B.J., Lynch A.M., Stewart E.A., Morton C.C. Identifying the molecular signature of the interstitial deletion 7q subgroup of uterine leiomyomata using a paired analysis. Genes Chrom. Cancer. 2009;48:865–885. doi: 10.1002/gcc.20692. [DOI] [PMC free article] [PubMed] [Google Scholar]
- 33.Storey J.D., Tibshirani R. Statistical significance for genomewide studies. Proc. Natl Acad. Sci. USA. 2003;100:9440–9445. doi: 10.1073/pnas.1530509100. [DOI] [PMC free article] [PubMed] [Google Scholar]
- 34.Subramanian A., Tamayo P., Mootha V.K., Mukherjee S., Ebert B.L., Gillette M.A., Paulovich A., Pomeroy S.L., Golub T.R., Lander E.S., et al. Gene set enrichment analysis: a knowledge-based approach for interpreting genome-wide expression profiles. Proc. Natl Acad. Sci. USA. 2005;102:15545–15550. doi: 10.1073/pnas.0506580102. [DOI] [PMC free article] [PubMed] [Google Scholar]
- 35.Johnson W.E., Li C., Rabinovic A. Adjusting batch effects in microarray expression data using empirical Bayes methods. Biostatistics. 2007;8:118–127. doi: 10.1093/biostatistics/kxj037. [DOI] [PubMed] [Google Scholar]
- 36.Fusco A., Fedele M. Roles of HMGA proteins in cancer. Nat. Rev. Cancer. 2007;7:899–910. doi: 10.1038/nrc2271. [DOI] [PubMed] [Google Scholar]
- 37.Schoenmakers E.F., Wanschura S., Mols R., Bullerdiek J., Van den Berghe H., Van de Ven W.J. Recurrent rearrangements in the high mobility group protein gene, HMGI-C, in benign mesenchymal tumours. Nat. Genet. 1995;10:436–444. doi: 10.1038/ng0895-436. [DOI] [PubMed] [Google Scholar]
- 38.Berner J.M., Meza-Zepeda L.A., Kools P.F., Forus A., Schoenmakers E.F., Van de Ven W.J., Fodstad O., Myklebost O. HMGIC, the gene for an architectural transcription factor, is amplified and rearranged in a subset of human sarcomas. Oncogene. 1997;14:2935–2941. doi: 10.1038/sj.onc.1201135. [DOI] [PubMed] [Google Scholar]
- 39.Cha P.C., Takahashi A., Hosono N., Low S.K., Kamatani N., Kubo M., Nakamura Y. A genome-wide association study identifies three loci associated with susceptibility to uterine fibroids. Nat. Genet. 2011;43:447–450. doi: 10.1038/ng.805. [DOI] [PubMed] [Google Scholar]
- 40.Geurts J.M., Schoenmakers E.F., Roijer E., Astrom A.K., Stenman G., van de Ven W.J. Identification of NFIB as recurrent translocation partner gene of HMGIC in pleomorphic adenomas. Oncogene. 1998;16:865–872. doi: 10.1038/sj.onc.1201609. [DOI] [PubMed] [Google Scholar]
- 41.Hensen K., Braem C., Declercq J., Van Dyck F., Dewerchin M., Fiette L., Denef C., Van de Ven W.J. Targeted disruption of the murine Plag1 proto-oncogene causes growth retardation and reduced fertility. Dev. Growth Differ. 2004;46:459–470. doi: 10.1111/j.1440-169x.2004.00762.x. [DOI] [PubMed] [Google Scholar]
- 42.Hensen K., Van Valckenborgh I.C., Kas K., Van de Ven W.J., Voz M.L. The tumorigenic diversity of the three PLAG family members is associated with different DNA binding capacities. Cancer Res. 2002;62:1510–1517. [PubMed] [Google Scholar]
- 43.Voz M.L., Mathys J., Hensen K., Pendeville H., Van Valckenborgh I., Van Huffel C., Chavez M., Van Damme B., De Moor B., Moreau Y., et al. Microarray screening for target genes of the proto-oncogene PLAG1. Oncogene. 2004;23:179–191. doi: 10.1038/sj.onc.1207013. [DOI] [PubMed] [Google Scholar]
- 44.Landrette S.F., Kuo Y.H., Hensen K., Barjesteh van Waalwijk van Doorn-Khosrovani S., Perrat P.N., Van de Ven W.J., Delwel R., Castilla L.H. Plag1 and Plagl2 are oncogenes that induce acute myeloid leukemia in cooperation with Cbfb-MYH11. Blood. 2005;105:2900–2907. doi: 10.1182/blood-2004-09-3630. [DOI] [PubMed] [Google Scholar]
- 45.Nohara A., Ohmichi M., Koike K., Jikihara H., Kimura A., Masuhara K., Ikegami H., Inoue M., Miyake A., Murata Y. Prolactin stimulates mitogen-activated protein kinase in human leiomyoma cells. Biochem. Biophys. Res.Commun. 1997;238:473–477. doi: 10.1006/bbrc.1997.7322. [DOI] [PubMed] [Google Scholar]
- 46.Nowak R.A., Mora S., Diehl T., Rhoades A.R., Stewart E.A. Prolactin is an autocrine or paracrine growth factor for human myometrial and leiomyoma cells. Gynecol. Obstet. Invest. 1999;48:127–132. doi: 10.1159/000010154. [DOI] [PubMed] [Google Scholar]
- 47.Arslan A.A., Gold L.I., Mittal K., Suen T.C., Belitskaya-Levy I., Tang M.S., Toniolo P. Gene expression studies provide clues to the pathogenesis of uterine leiomyoma: new evidence and a systematic review. Hum. Reprod. 2005;20:852–863. doi: 10.1093/humrep/deh698. [DOI] [PubMed] [Google Scholar]
- 48.Lefebvre L., Viville S., Barton S.C., Ishino F., Keverne E.B., Surani M.A. Abnormal maternal behaviour and growth retardation associated with loss of the imprinted gene Mest. Nat. Genet. 1998;20:163–169. doi: 10.1038/2464. [DOI] [PubMed] [Google Scholar]
- 49.Skubitz K.M., Skubitz A.P. Differential gene expression in uterine leiomyoma. J. Lab. Clin. Med. 2003;141:297–308. doi: 10.1016/S0022-2143(03)00007-6. [DOI] [PubMed] [Google Scholar]
- 50.Rho S.B., Byun H.J., Park S.Y., Chun T. Calpain 6 supports tumorigenesis by inhibiting apoptosis and facilitating angiogenesis. Cancer Lett. 2008;271:306–313. doi: 10.1016/j.canlet.2008.06.020. [DOI] [PubMed] [Google Scholar]
- 51.Satterwhite E., Sonoki T., Willis T.G., Harder L., Nowak R., Arriola E.L., Liu H., Price H.P., Gesk S., Steinemann D., et al. The BCL11 gene family: involvement of BCL11A in lymphoid malignancies. Blood. 2001;98:3413–3420. doi: 10.1182/blood.v98.12.3413. [DOI] [PubMed] [Google Scholar]
- 52.Grossel M.J., Baker G.L., Hinds P.W. cdk6 can shorten G(1) phase dependent upon the N-terminal INK4 interaction domain. J. Biol. Chem. 1999;274:29960–29967. doi: 10.1074/jbc.274.42.29960. [DOI] [PubMed] [Google Scholar]
- 53.Resnitzky D., Gossen M., Bujard H., Reed S.I. Acceleration of the G1/S phase transition by expression of cyclins D1 and E with an inducible system. Mol. Cell. Biol. 1994;14:1669–1679. doi: 10.1128/mcb.14.3.1669. [DOI] [PMC free article] [PubMed] [Google Scholar]
- 54.Timmermann S., Hinds P.W., Munger K. Elevated activity of cyclin-dependent kinase 6 in human squamous cell carcinoma lines. Cell Growth Differ. 1997;8:361–370. [PubMed] [Google Scholar]
- 55.Donnellan R., Chetty R. Cyclin D1 and human neoplasia. Mol. Pathol. 1998;51:1–7. doi: 10.1136/mp.51.1.1. [DOI] [PMC free article] [PubMed] [Google Scholar]
- 56.Easton J., Wei T., Lahti J.M., Kidd V.J. Disruption of the cyclin D/cyclin-dependent kinase/INK4/retinoblastoma protein regulatory pathway in human neuroblastoma. Cancer Res. 1998;58:2624–2632. [PubMed] [Google Scholar]
- 57.Costello J.F., Plass C., Arap W., Chapman V.M., Held W.A., Berger M.S., Su Huang H.J., Cavenee W.K. Cyclin-dependent kinase 6 (CDK6) amplification in human gliomas identified using two-dimensional separation of genomic DNA. Cancer Res. 1997;57:1250–1254. [PubMed] [Google Scholar]
- 58.Lanahan A., Williams J.B., Sanders L.K., Nathans D. Growth factor-induced delayed early response genes. Mol. Cell. Biol. 1992;12:3919–3929. doi: 10.1128/mcb.12.9.3919. [DOI] [PMC free article] [PubMed] [Google Scholar]
- 59.Tavtigian S.V., Zabludoff S.D., Wold B.J. Cloning of mid-G1 serum response genes and identification of a subset regulated by conditional myc expression. Mol. Biol. Cell. 1994;5:375–388. doi: 10.1091/mbc.5.3.375. [DOI] [PMC free article] [PubMed] [Google Scholar]
- 60.Li D., Lin H.H., McMahon M., Ma H., Ann D.K. Oncogenic raf-1 induces the expression of non-histone chromosomal architectural protein HMGI-C via a p44/p42 mitogen-activated protein kinase-dependent pathway in salivary epithelial cells. J. Biol. Chem. 1997;272:25062–25070. doi: 10.1074/jbc.272.40.25062. [DOI] [PubMed] [Google Scholar]
- 61.Ayoubi T.A., Jansen E., Meulemans S.M., Van de Ven W.J. Regulation of HMGIC expression: an architectural transcription factor involved in growth control and development. Oncogene. 1999;18:5076–5087. doi: 10.1038/sj.onc.1202881. [DOI] [PubMed] [Google Scholar]
- 62.Brants J.R., Ayoubi T.A., Chada K., Marchal K., Van de Ven W.J., Petit M.M. Differential regulation of the insulin-like growth factor II mRNA-binding protein genes by architectural transcription factor HMGA2. FEBS Lett. 2004;569:277–283. doi: 10.1016/j.febslet.2004.05.075. [DOI] [PubMed] [Google Scholar]
- 63.Cleynen I., Brants J.R., Peeters K., Deckers R., Debiec-Rychter M., Sciot R., Van de Ven W.J., Petit M.M. HMGA2 regulates transcription of the Imp2 gene via an intronic regulatory element in cooperation with nuclear factor-kappaB. Mol. Cancer Res. 2007;5:363–372. doi: 10.1158/1541-7786.MCR-06-0331. [DOI] [PubMed] [Google Scholar]
- 64.Nielsen J., Christiansen J., Lykke-Andersen J., Johnsen A.H., Wewer U.M., Nielsen F.C. A family of insulin-like growth factor II mRNA-binding proteins represses translation in late development. Mol. Cell. Biol. 1999;19:1262–1270. doi: 10.1128/mcb.19.2.1262. [DOI] [PMC free article] [PubMed] [Google Scholar]
- 65.Stewart E.A., Nowak R.A. New concepts in the treatment of uterine leiomyomas. Obstet. Gynecol. 1998;92:624–627. doi: 10.1016/s0029-7844(98)00243-9. [DOI] [PubMed] [Google Scholar]
- 66.Semenza G.L. Targeting HIF-1 for cancer therapy. Nat. Rev. Cancer. 2003;3:721–732. doi: 10.1038/nrc1187. [DOI] [PubMed] [Google Scholar]
- 67.Forristal C.E., Wright K.L., Hanley N.A., Oreffo R.O., Houghton F.D. Hypoxia inducible factors regulate pluripotency and proliferation in human embryonic stem cells cultured at reduced oxygen tensions. Reproduction. 2010;139:85–97. doi: 10.1530/REP-09-0300. [DOI] [PMC free article] [PubMed] [Google Scholar]
- 68.Cheung V.G., Nowak N., Jang W., Kirsch I.R., Zhao S., Chen X.N., Furey T.S., Kim U.J., Kuo W.L., Olivier M., et al. Integration of cytogenetic landmarks into the draft sequence of the human genome. Nature. 2001;409:953–958. doi: 10.1038/35057192. [DOI] [PMC free article] [PubMed] [Google Scholar]
- 69.Karolchik D., Baertsch R., Diekhans M., Furey T.S., Hinrichs A., Lu Y.T., Roskin K.M., Schwartz M., Sugnet C.W., Thomas D.J., et al. The UCSC Genome Browser Database. Nucleic Acids Res. 2003;31:51–54. doi: 10.1093/nar/gkg129. [DOI] [PMC free article] [PubMed] [Google Scholar]
- 70.Moore S.D., Herrick S.R., Ince T.A., Kleinman M.S., Cin P.D., Morton C.C., Quade B.J. Uterine leiomyomata with t(10;17) disrupt the histone acetyltransferase MORF. Cancer Res. 2004;64:5570–5577. doi: 10.1158/0008-5472.CAN-04-0050. [DOI] [PubMed] [Google Scholar]
- 71.Bismar T.A., Demichelis F., Riva A., Kim R., Varambally S., He L., Kutok J., Aster J.C., Tang J., Kuefer R., et al. Defining aggressive prostate cancer using a 12-gene model. Neoplasia. 2006;8:59–68. doi: 10.1593/neo.05664. [DOI] [PMC free article] [PubMed] [Google Scholar]
- 72.Gentleman R.C., Carey V.J., Bates D.M., Bolstad B., Dettling M., Dudoit S., Ellis B., Gautier L., Ge Y., Gentry J., et al. Bioconductor: open software development for computational biology and bioinformatics. Genome Biol. 2004;5:R80. doi: 10.1186/gb-2004-5-10-r80. [DOI] [PMC free article] [PubMed] [Google Scholar]
- 73.Smyth G.K. Linear models and empirical Bayes methods for assessing differential expression in microarray experiments. Stat. Appl. Genet. Mol. Biol. 2004;3 doi: 10.2202/1544-6115.1027. Article3. [DOI] [PubMed] [Google Scholar]
- 74.Golub T.R., Slonim D.K., Tamayo P., Huard C., Gaasenbeek M., Mesirov J.P., Coller H., Loh M.L., Downing J.R., Caligiuri M.A., et al. Molecular classification of cancer: class discovery and class prediction by gene expression monitoring. Science. 1999;286:531–537. doi: 10.1126/science.286.5439.531. [DOI] [PubMed] [Google Scholar]
Associated Data
This section collects any data citations, data availability statements, or supplementary materials included in this article.