

Abstract
Photoreceptors are coupled via gap junctions in many mammalian species. Cone-to-cone coupling is thought to improve sensitivity and signal-to-noise ratio, while rod-to-cone coupling provides an alternative rod pathway active under twilight or mesopic conditions (Smith et al., 1986; DeVries et al., 2002; Hornstein et al., 2005). Gap junctions are composed of connexins, and connexin36 (Cx36), the dominant neuronal connexin, is expressed in the outer plexiform layer. Primate (Macaca mulatta) cone pedicles, labeled with an antibody against cone arrestin (7G6) were connected by a network of fine processes called telodendria and, in double-labeled material, Cx36 plaques were located precisely at telodendrial contacts between cones, suggesting strongly they are Cx36 gap junctions. Each red/green cone made nonselective connections with neighboring red/green cones. In contrast, blue cone pedicles were smaller with relatively few short telodendria and they made only rare or equivocal Cx36 contacts with adjacent cones. There were also many smaller Cx36 plaques around the periphery of every cone pedicle and along a series of very fine telodendria that were too short to reach adjacent members of the cone pedicle mosaic. These small Cx36 plaques were closely aligned with nearly every rod spherule and may identify sites of rod-to-cone coupling, even though the identity of the rod connexin has not been established. We conclude that the matrix of cone telodendria is the substrate for photoreceptor coupling. Red/green cones were coupled indiscriminately but blue cones were rarely connected with other cones. All cone types, including blue cones, made gap junctions with surrounding rod spherules.
Introduction
In the mammalian retina, cones support color vision under relatively bright conditions and, in the primate fovea, they are densely packed to support the highest acuity. Rods are much more numerous, except in central retina, and they have increased sensitivity to function in low light conditions. There are several different but partially redundant rod and cone pathways through the retina: together, they provide a visual range covering 10 log units of intensity. Certain retinal cell types form networks coupled via gap junctions, thought to serve functions such as signal averaging and noise reduction (Sohl et al., 2005; Bloomfield and Völgyi, 2009). In addition, gap junctions can provide alternative signal pathways. Connexin36 (Cx36), the dominant neuronal connexin, is an essential component of the high-gain rod pathway (Deans et al., 2002).
Ultrastructural studies have revealed gap junctions between cones, as well as between cones and rods, in many mammalian species (Raviola and Gilula, 1973; Smith et al., 1986; Ahnelt et al., 1990; Tsukamoto et al., 1992; Kolb et al., 1997). In primate and ground squirrel, red/green or green cones were dye-coupled and paired recordings showed that electrical coupling was bidirectional. In both species, blue cones were not coupled to surrounding cones despite the anatomical finding that blue cones in the primate retina made occasional gap junctions with other cones (DeVries et al., 2002; Hornstein et al., 2004; Li and DeVries, 2004). Cones and rods were also dye-coupled (Hornstein et al., 2005) and, definitively, in rod–cone pairs from the ground squirrel retina, electrical signals were transmitted bidirectionally (Li et al., 2010). In addition, signals bearing a rod signature could be recorded in cones and in horizontal cells that were exclusively connected with cones (Nelson et al., 1975; Nelson, 1977; Schneeweis and Schnapf, 1995, 1999; Hornstein et al., 2005). These signals are thought to be transmitted by rod-to-cone gap junctions which are controlled by a circadian clock via D2-like dopamine receptors (Ribelayga et al., 2008; Ribelayga and Mangel, 2010).
Cones express Cx36 in the mouse, guinea pig, ground squirrel, and bass retina (Lee et al., 2003; Feigenspan et al., 2004; Li and DeVries, 2004; O'Brien et al., 2004). The proposed sites of electrical coupling are the telodendrial contacts between cones. Telodendria are very fine processes emanating from the base of each cone pedicle, which have been difficult to visualize except by electron microscopy (Raviola and Gilula, 1975; Kolb, 1977; Smith et al., 1986; Ahnelt et al., 1990; Tsukamoto et al., 1992, 2001; Kolb et al., 1997). We used an antibody, 7G6, against cone arrestin (Wikler et al., 1997; Zhang et al., 2003), to label cones in the primate retina and examine the distribution of Cx36 gap junctions. Cx36 is located at telodendrial contacts between red/green cones, but blue cones have short telodendria which rarely reach neighboring cones. In addition, all cones, including blue cones, make Cx36 gap junctions with many surrounding rod spherules.
Materials and Methods
Rhesus macaque (Macaca mulatta) eyes, from animals of either sex, were purchased from Covance Research Products. The macaque eyes were enucleated and hemisected. The posterior eyecup, composed of the retina, choroid, and sclera, was placed in a jar containing 4% paraformaldehyde in 0.1 m phosphate buffer (PB), pH 7.4, and was adjusted to ensure no internal folding of the retina during fixation. The eyecup was fixed for 1–1.5 h at 4°C, transferred to a new jar containing 0.1 m PB, and shipped overnight on icepack. Retinas were then dissected from the eyecup, cut, and mounted on filter paper. The fovea and optic nerve head were identified. Tissues were rinsed several times in 0.1 m PB and stored in 0.1 m PB with 0.5% Triton X-100 and 0.1% NaN3. Macaque retinas were removed from filter paper before incubation in antibodies. Some pieces of retina (∼3 × 3 mm2) were embedded in 4% agarose (Sigma, A-2576) and sections were cut 50 μm thick on a Vibratome (Technical Products International, Model 1000; or Leica Microsystems Inc., Model VT1000 S).
Immunohistochemistry.
Retinas were blocked overnight at 4°C in 3% donkey serum in 0.1 m PB with 0.5% Triton X-100 and 0.1% NaN3. Antibodies were diluted in 1% donkey serum in 0.1 m PB with 0.5% Triton X-100 and 0.1% NaN3. The tissues were incubated with primary antibodies for 5–10 d at 4°C, rinsed, and incubated with secondary antibodies overnight at 4°C. Retinal sections were incubated with antibodies overnight at 4°C. In experiments using two antibodies from the same species, antibodies were applied and developed sequentially. Tissues were blocked between sequential antibody incubations with donkey anti-mouse unconjugated, monovalent Fab fragments (Jackson ImmunoResearch Laboratories, 1:50) in 3% donkey serum/0.1 m PB/0.5% Triton/0.1% NaN3. As a control, primary antibodies were omitted, and tissues were only incubated in secondary antibodies.
The primary antibodies used in these experiments included mouse anti-Connexin35/36 (Clone 8F6.2) (Millipore Bioscience Research Reagents, MAB3045, 1:250–1:500), monoclonal 7G6 (a gift from Dr. Peter MacLeish, Morehouse School of Medicine, Atlanta, GA; 1:200–1:400), rabbit anti-blue cone opsin (Millipore Bioscience Research Reagents, AB5407, 1:400), rabbit anti-SV2b (a gift from Dr. Roger Janz, University of Texas Health Science Center at Houston, Houston, TX), and rabbit anti-mGluR6 (a generous gift from Dr. Noga Vardi, University of Pennsylvania School of Medicine, Philadelphia, PA, 1:1000). Donkey secondary antibodies labeled with Cy3, Cy5, or Alexa Fluor 488 (Jackson ImmunoResearch Laboratories; Invitrogen) were used at a dilution of 1:200 and tissue was mounted in Vectashield (Vector Laboratories).
A Zeiss LSM-510 Meta confocal microscope was used to image retinal whole mounts and sections with 40× [numerical aperture (N.A.) 1.3] or 63× (N.A. 1.4) oil-immersion objectives. Images were acquired in series of 0.3–0.5 μm optical sections and figures were presented as short stacks of 2–6 images, which had the effect of flattening slight ripples in the tissue. Images were processed in Adobe Photoshop (Adobe Systems Inc) to enhance brightness and color.
Size analysis.
To obtain size distributions of Cx36 plaques, images were analyzed using MatLab Version 5.3 (The MathWorks) and SigmaScan Pro 4 (Systat Software). All images used for statistical comparisons were taken with similar settings on the confocal microscope. Contiguous pixels of a given intensity were selected in SigmaScan Pro 4 software using a pixel intensity threshold of 50 to minimize enlargement of the plaque by optical blur. In MatLab, signals with color intensities >50 (50–255) were extracted and replotted in a new image. The new image was imported into SigmaScan Pro 4, and individual plaques were highlighted to determine their pixel number and size. Signals smaller than 0.07–0.09 μm2 may be below the resolution limit (∼0.3 μm diameter) and were excluded. Plaque sizes were sorted into groups in MatLab and those >0.09 μm2 were used in the analysis.
Results
Cone pedicles have telodendria
The monoclonal antibody 7G6 was first identified in a screen for retinal antibodies because primate cones were well labeled (Wikler et al., 1997). Subsequently, the epitope was identified as cone arrestin, a component of the phototransduction cascade that is expressed abundantly in cones (Zhang et al., 2003).
In vertical sections of macaque retina, the 7G6 antibody labeled cones in their entirety, from the outer segments to the pedicles. The cone axons descended through the outer nuclear layer and terminated in a row of contiguous synaptic terminals or pedicles. In central retina, where the cones were closely packed, every cone pedicle was stained. There were no holes in the mosaic, which suggests that all cones were labeled by the 7G6 antibody (Wikler et al., 1997). Red and green cones could not be distinguished, either morphologically or by currently available antibodies, but the outer segments of some cones, ∼10%, were double-labeled for S-cone opsin (Fig. 1A). This indicates that red, green, and blue cones were all labeled.
Figure 1.
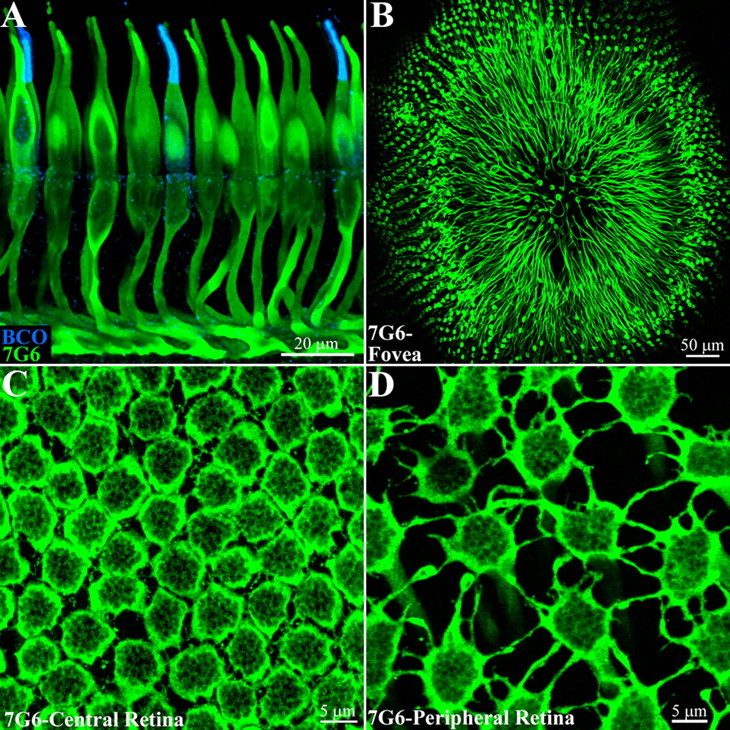
An antibody to cone arrestin, 7G6, labels primate cones. A, Cones in the macaque retinal sections were labeled with 7G6, a cone arrestin antibody, shown in green. Cones were labeled in their entirety with particularly bright staining of the outer segments and pedicles or synaptic terminals. Red/green cones cannot be distinguished but double labeling with an antibody against blue cone opsin (blue) shows that blue cones are also stained by 7G6. Optical sections 8 × 0.5 μm. B, A whole-mount view of the macaque fovea shows cones labeled with the 7G6 antibody. The axons of the foveal cones are displaced radially away from the foveal pit, forming Henle's fiber layer, and terminating in a ring of cone pedicles around the fovea. A 20× objective, 9 × 1 μm sections. C, Central primate retina, focus at the level of the outer plexiform layer. Cone pedicles, labeled with 7G6, are densely packed, often in contact. They also extend short processes, called telodendria, to contact adjacent pedicles. The rim of each cone pedicle is densely stained but there are many holes in the base of the cone pedicle that correspond to synaptic invaginations (see below). Optical sections 5 × 0.4 μm. D, In peripheral primate retina, the cone density decreases, the cone pedicles are widely spaced and the telodendria lengthen to compensate. Optical sections 5 × 0.4 μm.
In the primate fovea, the central region of highest visual acuity, cones are reduced to their minimal size to enhance packing density and hence visual acuity. In this area, there is a depression, known as the foveal pit, where overlying neurons are displaced to reduce light scattering. Staining with 7G6 showed that the cone axons, known as Henle fibers, ran radially away from the center to terminate in an annular zone of cone pedicles (Fig. 1B). Focusing at this level revealed a tightly packed array of cone pedicles near the fovea where rods are sparse.
At an eccentricity of 0.3 mm, there were ∼25,000 cones/mm2 and the cone pedicles formed a two-dimensional array, often touching at the perimeter (Fig. 1C). In this region, the cone pedicles were interconnected by very short, very fine telodendria, which were only 0.8 ± 0.3 μm (n = 54) in length. Away from the fovea, the spacing between the cone pedicles increased as the density fell (∼6000 pedicles/mm2) and, consequently, the telodendria were longer (Fig. 1D). In mid- and far-peripheral retina, the cone telodendria were 2.3 ± 0.9 μm (n = 128) and 3.9 ± 1.8 μm (n = 97) long, respectively. The longest telodendria occurred in far peripheral retina, reaching a maximum length of ∼10 μm. The cone coverage (telodendrial field area × cone density) was 1.2 in the peripheral retina, so that the telodendria touched their immediate neighbors. As the length increased, the cone telodendria formed lobules at their tips. In mid-peripheral retina, each pedicle had 8.6 ± 1.6 (n = 11) telodendria that reached out to touch the neighboring cones. These results are consistent with studies of human retina, where there are 4–7 telodendria per cone, which contact surrounding cones, and the length ranged from 2 to 10 μm (Ahnelt et al., 1990). Sometimes, the telodendria projected predominantly in one lateral direction (see Fig. 4), and this could produce a skewed population of dye-coupled cells, as reported for primate retina (Hornstein et al., 2005). It is important to note that cone telodendria extended laterally. They did not run distally to penetrate the outer nuclear layer. Rather, cone telodendria were confined to the OPL.
Figure 4.
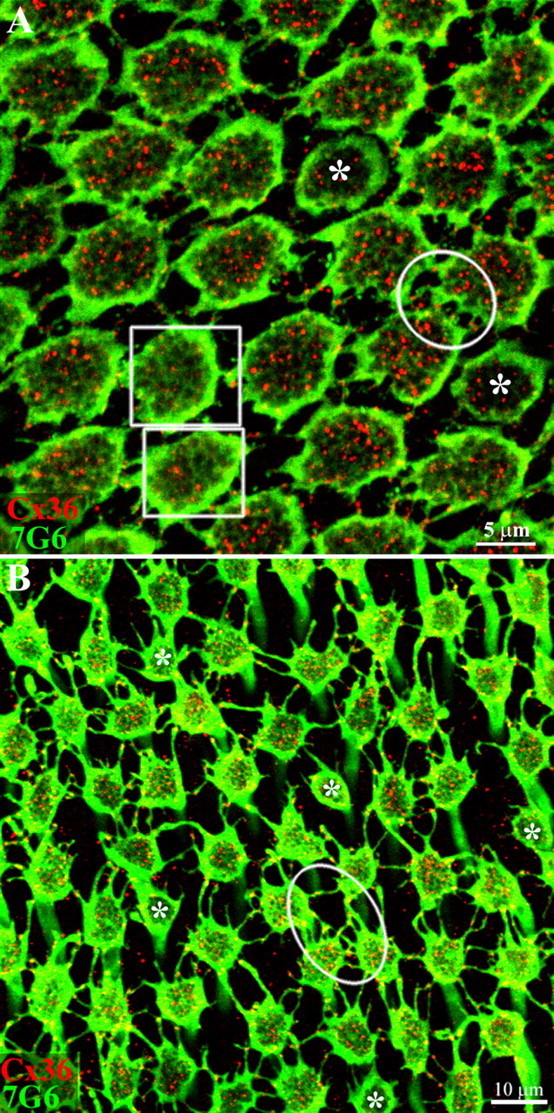
Cx36 forms gap junctions between red/green cones. Macaque retina was viewed in whole-mount with the level of focus at the base of the cone pedicles in the OPL. A, In central retina, cone pedicles stained for 7G6 (green) were tightly packed, frequently with direct contacts between neighboring pedicles. In addition, there are many small processes or telodendria, which contact adjacent pedicles. The Cx36 labeling within the perimeter of each cone pedicle is due to the presence of Cx36 gap junctions beneath the cone pedicle (red). In two pedicles (+) (boxes) that are slightly higher, the synaptic invaginations (holes) in the pedicle base begin to blur and fill in and the Cx36 labeling underneath is markedly reduced. Two smaller, potentially blue cone pedicles are marked with asterisks. It should be noted that Cx36 plaques occur at nearly all direct or telodendrial contacts between red/green cone pedicles. For example, a well labeled group of Cx36 gap junctions are stained within the circle. Optical sections 6 × 0.4 μm. B, In peripheral retina, the cone pedicles are more widely spaced and the telodendria are more obvious. Again, Cx36 plaques occur at telodendrial contact points between neighboring cone pedicles (oval). A few presumed blue cone pedicles, marked with asterisks, have very few telodendria or Cx36 contacts. Optical sections 6 × 0.4 μm.
Synaptic invaginations at the cone pedicle
Cone pedicles are relatively large polygonal structures. Each cone pedicle may contain as many as 40 synaptic ribbons and hundreds of postsynaptic dendrites contact each cone pedicle (Chun et al., 1996; Haverkamp et al., 2000). Thus, it has been suggested that cone pedicles form the most complex synapse in the brain. With the level of focus at the base of the cone pedicle, there were many dark holes in the pattern of 7G6 labeling (Figs. 1C,D, 2). These could be indentations or synaptic invaginations in the base of the cone pedicle. To test this idea, we prepared material in which some of the postsynaptic processes were also labeled.
Figure 2.
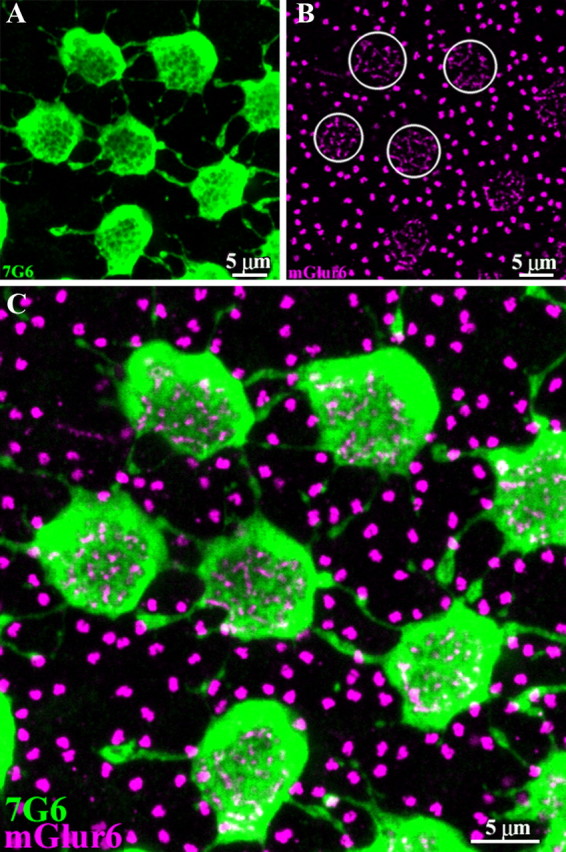
7G6 antibodies outline synaptic invagination sites. A, A high-resolution image of 7G6-labeled cones shows several cone pedicles interconnected by telodendria. Some cone telodendria appear to have enlarged endings in peripheral retina. As in Figure 1, there are holes in the central base of each cone pedicle. B, The tips of ON cone bipolar cells and rod bipolar cells contain mGluR6. Antibodies against mGluR6 (magenta) stain two distinct structures in the outer plexiform layer. The tips of ON cone bipolar cells appear as clusters of small mGluR6-labeled processes, which invaginate the cone pedicle (several circled). The tips of rod bipolar cells appear as brightly stained doublets that occupy the space between cone pedicles. These also indicate the positions of unlabeled rod spherules. C, Double-label image shows that the holes in the center of 7G6-labeled cone pedicles colocalize with the mGluR6 signals of ON cone bipolar cells. This indicates that the dendritic endings of ON cone bipolar cells enter each hole in the base of the cone pedicle. Therefore, the holes represent synaptic invagination sites and indicate that the level of focus is at the very base of the cone pedicle. Optical sections 5 × 0.5 μm.
The sites of chemical synaptic communication at the cone pedicle are at synaptic invaginations, immediately beneath the synaptic ribbons. The dendrites of second-order neurons, particularly horizontal cells and ON-cone bipolar cells, enter the synaptic invagination and approach closely to the synaptic ribbon (Haverkamp et al., 2000). In the mammalian retina, the dendritic tips of ON-cone bipolar cells and rod bipolar cells can be labeled with antibodies against the metabotropic glutamate receptor, mGluR6 (Vardi et al., 2000; Li et al., 2004). In whole-mount retina, labeling for mGluR6 produced a stereotypical pattern in the outer plexiform layer (Fig. 2B). Two distinct structures were present. The large clusters of fine, lightly stained terminals were ON-cone bipolar cell dendrites. Some of these clusters were circled and each one coincided with the presence of a cone pedicle. In addition, brightly labeled, immediately adjacent, doublets represented the tips of two, or rarely three, rod bipolar cell dendrites that invaginated each rod spherule. These structures were abundant because rods greatly outnumber the cones.
In a high-resolution view of the double-labeled material, it can be seen that the faint mGluR6 clusters (magenta) occurred within the dark holes of the 7G6-labeled cone pedicles (green) (Fig. 2C). Every hole contained an mGluR6-labeled postsynaptic process. This showed that the cone arrestin antibody, 7G6, outlined the synaptic invaginations at the base of the cone pedicle. In turn, the presence of holes in the 7G6 pattern indicated that the level of focus was at the very base of the cone pedicle. The clear labeling of cone pedicles and their telodendria with this antibody permitted a detailed evaluation of cone-to-cone contacts.
Connexin36 in the outer plexiform layer
In the first reports of Cx36 in the mammalian retina, a faint signal was noted in the OPL. However, the exact location could not be determined because the first Cx36 antibodies had a relatively low affinity (Feigenspan et al., 2001; Mills et al., 2001). In mouse retina, cones were shown to express Cx36-EGFP but much of the labeling was at a postsynaptic location beneath the cone pedicles (Feigenspan et al., 2004). In the primate retina, Cx36 gap junctions occurred in both the outer and inner plexiform layers (Fig. 3A). The Cx36 labeling in the OPL consisted of small puncta distinctly clustered in small patches which occurred periodically. In contrast, the intense labeling of large plaques in the lower part of the IPL (sublamina b) was consistent with the expected labeling of the AII amacrine cell network. Visual inspection suggests that the OPL gap junctions are smaller than the gap junctions in the AII network.
Figure 3.
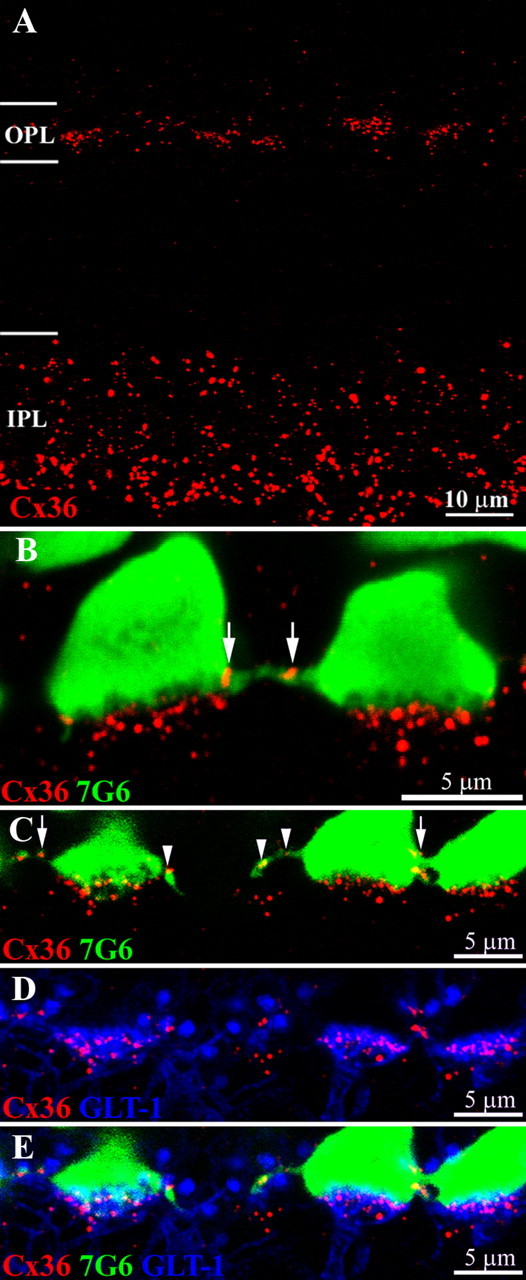
Cx36 labeling occurs both between and underneath cone pedicles. A, A cross section of macaque retina shows Cx36 labeling in both plexiform layers. The prominent Cx36 labeling in the inner IPL is mainly associated with AII amacrine cells. In comparison, the Cx36 labeling in the OPL is fainter; the plaques are smaller and form clusters. B, Double labeling shows that Cx36 plaques occur in two locations: on fine processes between 7G6-labeled cone pedicles (arrows) and in prominent clusters underneath each cone pedicle. The Cx36 plaques underneath the cone pedicle are distinct from and do not colocalize with the base of the cone pedicle. C–E, Triple label images from vertical sections of macaque retina. C, Cone pedicles are stained with 7G6 (green). Cx36 plaques (red) occur at cone pedicle contacts (arrows) and on fine processes leaving the cone pedicle base (arrowheads). D, Certain OFF bipolar cells, including OFF midget bipolar cells and DB2, are labeled with antibodies against the glutamate transporter GLT-1 (blue). The OFF bipolar dendrites terminate in flat tops, apposed to the base of the cone pedicle. Most of the Cx36 labeling underneath the cone pedicles is colocalized with the OFF bipolar dendrites. E, Triple label image shows that the Cx36 plaques below each cone pedicle are colocalized with GLT-1 stained OFF bipolar cells and not with the cone pedicle. All panels, 6 × 0.4 μm optical sections.
Double labeling with the 7G6 antibody revealed that the Cx36 clusters were associated with cone pedicles (Fig. 3B,C). However, Cx36 appeared to be distributed in two distinct locations. Cx36 plaques occurred underneath the cone pedicles as well as between the cone pedicles. Close examination of the high-resolution image in Figure 3B showed that the base of each cone pedicle was scalloped. These indentations correspond to the holes in the base of 7G6-labeled pedicles which we have identified as synaptic invaginations (Fig. 2). The Cx36 labeling underneath the cone pedicles lay distinctly below the scalloped edge of the cone pedicle and did not extend into the cone pedicle. These Cx36 gap junctions may represent the gap junctions between postsynaptic dendrites as they converge below the cone pedicle. In contrast, the Cx36 labeling between the cone pedicles was colocalized with 7G6 (Fig. 3B, arrows) and occurred at telodendrial contacts between neighboring cones.
We also looked for Cx36 plaques deeper in the outer nuclear layer, among the photoreceptor cell bodies, as reported for salamander retina (Zhang and Wu, 2004). However, we could find no pattern indicating gap junction structures. There are a very few red dots for Cx36 in this area but there is no structure to them and they are randomly distributed. Considering the lack of structure and seemingly random distribution, we attribute this to a small amount of noise or background labeling.
In the primate retina, certain OFF-cone bipolar cells, including DB2 and OFF midget bipolar cells, may be labeled with an antibody against the glutamate transporter GLT-1 (Grünert et al., 1994). In Figure 3, D and E, bipolar cell dendrites can be seen ascending from the inner nuclear layer to terminate in flat tops, apposed to the base of the cone pedicle. In addition, the large round structures, which occurred between the cone pedicles, are the dendritic tips of rod bipolar cells where they invaginate individual rod spherules. The significance of a glutamate transporter at this location is unknown but the presence of GLT-1 on rod bipolar cell dendrites has previously been reported (Reye et al., 2002). Triple labeling confirmed that the Cx36 labeling beneath the cone pedicle was colocalized with OFF bipolar cell dendrites (Fig. 3D,E). However, additional Cx36 labeling between the cone pedicles occurred at contact points (arrows) or on fine processes that extended laterally from the cone pedicle (arrowhead).
The cluster of Cx36 labeling beneath each cone pedicle has previously been observed in mouse and primate retina (Feigenspan et al., 2004; Cuenca et al., 2005) and Cx36 was colocalized with OFF bipolar cell markers in the mouse retina (Feigenspan et al., 2004). The dendrites of OFF bipolar cells may also express Cx45 but Cx45 is not colocalized with Cx36 in the OPL (Hilgen et al., 2011). The function of these gap junctions is unknown but dye coupling between different bipolar cell types has been reported (Mills, 1999). In the primate retina, small gap junctions were identified between the dendrites of ON bipolar cells, OFF bipolar cells and horizontal cells as they made their way to the cone pedicle (Raviola and Gilula, 1975). Horizontal cells in other mammals express either Cx50 or Cx57 and mouse horizontal cells did not express Cx36 (Deans and Paul, 2001; Mills et al., 2001; Massey et al., 2003; Feigenspan et al., 2004; Hombach et al., 2004; O'Brien et al., 2006; Janssen-Bienhold et al., 2009). Thus, it is unlikely that horizontal cells contribute to the Cx36 gap junctions underneath primate cone pedicles.
Connexin36 occurs on cone telodendria
So far, we have shown that Cx36 occurred at two locations in the OPL: between and underneath the cone pedicles. To focus on the gap junctions between cone pedicles, we wished to exclude the Cx36 labeling underneath the cone pedicle. This was easily accomplished because, in whole-mount preparations, the Cx36 labeling beneath the cone pedicle was almost completely contained within the perimeter of the cone pedicle (Fig. 4). The conspicuous synaptic invaginations indicated that the level of focus was at the base of the cone pedicle. Where the holes started to blur and fill in, because a few pedicles were slightly higher (boxes, Fig. 4), the density of Cx36 labeling underneath the cone pedicle was strongly reduced because it was just out of focus.
In central retina (Fig. 4A), the cone pedicles were closely packed in a two-dimensional array. Many of the cone pedicles were close enough to touch and others extended very fine telodendria to make contact with adjacent pedicles. Double labeling showed that Cx36 plaques (red) occurred at nearly every contact point between cone pedicles. Within the circle, for example, there were numerous Cx36 gap junctions between neighboring cone pedicles. In this image, the red and green cones were indistinguishable. However, the asterisks indicate the presence of two small and unusual cone pedicles. These were probably blue cone pedicles (see below) and, even at this low resolution, it is clear they had few telodendria and made almost no Cx36 gap junctions with the surrounding cones.
In peripheral retina, the cone pedicles were widely spaced and the telodendria were much more prominent but still confined to the OPL (Fig. 4B). Every red/green cone pedicle extended several lateral telodendria that usually contacted every member in the surrounding ring of cone pedicles. Occasionally, a telodendron terminated before reaching a neighboring cone. Double labeling showed clearly that the contact points between telodendron and neighboring cone pedicles were nearly always decorated with a Cx36 plaque. We have learned that this pattern of labeling, when Cx36 plaques occur at contact points, is diagnostic for gap junction labeling and similar to the pattern reported at dendritic crossings and intersections in the AII matrix (Mills et al., 2001). In addition, a few smaller, potentially blue, cone pedicles with poorly developed telodendria were marked by asterisks. They accounted for 5 of ∼60 cone pedicles in this image, close to the number expected for blue cones. Again, it was important to exclude the Cx36 plaques within the perimeter of 7G6 labeling which were due to the presence of gap junctions between synaptic processes underneath the cone pedicle. Essentially all the Cx36 gap junctions between the cone pedicles were colocalized with cone telodendria. Thus, in the OPL, the network of fine telodendria is the substrate for cone-to-cone coupling in the primate retina.
In a high-resolution image from peripheral retina (Fig. 5), Cx36 plaques occurred at all 10 cone contacts made by the single cone pedicle in the center. It should be emphasized that an image like this cannot be obtained by accident and it can never be due to background or nonspecific labeling. The consistent pattern of Cx36 labeling at specific telodendrial contact points lends great confidence in the specificity of Cx36 labeling. The image is a short stack of six optical sections chosen to include the salient features of the central cone. Some of the other cone pedicles in this field (lower central) had telodendria that terminated before reaching an adjacent cone pedicle. These may be sites of rod spherule contact (see below). On the left side of the image, the telodendria make contacts outside the image plane. The cone pedicle in the bottom right corner is a small putative blue cone pedicle. Its telodendria leave the image plane but do not contact neighboring cones.
Figure 5.

Cx36 plaques occur precisely at telodendrial contacts between adjacent cone pedicles. A high-magnification image of 7G6-labeled cones (green) shows Cx36 (red) forms gap junctions at all 10 cone contacts of a single cone pedicle. This cone has Cx36 plaques at 8 telodendrial contacts (vertical arrows) and at 2 basal contacts from neighboring cones. The number of gap junctions may exceed the number of telodendria because some neighboring telodendria make gap junctions with the base of the cone pedicle (horizontal arrow). In addition, autologous telodendrial contacts may also occur where one telodendria forms a gap junction with another telodendria, originating from the same cone pedicle (arrowhead). Some telodendria on the left side make contacts outside the image plane. Optical sections 6 × 0.31 μm.
Several different types of contact were observed in this image. First, there were prominent gap junctions at the contact points between telodendria and the base of the cone pedicle, shown by horizontal arrows. Second, there were Cx36 gap junctions at contacts between telodendria from different cones (vertical arrows). Thirdly, autologous contacts occurred when one telodendron forms a gap junction with another telodendron originating from the same cone pedicle (arrowhead). At this site, the lower telodendron only contacted the upper telodendron, which extended to the adjacent cone pedicle.
The central cone in this image has eight telodendria, all of which made Cx36-labeled contacts with adjacent cone pedicles. In addition, two Cx36-labeled basal contacts were made by the telodendria of neighboring cones. Thus, the number of gap junctions on a single cone pedicle may exceed the number of telodendria because of basal contacts from neighboring cones. When we counted the cone contacts and the number of telodendria in this material, we found that each cone had an average of 8.6 ± 1.6 (n = 11) telodendria, but each cone had an average of 9.6 ± 1.4 (n = 11) contacts with other cones. In this region, each cone contacted 4.4 ± 0.8 (n = 11) neighboring cones with 2.2 ± 0.4 (n = 11) telodendrial contacts between two cones. The average number of telodendria in our material is slightly more than the 4–7 telodendria found on human cones (Ahnelt et al., 1990) perhaps because the area analyzed was from a more peripheral region of the retina.
In whole-mount primate retina, the average size of a Cx36 plaque at cone-to-cone contacts was 0.28 μm2. These immunolabeled plaques most likely represent adherens junctions, which are regions of close membrane apposition, punctuated by small gap junctions. In primate fovea, the adherens junctions were comparable in size (0.2 μm2) although the gap junctional area was much smaller (0.005 μm2 or 2.5%) (Tsukamoto et al., 1992). If an entire plaque were composed of Cx36 channels at a density of 10,000 gap junction channels/μm2 (center-to-center spacing, 10 nm; Caspar et al., 1977; Peracchia, 1977; Bukauskas et al., 2000; Palacios-Prado et al., 2009), this would maximally yield 2800 gap junction channels for each plaque. However, the fraction of open channels is extremely low, estimated as ∼1% (Bukauskas et al., 2000; Palacios-Prado et al., 2009). If the number of Cx36 contacts between adjacent red/green pedicles ranges from 1 to 4 then there may be 28–112 open channels between adjacent cones. (The contribution of additional input via a third intermediary cone or rod is probably negligible.) Taking 15pS as the single channel conductance for a Cx36 channel (Srinivas et al., 1999), we estimate the conductance between two cones would be 420–1680pS. This is comparable to physiological results from paired recordings between primate or ground squirrel cones where an average conductance of 650pS or 220pS respectively was reported between adjacent cones (Hornstein et al., 2004; Li and DeVries, 2004). These calculations, though necessarily approximate, suggest that the Cx36 plaques we observed between cones are sufficient to provide the basis for cone-to-cone coupling. It should be noted that the calculations also represent an upper limit because the resolution of confocal microscopy does not reveal the underlying substructure of the gap junctions. Furthermore, the open fraction of gap junction channels is very low yet may be dynamically regulated over a 20-fold range under various physiological conditions (Li et al., 2009).
Blue Cones make Few, Small Cx36 Gap Junctions
Blue or S-cones, which account for <10% of cones in the primate retina (Martin and Grünert, 1999), are unique because of their morphology, pigment and connections (Kolb et al., 1997; Martin and Grünert, 1999; Nathans, 1999). They form a sparse, but regular mosaic with a blue cone free zone at the fovea (Ahnelt et al., 1990; Curcio et al., 1991). The morphology of blue cones is slightly different from red/green cones: (1) the inner segment is longer and wider, (2) the pedicle is smaller (Ahnelt et al., 1990), (3) blue cone pedicles penetrate a little deeper into the outer plexiform layer (Ahnelt et al., 1990), (4) they have shorter and more densely packed ribbons, and (5) very few or no telodendria (Ahnelt et al., 1987, 1990; Curcio et al., 1991; Kolb et al., 1997; Calkins, 2001). Blue cones contact a blue cone (S-cone) bipolar cell, a type of ON cone bipolar cell notable for long dendrites, which by pass red/green cones to contact blue cones exclusively (Kouyama and Marshak, 1992). In turn, the blue cone bipolar cell synapses with a small bistratified ganglion cell to generate a blue-ON/yellow-OFF signal (Dacey, 1993; Dacey and Lee, 1994; Calkins et al., 1998; Crook et al., 2009).
To evaluate the Cx36 distribution of blue cones, individual blue cones within a red/green cone array were identified using an antibody against blue cone opsin, which intensely labeled the blue cone outer segments and lightly stained the inner segments and somas (Fig. 6). Sometimes, the axons and pedicles were faintly labeled at high antibody concentrations, as previously reported (Martin and Grünert, 1999). However, we found it more reliable to follow the antibody staining down through a confocal stack also labeled with 7G6 to identify individual blue cone pedicles. Blue cone pedicles were noticeably smaller than the red/green pedicles; central, blue: 27.1 ± 1.0 μm2 (n = 7); red/green: 48.2 ± 2.8 μm2 (n = 24); peripheral, blue: 47.6 ± 3.1 μm2 (n = 11); red/green: 66.8 ± 5.1 μm2 (n = 114). In peripheral retina, blue cone pedicles frequently had one long process, in addition to several short telodendria that rarely reached the neighboring cone pedicles. These characteristics made it relatively simple to pick out the blue cone pedicles in a mosaic.
Figure 6.

Blue cones form smaller and fewer Cx36 gap junctions. A, The outer segments of primate cones were labeled with a cone arrestin antibody (7G6). In addition, blue cone outer segments were stained with antibodies against blue cone opsin (BCO). B, The labeling could be followed through the confocal stack down to the cone cell bodies. C, The blue cone opsin and 7G6 labeling were followed further in the confocal series to identify blue cone pedicles in the array of green/red cone pedicles. Blue cone pedicles, marked by asterisks, were smaller with fewer telodendria. There was robust Cx36 labeling (red) at telodendrial contacts between cones, some of which are circled. In contrast, the telodendria of blue cones were mostly too short to reach adjacent cones. Two longer telodendria were not labeled for Cx36 (arrows).
Two blue cone pedicles with typical morphology are marked by asterisks in Figure 6C. These correspond to the well stained outer segments shown in Figure 6A. Double labeling for Cx36 showed extensive gap junctional contacts between red/green cones as above. In contrast, most of the telodendria from the blue cone pedicles did not reach their neighbors. Two longer processes which have the potential to contact an adjacent cone are not labeled for Cx36. However, occasionally we found small Cx36 plaques between blue cone pedicles and an adjacent red/green cone, although they were often equivocal and some could also be rod contacts (see below). This stands in clear contrast to the robust telodendrial contacts bearing Cx36 plaques between red/green cones in the circled areas of the same field (Fig. 6C). Red/green cone pedicles had 11.3 ± 3.2 Cx36 plaques per cone (n = 46) compared with only 2.3 ± 1.3 Cx36 plaques per blue cone pedicle (n = 10). This means that most of the 5–6 pedicles in the adjacent ring, which must all be red/green cones, are not coupled to a blue cone pedicle. Furthermore, the blue cone gap junctions were smaller (0.21 ± 0.09 μm2, n = 9) than those made by red/green cone pedicles (0.28 ± 0.14 μm2, n = 76). However, the difference in size was not statistically significant (p < 0.1) by two sample t test using unequal variance. These results confirm previous work where occasional gap junctions with blue cone pedicles were reported for human and macaque retina (Tsukamoto et al., 1992; Kolb et al., 1997).
Primate cone telodendria make Cx36 gap junctions with rod spherules
In several species, freeze fracture and electron microscopic analysis has shown that processes from cone pedicles make gap junctions with neighboring rod spherules and cone pedicles (Raviola and Gilula, 1973; Smith et al., 1986; Ahnelt et al., 1990; Tsukamoto et al., 1992, 2001; Kolb et al., 1997; Lee et al., 2003). Furthermore, there is compelling physiological evidence for rod-to-cone coupling (Li et al., 2010). In our material, we occasionally noticed isolated telodendria that terminated away from other cone pedicles or cone telodendria (Fig. 7A,C). However, there were still Cx36 plaques associated with these structures and this suggests the presence of rod/cone coupling. Rod spherules, like cone pedicles, are abundantly filled with synaptic vesicles. Therefore, we prepared triple-labeled material where, in addition to 7G6 and Cx36, rod spherules were labeled with antibodies against synaptic vesicle proteins such as synaptophysin or SV2b. In this material, rod spherules appeared as bright round structures, 2–3 μm in diameter, which filled the spaces in between the much larger cone pedicles. Each rod spherule had a dark central region, devoid of synaptic vesicles, which corresponds to the single synaptic invagination (Fig. 7). The rod spherules were slightly distal to the cone pedicles forming a band ∼3 μm thick. Individual cone pedicles penetrated the band of rod spherules (Fig. 8).
Figure 7.
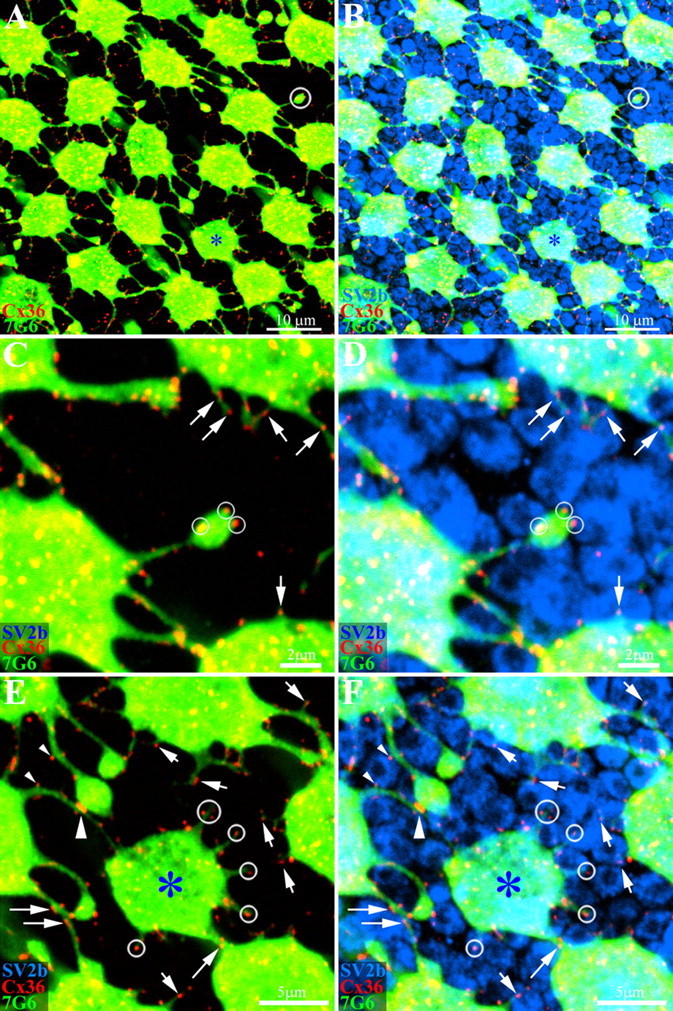
Primate cones make Cx36 gap junctions with rod spherules. Whole-mount macaque retina was stained with antibodies against cone arrestin (7G6, green), Cx36 (red) and SV2b (blue), to stain rod spherules. A, A mosaic of cone pedicles in peripheral retina. A blue cone pedicle is marked with an asterisk. As before, there are many Cx36 plaques at telodendrial contacts. In addition, a few telodendria terminate in isolation (circle, top right). B, The same field shows that the space between cone pedicles is mostly filled by rod spherules stained for SV2b. C, High-magnification image of the isolated telodendron from A shows clear Cx36 plaques, even in the absence of adjoining cones pedicles (small circles). In addition, many other small telodendria, also bearing Cx36 plaques, project from a cone pedicle base (arrows). D, The isolated cone telodendron is surrounded by rod spherules and the Cx36 plaques occur at contact points with rod spherules (small circles). The Cx36 plaques on short telodendria also contact rod spherules (arrows). E, The blue cone pedicle also has many fine telodendria, too short to reach adjacent cones. One that approaches a nearby cone has Cx36 plaques aligned with rod spherules (diagonal arrow). In addition, Cx36 plaques may be observed along a telodendrial shaft (long arrows). F, Cx36 plaques on the blue cone telodendria are aligned with the surrounding rod spherules (circles). Some rod spherules have Cx36 contacts with the blue cone pedicle and an adjacent cone pedicle. Two small Cx36 plaques from different telodendria contact opposite sides of a single rod spherule (small arrowheads). Further down, there is a much larger cone-to-cone gap junction (large arrowhead). In summary, many fine telodendria form all types of cones make small Cx36 gap junctions with surrounding rod spherules (small arrows). A–D, 4 × 0.4 μm optical sections; E, F, 3 × 0.4 μm optical sections.
Figure 8.
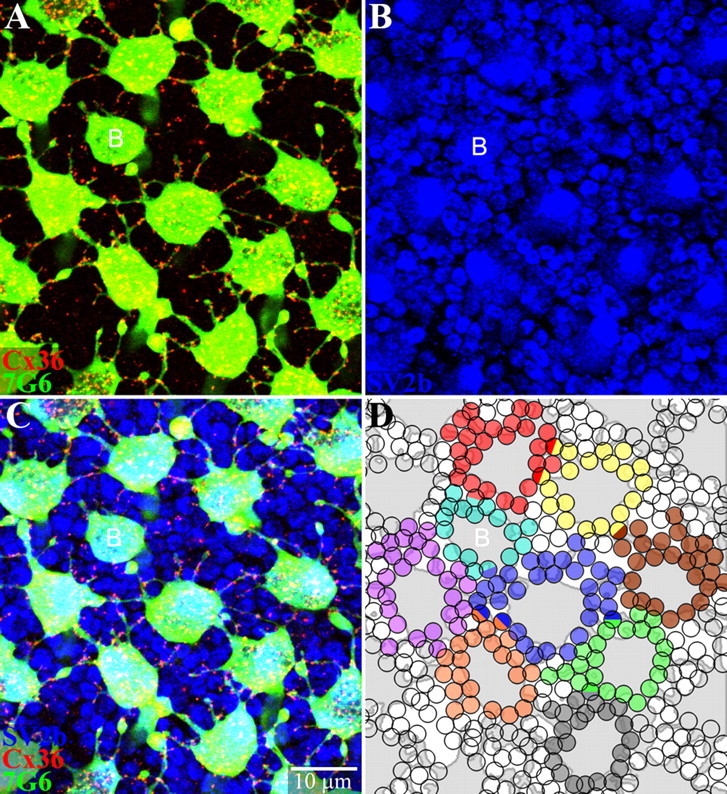
Cone pedicles make potential Cx36 gap junctions with most surrounding rod spherules. A, A mosaic of cone pedicles stained with 7G6 (green). Many telodendria, long and short, are decorated with Cx36 plaques (red). A single small blue cone pedicle is marked with a letter B. B, Same field showing rod spherules, which are round with a dark central spot stained for SV2b (blue). Cone pedicles are larger polygonal structures. C, Triple-label image shows Cx36 contacts with many neighboring rods and cones. D, A reconstruction of part of the cone pedicle mosaic. The cone pedicles were outlined and colored gray. Each rod spherule receiving a Cx36 telodendrial contact was shaded with one color indicating contacts from a single cone pedicle. A few rods receiving Cx36 contacts from two different cones were coded as hemispheres of two colors, including at least two rod spherules with blue input. The small telodendria extend for 2–3 rows of rod spherules around each cone pedicle. Almost every rod spherule receives potential gap junction contacts. Red/green cone pedicles contacted 20–30 adjacent rods. A single blue cone pedicle (B) made potential contacts with 16 rod spherules. Optical sections 6 × 0.3 μm.
Because the putative cone-to-rod gap junctions were small and faint, we also increased the concentration of Cx36 antibody (1:250) and carefully set the threshold to include faint signals. An array of cone pedicles surrounded by rods is shown in Figure 7 and one blue cone pedicle is marked with an asterisk. As before, Cx36 was found on many telodendrial contacts between adjacent cone pedicles. One isolated process was circled in Figure 7A and the frame was enlarged in Figure 7C. Three Cx36 plaques were located on the swelling at the end of this telodendron but there were no cone processes within several micrometers. Instead, the SV2b labeling showed three rod spherules in close proximity to the Cx36 plaques (Fig. 7D). Telodendria that contacted other cones could also make gap junctions with rod spherules in passing. In Figure 7, E and F, processes from two different cones had Cx36 plaques that were closely aligned on opposite sides of a single rod spherule (small arrowheads). Further down, the two telodendria met and a large cone-to-cone Cx36 plaque was formed at the contact point (large arrowhead). Many of the apparent cone-to-rod Cx36 plaques were associated with a small swelling or bud from the parent process. This appeared to be a common structural motif and this pattern argues against nonspecific labeling or noise.
In addition to the large telodendria, several very fine processes emanated from the base of the cone pedicle and approached closely to adjacent rods. These short processes were also labeled for Cx36, often at their tips, to form apparent gap junctions with neighboring rod spherules (Fig. 7C, arrows). In this material (from nasal periphery), the telodendria that contacted adjacent cones were 2.95 ± 2.07 μm (n = 97) in length, whereas the cone processes contacting rods were only 1.55 ± 1.09 μm (n = 87) long. This reflects the wide spacing of the cone array in the peripheral retina compared with the close proximity of nearby rods. A size analysis of the putative Cx36 gap junctions showed that the cone-cone plaques were 2.3 times larger in area than the rod-cone plaques (cone-cone: 0.28 ± 0.20 μm2, n = 85; rod-cone: 0.12 ± 0.06 μm2, n = 63) (p < 0.001 by two sample t test with unequal variance). Thus, the Cx36 plaques at apparent rod-cone contacts were close to the resolution limit for confocal microscopy. We propose that these small Cx36 plaques are rod/cone gap junctions.
Blue cone pedicles also had many short telodendria. They were decorated with small Cx36 plaques that appear to be aligned with adjacent rod spherules (circled, Fig. 7E,F). Blue cone telodendria rarely reached adjacent cones. Consequently, blue cones made the majority of their gap junction contacts with rods (blue cone pedicle: rod-contacts: 90.1 ± 7.6%, n = 37; cone-contacts: 9.9 ± 7.6%, n = 37). In contrast, red/green cone pedicles had more cone than rod contacts (red/green cone pedicles: rod-contacts: 30.5 ± 12.3%, n = 49, cone-contacts: 69.5 ± 12.3%, n = 94). We conclude that blue cone pedicles make few contacts with other cones but they make numerous gap junctions with rods. In summary, all cones, red/green and blue, make gap junctions with neighboring rods.
Rod spherules sometimes had several Cx36 plaques and could make contact with two different cone pedicles. Occasionally, one cone could be red/green and one blue cone pedicle (Figs. 7F, 8D). These contacts would appear to connect a red/green cone to a blue cone via an intermediate rod spherule. Functionally, the consequence of this pathway is probably negligible. From Li et al. (2010), a 40 mV depolarization of a rod produced a 5 mV depolarization of a gap junction-coupled cone. Thus, the coupling coefficient is 0.125. To traverse a pathway from cone → rod → cone, requires passing through two gap junctions so the coupling coefficient would be 0.125 × 0.125 = 0.016 or 1.6%. A very large cone response of 40 mV would produce a near threshold response in another cone coupled via an intermediary rod of 0.64 mV. We should add that 40 mV in the first cone is a very large response which might prove difficult to achieve selectively for a single cone without activating other cones or rods. Hyperpolarizing the intermediate rod would further diminish the hypothetical signal transfer.
In peripheral retina, rods far outnumbered cones by a factor of 20:1. To determine what fraction of the rod population was coupled to cones, we mapped all the gap junction contacts in a small area of peripheral retina (Fig. 8). In this example, we counted 18 cone pedicles and 400 rod spherules, yielding a rod/cone ratio of 22. Cone-to-rod gap junctions were scored if Cx36 plaques were colocalized with telodendria in close proximity to a rod spherule. Cx36 plaques between telodendria were counted as cone-to-cone or autologous gap junctions. A small number of red dots not associated with a 7G6-labeled process were discounted as noise. An array of cone pedicles with many fine telodendria bearing numerous small Cx36 gap junctions is shown in Figure 8A as a mini-stack of six consecutive 0.3 μm confocal sections. The SV2b stained rod spherules, which filled the space between the cone pedicles, sometimes overlapped at slightly different depths but they could be followed through the confocal stack (Fig. 8B). The band of rod spherules was ∼3 μm thick, largely coincident with the reach of cone telodendria. Cone telodendria did not enter the outer nuclear layer.
A mini-stack of triple-labeled confocal sections is shown in Figure 8C. All apparent rod contacts were followed through the confocal stack. Rod spherules were assigned to each cone pedicle and color-coded as shown in Figure 8D. Many immediately adjacent rod spherules had potential Cx36 contacts with the base of the cone pedicle. In addition, small telodendria extended to the second ring of rod spherules and sometimes further. Occasionally, a single rod spherule received contacts with two cone pedicles. The single cone pedicle in the middle of Figure 8 made potential Cx36 gap junctions with 30 rods, a greater number than we had anticipated. On average, each cone pedicle made telodendrial Cx36 contacts with 25 ± 3.4 rod spherules (n = 8). The single blue cone pedicle in this patch contacted 16 rod spherules. There were very few rod spherules (<5%), only those at the mid-point between widely spaced cones, which did not make contact with a Cx36-labeled telodendron. We conclude that most rods make gap junction contacts with the cone mosaic.
Discussion
Connexin36 in the outer plexiform layer
There is strong evidence that cones express Cx36 in several species. Cx36 labeling was found in dye-injected cones from mouse retina, in the cytoplasm of cones from guinea pig retina and on short processes between cones of the ground squirrel retina (Lee et al., 2003; Feigenspan et al., 2004; Li and DeVries, 2004). In the primate retina, there was a very high probability of finding a Cx36 plaque at a telodendrial contact between two cone pedicles. In one high-resolution example, 10/10 examples had Cx36 staining at the contact points (Fig. 5). The consistent location of Cx36 plaques precisely at the contact points indicates that cone-to-cone coupling is mediated by Cx36 gap junctions. It is analogous to the restriction of Cx36 to dendritic crossings and contact points in the matrix of AII amacrine cells (Mills et al., 2001). We have learned that this type of pattern is diagnostic for gap junction labeling. The location of Cx36 plaques at telodendrial contacts confirmed previous ultrastructural data, which showed the presence of gap junctions at these points (Raviola and Gilula, 1973; Smith et al., 1986; Ahnelt and Kolb, 2000).
It was more difficult to identify cone-to-rod contacts with such confidence because the gap junctions could occur anywhere on the rod spherule, which is ∼2 μm in diameter. However, Cx36 plaques were usually found at the edge of the rod spherule or on the lower surface but never over the synaptic invagination (Figs. 7, 8). This is consistent with the location described in ultrastructural studies (Raviola and Gilula, 1973). Furthermore, the telodendria of blue cone pedicles and the shorter processes of red/green cone pedicles were consistently decorated with Cx36 puncta even though they did not reach adjacent cones. Finally, Cx36 plaques associated with rod spherules were significantly smaller than the cone-to-cone gap junctions. In the electron microscope, rod-to-cone gap junctions were described as point-to-point whereas the cone-to-cone gap junctions were more prominent and could be associated with a desmosome-like structure (Raviola and Gilula, 1973; Tsukamoto et al., 1992). Thus, it is very likely that these small Cx36 plaques represent rod/cone gap junctions.
Setting aside the small differences between red and green cones, cone-to-cone gap junctions are homologous, occurring between two cells of the same type. Gap junctions are assembled from two docked hemichannels which, in this example, may both be composed of Cx36. In contrast, rod-to-cone gap junctions are heterologous, between two different cell types. This may be accomplished by the use of Cx36 on the cone side but mouse rods did not express Cx36 (Feigenspan et al., 2004). In an EM study of guinea pig retina, Cx36 labeling was found on both sides of cone-to-cone gap junctions but only on the cone side of rod-to-cone gap junctions (Lee et al., 2003). Therefore, although rod-to-rod coupling mediated by Cx36 has been shown in salamander retina (Zhang and Wu, 2004, 2005), the identity of the rod connexin in the primate retina must be regarded as unknown. If, in fact, rods express a different connexin, then the rod/cone gap junctions would be heterotypic.
Photoreceptor coupling
Red/green cones were coupled indiscriminately. In contrast, blue cones rarely make Cx36 gap junctions with other cones, they are not dye-coupled to other cones and signals could not be passed between a blue/green pair (Hornstein et al., 2004; Li and DeVries, 2004). These results also confirm previous ultrastructural results that demonstrated telodendrial contacts between red/green cones but rarely with the morphologically distinct pedicles of blue cones (Kolb et al., 1997; Ahnelt and Kolb, 2000). The chromatic penalty for red/green coupling is minor but the situation is different for blue cones because the spectral absorption curve is far removed from the red and green curves (Hornstein et al., 2004; Li and DeVries, 2004). Furthermore, the sparse mosaic means that a single blue cone is always surrounded by a ring of different cones. It seems that blue cones may be electrically isolated to prevent a severe reduction in color discrimination (Hsu et al., 2000).
All cone types made Cx36 apparent gap junction contacts with the surrounding rods. However, cone-to-rod plaques were significantly smaller than the cone-to-cone plaques (0.12 μm2 versus 0.28 μm2). This is consistent with ultrastructural results which show that cone-to-rod contacts are point like (Raviola and Gilula, 1973; Smith et al., 1986; Tsukamoto et al., 1992, 2001). This leads to the prediction that coupling between rod/cone pairs will be smaller than for comparable cone pairs, although this was not the case in ground squirrel (Li et al., 2010). Rod signals could be directly recorded in cones and, following Neurobiotin injections, an average of 6 rods were dye-coupled to each injected cone with a range of 0–28 (Hornstein et al., 2005). The top of this range is comparable to the range, 20–30, mean = 23, obtained by the reconstruction of potential cone-to-rod contacts (Fig. 8). In peripheral retina, most rods are apparently coupled to the cone mosaic via Cx36 gap junctions with only 5% of rods isolated. This is similar to the mouse retina, where the potential convergence of rods-to-cones was 32 and only 12/98 rods were isolated (Tsukamoto et al., 2001).
Potential Cx36 gap junctions with neighboring rods were dominant for blue cones because of the lack of blue cone-to-red/green cone contacts. In primate retina, small bistratified ganglion cells carry a blue-yellow color opponent signal and receive a strong rod input with the same sign as blue cone input (Dacey and Lee, 1994; Crook et al., 2009; Field et al., 2009). Under low scotopic conditions, the rod input was mediated via the high-sensitivity rod → rod bipolar → AII amacrine cell pathway. This pathway saturates at a few R*/rod/s (Robson and Frishman, 1995; Trexler et al., 2005; Dunn et al., 2006) yet rod input was found under mesopic light levels in the range of 75–150 R*/rod/s before the color opponent signature of cone input was dominant (Crook et al., 2009; Field et al., 2009). Blue cone bipolar cells were identified by their sparse dendrites which by-pass other cones to contact blue cones (Mariani, 1984; Kouyama and Marshak, 1992). There was no evidence for direct contacts from rods. Thus, in the mesopic range, rod input to the blue-yellow ganglion cells may be mediated via gap junctions between blue cones and rods.
Dye coupling has also been observed between rods and this is consistent with the summation of low-intensity responses across a small pool of rods (Hornstein et al., 2005). Gap junctions between rods have also been observed in the mouse retina (Tsukamoto et al., 2001), but we did not find evidence for Cx36 coupling between rods in the primate retina. However, as noted above, it is possible that rods express a different connexin which could be responsible for coupling.
Functions of Photoreceptor Coupling
In general, photoreceptor coupling appears to fulfill several important functions. First, phototransduction is inherently noisy and cone-to-cone coupling improves the signal-to-noise ratio by correlating shared light driven signals while random noise from each cone is reduced by averaging across the network (DeVries et al., 2002). The small loss of spatial acuity as a result of coupling is less than the optical blur of the eye. The resulting gain in luminance sensitivity is partially offset by a minor reduction in spectral discrimination (Hsu et al., 2000; Hornstein et al., 2004). Coupling will also tend to diminish saturation for transmission to second-order neurons (Attwell et al., 1987).
Second, rod/cone coupling provides an alternative pathway for rod signals to enter cone pathways at intermediate light intensities (Smith et al., 1986). At threshold levels, the high-gain rod pathway via rod bipolar cells is operational but it is saturated at a few R*/rod/s (Robson and Frishman, 1995; Trexler et al., 2005; Dunn et al., 2006). Depending on species, up to 100 rods converge to each rod bipolar cell but at very low light levels few rods capture a photon. If only a small fraction of rods are excited, then there will be insufficient signal to influence adjacent cones via gap junctions. At mesopic intensities, there are enough photons to stimulate all rods simultaneously while the cone signals are still close to threshold. This is a favorable situation for rods to influence cones (Hornstein et al., 2005). ERG recordings with Cx36 knock-out mice also suggest that rod/cone coupling is active in the mesopic range (Abd-El-Barr et al., 2009).
It has long been proposed that rod/cone coupling should be modulated by light. Indeed, the circadian control of rod/cone coupling appears to be mediated by D2 dopamine receptors (Ribelayga et al., 2008). Rod/cone coupling is robust at night providing a pathway for rod input to horizontal cells which are exclusively connected to cones (Nelson, 1977; Ribelayga and Mangel, 2010). Gap junction modulation, by phosphorylation of Cx36 (Li et al., 2009), may serve to adjust rod/cone coupling to optimize rod and cone pathways for different light intensities (Smith et al., 1986).
Footnotes
This research was supported by National Eye Institute (NEI) Grants EY 06515 (to S.C.M.), EY 12857 (to J.O.), and EY 10608 (Vision Core Grant), G12-RR03034, and U54 NS060659 to P.R.M. Additional support was provided by an unrestricted grant from Research to Prevent Blindness to the Department of Ophthalmology and Visual Science. S.C.M. is the Elizabeth Morford Professor of Ophthalmology and Visual Science.
References
- Abd-El-Barr MM, Pennesi ME, Saszik SM, Barrow AJ, Lem J, Bramblett DE, Paul DL, Frishman LJ, Wu SM. Genetic dissection of rod and cone pathways in the dark-adapted mouse retina. J Neurophysiol. 2009;102:1945–1955. doi: 10.1152/jn.00142.2009. [DOI] [PMC free article] [PubMed] [Google Scholar]
- Ahnelt PK, Kolb H. The mammalian photoreceptor mosaic-adaptive design. Prog Retin Eye Res. 2000;19:711–777. doi: 10.1016/s1350-9462(00)00012-4. [DOI] [PubMed] [Google Scholar]
- Ahnelt PK, Kolb H, Pflug R. Identification of a subtype of cone photoreceptor, likely to be blue sensitive, in the human retina. J Comp Neurol. 1987;255:18–34. doi: 10.1002/cne.902550103. [DOI] [PubMed] [Google Scholar]
- Ahnelt P, Keri C, Kolb H. Identification of pedicles of putative blue-sensitive cones in the human retina. J Comp Neurol. 1990;293:39–53. doi: 10.1002/cne.902930104. [DOI] [PubMed] [Google Scholar]
- Attwell D, Borges S, Wu SM, Wilson M. Signal clipping by the rod output synapse. Nature. 1987;328:522–524. doi: 10.1038/328522a0. [DOI] [PubMed] [Google Scholar]
- Bloomfield SA, Völgyi B. The diverse functional roles and regulation of neuronal gap junctions in the retina. Nat Rev Neurosci. 2009;10:495–506. doi: 10.1038/nrn2636. [DOI] [PMC free article] [PubMed] [Google Scholar]
- Bukauskas FF, Jordan K, Bukauskiene A, Bennett MV, Lampe PD, Laird DW, Verselis VK. Clustering of connexin 43-enhanced green fluorescent protein gap junction channels and functional coupling in living cells. Proc Natl Acad Sci U S A. 2000;97:2556–2561. doi: 10.1073/pnas.050588497. [DOI] [PMC free article] [PubMed] [Google Scholar]
- Calkins DJ. Seeing with S cones. Prog Retin Eye Res. 2001;20:255–287. doi: 10.1016/s1350-9462(00)00026-4. [DOI] [PubMed] [Google Scholar]
- Calkins DJ, Tsukamoto Y, Sterling P. Microcircuitry and mosaic of a blue-yellow ganglion cell in the primate retina. J Neurosci. 1998;18:3373–3385. doi: 10.1523/JNEUROSCI.18-09-03373.1998. [DOI] [PMC free article] [PubMed] [Google Scholar]
- Caspar DL, Goodenough DA, Makowski L, Phillips WC. Gap junction structures. I. Correlated electron microscopy and x-ray diffraction. J Cell Biol. 1977;74:605–628. doi: 10.1083/jcb.74.2.605. [DOI] [PMC free article] [PubMed] [Google Scholar]
- Chun MH, Grünert U, Martin PR, Wässle H. The synaptic complex of cones in the fovea and in the periphery of the macaque monkey retina. Vision Res. 1996;36:3383–3395. doi: 10.1016/0042-6989(95)00334-7. [DOI] [PubMed] [Google Scholar]
- Crook JD, Davenport CM, Peterson BB, Packer OS, Detwiler PB, Dacey DM. Parallel ON and OFF cone bipolar inputs establish spatially coextensive receptive field structure of blue-yellow ganglion cells in primate retina. J Neurosci. 2009;29:8372–8387. doi: 10.1523/JNEUROSCI.1218-09.2009. [DOI] [PMC free article] [PubMed] [Google Scholar]
- Cuenca N, Herrero MT, Angulo A, de Juan E, Martínez-Navarrete GC, López S, Barcia C, Martín-Nieto J. Morphological impairments in retinal neurons of the scotopic visual pathway in a monkey model of Parkinson's disease. J Comp Neurol. 2005;493:261–273. doi: 10.1002/cne.20761. [DOI] [PubMed] [Google Scholar]
- Curcio CA, Allen KA, Sloan KR, Lerea CL, Hurley JB, Klock IB, Milam AH. Distribution and morphology of human cone photoreceptors stained with anti-blue opsin. J Comp Neurol. 1991;312:610–624. doi: 10.1002/cne.903120411. [DOI] [PubMed] [Google Scholar]
- Dacey DM. Morphology of a small-field bistratified ganglion cell type in the macaque and human retina. Vis Neurosci. 1993;10:1081–1098. doi: 10.1017/s0952523800010191. [DOI] [PubMed] [Google Scholar]
- Dacey DM, Lee BB. The ‘blue-on’ opponent pathway in primate retina originates from a distinct bistratified ganglion cell type. Nature. 1994;367:731–735. doi: 10.1038/367731a0. [DOI] [PubMed] [Google Scholar]
- Deans MR, Paul DL. Mouse horizontal cells do not express connexin26 or connexin36. Cell Commun Adhes. 2001;8:361–366. doi: 10.3109/15419060109080754. [DOI] [PMC free article] [PubMed] [Google Scholar]
- Deans MR, Volgyi B, Goodenough DA, Bloomfield SA, Paul DL. Connexin36 is essential for transmission of rod-mediated visual signals in the mammalian retina. Neuron. 2002;36:703–712. doi: 10.1016/s0896-6273(02)01046-2. [DOI] [PMC free article] [PubMed] [Google Scholar]
- DeVries SH, Qi X, Smith R, Makous W, Sterling P. Electrical coupling between mammalian cones. Curr Biol. 2002;12:1900–1907. doi: 10.1016/s0960-9822(02)01261-7. [DOI] [PubMed] [Google Scholar]
- Dunn FA, Doan T, Sampath AP, Rieke F. Controlling the gain of rod-mediated signals in the mammalian retina. J Neurosci. 2006;26:3959–3970. doi: 10.1523/JNEUROSCI.5148-05.2006. [DOI] [PMC free article] [PubMed] [Google Scholar]
- Feigenspan A, Teubner B, Willecke K, Weiler R. Expression of neuronal connexin36 in AII amacrine cells of the mammalian retina. J Neurosci. 2001;21:230–239. doi: 10.1523/JNEUROSCI.21-01-00230.2001. [DOI] [PMC free article] [PubMed] [Google Scholar]
- Feigenspan A, Janssen-Bienhold U, Hormuzdi S, Monyer H, Degen J, Söhl G, Willecke K, Ammermüller J, Weiler R. Expression of connexin36 in cone pedicles and OFF-cone bipolar cells of the mouse retina. J Neurosci. 2004;24:3325–3334. doi: 10.1523/JNEUROSCI.5598-03.2004. [DOI] [PMC free article] [PubMed] [Google Scholar]
- Field GD, Greschner M, Gauthier JL, Rangel C, Shlens J, Sher A, Marshak DW, Litke AM, Chichilnisky EJ. High-sensitivity rod photoreceptor input to the blue-yellow color opponent pathway in macaque retina. Nat Neurosci. 2009;12:1159–1164. doi: 10.1038/nn.2353. [DOI] [PMC free article] [PubMed] [Google Scholar]
- Grünert U, Martin PR, Wässle H. Immunocytochemical analysis of bipolar cells in the macaque monkey retina. J Comp Neurol. 1994;348:607–627. doi: 10.1002/cne.903480410. [DOI] [PubMed] [Google Scholar]
- Haverkamp S, Grünert U, Wässle H. The cone pedicle, a complex synapse in the retina. Neuron. 2000;27:85–95. doi: 10.1016/s0896-6273(00)00011-8. [DOI] [PubMed] [Google Scholar]
- Hilgen G, von Maltzahn J, Willecke K, Weiler R, Dedek K. Subcellular distribution of connexin45 in OFF bipolar cells of the mouse retina. J Comp Neurol. 2011;519:433–450. doi: 10.1002/cne.22526. [DOI] [PubMed] [Google Scholar]
- Hombach S, Janssen-Bienhold U, Söhl G, Schubert T, Büssow H, Ott T, Weiler R, Willecke K. Functional expression of connexin57 in horizontal cells of the mouse retina. Eur J Neurosci. 2004;19:2633–2640. doi: 10.1111/j.0953-816X.2004.03360.x. [DOI] [PubMed] [Google Scholar]
- Hornstein EP, Verweij J, Schnapf JL. Electrical coupling between red and green cones in primate retina. Nat Neurosci. 2004;7:745–750. doi: 10.1038/nn1274. [DOI] [PubMed] [Google Scholar]
- Hornstein EP, Verweij J, Li PH, Schnapf JL. Gap-junctional coupling and absolute sensitivity of photoreceptors in macaque retina. J Neurosci. 2005;25:11201–11209. doi: 10.1523/JNEUROSCI.3416-05.2005. [DOI] [PMC free article] [PubMed] [Google Scholar]
- Hsu A, Smith RG, Buchsbaum G, Sterling P. Cost of cone coupling to trichromacy in primate fovea. J Opt Soc Am A Opt Image Sci Vis. 2000;17:635–640. doi: 10.1364/josaa.17.000635. [DOI] [PubMed] [Google Scholar]
- Janssen-Bienhold U, Trümpler J, Hilgen G, Schultz K, Müller LP, Sonntag S, Dedek K, Dirks P, Willecke K, Weiler R. Connexin57 is expressed in dendro-dendritic and axo-axonal gap junctions of mouse horizontal cells and its distribution is modulated by light. J Comp Neurol. 2009;513:363–374. doi: 10.1002/cne.21965. [DOI] [PubMed] [Google Scholar]
- Kolb H. The organization of the outer plexiform layer in the retina of the cat: electron microscopic observations. J Neurocytol. 1977;6:131–153. doi: 10.1007/BF01261502. [DOI] [PubMed] [Google Scholar]
- Kolb H, Goede P, Roberts S, McDermott R, Gouras P. Uniqueness of the S-cone pedicle in the human retina and consequences for color processing. J Comp Neurol. 1997;386:443–460. doi: 10.1002/(sici)1096-9861(19970929)386:3<443::aid-cne8>3.0.co;2-1. [DOI] [PubMed] [Google Scholar]
- Kouyama N, Marshak DW. Bipolar cells specific for blue cones in the macaque retina. J Neurosci. 1992;12:1233–1252. doi: 10.1523/JNEUROSCI.12-04-01233.1992. [DOI] [PMC free article] [PubMed] [Google Scholar]
- Lee EJ, Han JW, Kim HJ, Kim IB, Lee MY, Oh SJ, Chung JW, Chun MH. The immunocytochemical localization of connexin 36 at rod and cone gap junctions in the guinea pig retina. Eur J Neurosci. 2003;18:2925–2934. doi: 10.1046/j.1460-9568.2003.03049.x. [DOI] [PubMed] [Google Scholar]
- Li H, Chuang AZ, O'Brien J. Photoreceptor coupling is controlled by connexin 35 phosphorylation in zebrafish retina. J Neurosci. 2009;29:15178–15186. doi: 10.1523/JNEUROSCI.3517-09.2009. [DOI] [PMC free article] [PubMed] [Google Scholar]
- Li W, DeVries SH. Separate blue and green cone networks in the mammalian retina. Nat Neurosci. 2004;7:751–756. doi: 10.1038/nn1275. [DOI] [PubMed] [Google Scholar]
- Li W, Keung JW, Massey SC. Direct synaptic connections between rods and OFF cone bipolar cells in the rabbit retina. J Comp Neurol. 2004;474:1–12. doi: 10.1002/cne.20075. [DOI] [PubMed] [Google Scholar]
- Li W, Chen S, DeVries SH. A fast rod photoreceptor signaling pathway in the mammalian retina. Nat Neurosci. 2010;13:414–416. doi: 10.1038/nn.2507. [DOI] [PMC free article] [PubMed] [Google Scholar]
- Mariani AP. Bipolar cells in monkey retina selective for the cones likely to be blue-sensitive. Nature. 1984;308:184–186. doi: 10.1038/308184a0. [DOI] [PubMed] [Google Scholar]
- Martin PR, Grünert U. Analysis of the short wavelength-sensitive (“blue”) cone mosaic in the primate retina: comparison of New World and Old World monkeys. J Comp Neurol. 1999;406:1–14. doi: 10.1002/(sici)1096-9861(19990329)406:1<1::aid-cne1>3.0.co;2-1. [DOI] [PubMed] [Google Scholar]
- Massey SC, O'Brien JJ, Trexler EB, Li W, Keung JW, Mills SL, O'Brien J. Multiple neuronal connexins in the mammalian retina. Cell Commun Adhes. 2003;10:425–430. doi: 10.1080/cac.10.4-6.425.430. [DOI] [PubMed] [Google Scholar]
- Mills SL. Unusual coupling patterns of a cone bipolar cell in the rabbit retina. Vis Neurosci. 1999;16:1029–1035. doi: 10.1017/s0952523899166057. [DOI] [PubMed] [Google Scholar]
- Mills SL, O'Brien JJ, Li W, O'Brien J, Massey SC. Rod pathways in the mammalian retina use connexin36. J Comp Neurol. 2001;436:336–350. [PMC free article] [PubMed] [Google Scholar]
- Nathans J. The evolution and physiology of human color vision: insights from molecular genetic studies of visual pigments. Neuron. 1999;24:299–312. doi: 10.1016/s0896-6273(00)80845-4. [DOI] [PubMed] [Google Scholar]
- Nelson R. Cat cones have rod input: a comparison of the response properties of cones and horizontal cell bodies in the retina of the cat. J Comp Neurol. 1977;172:109–135. doi: 10.1002/cne.901720106. [DOI] [PubMed] [Google Scholar]
- Nelson R, von Litzow A, Kolb H, Gouras P. Horizontal cells in cat retina with independent dendritic systems. Science. 1975;189:137–139. doi: 10.1126/science.1138370. [DOI] [PubMed] [Google Scholar]
- O'Brien JJ, Li W, Pan F, Keung J, O'Brien J, Massey SC. Coupling between A-type horizontal cells is mediated by connexin 50 gap junctions in the rabbit retina. J Neurosci. 2006;26:11624–11636. doi: 10.1523/JNEUROSCI.2296-06.2006. [DOI] [PMC free article] [PubMed] [Google Scholar]
- O'Brien J, Nguyen HB, Mills SL. Cone photoreceptors in bass retina use two connexins to mediate electrical coupling. J Neurosci. 2004;24:5632–5642. doi: 10.1523/JNEUROSCI.1248-04.2004. [DOI] [PMC free article] [PubMed] [Google Scholar]
- Palacios-Prado N, Sonntag S, Skeberdis VA, Willecke K, Bukauskas FF. Gating, permselectivity and pH-dependent modulation of channels formed by connexin57, a major connexin of horizontal cells in the mouse retina. J Physiol. 2009;587:3251–3269. doi: 10.1113/jphysiol.2009.171496. [DOI] [PMC free article] [PubMed] [Google Scholar]
- Peracchia C. Gap junctions. Structural changes after uncoupling procedures. J Cell Biol. 1977;72:628–641. doi: 10.1083/jcb.72.3.628. [DOI] [PMC free article] [PubMed] [Google Scholar]
- Raviola E, Gilula NB. Gap junctions between photoreceptor cells in the vertebrate retina. Proc Natl Acad Sci U S A. 1973;70:1677–1681. doi: 10.1073/pnas.70.6.1677. [DOI] [PMC free article] [PubMed] [Google Scholar]
- Raviola E, Gilula NB. Intramembrane organization of specialized contacts in the outer plexiform layer of the retina. A freeze-fracture study in monkeys and rabbits. J Cell Biol. 1975;65:192–222. doi: 10.1083/jcb.65.1.192. [DOI] [PMC free article] [PubMed] [Google Scholar]
- Reye P, Sullivan R, Fletcher EL, Pow DV. Distribution of two splice variants of the glutamate transporter GLT1 in the retinas of humans, monkeys, rabbits, rats, cats, and chickens. J Comp Neurol. 2002;445:1–12. doi: 10.1002/cne.10095. [DOI] [PubMed] [Google Scholar]
- Ribelayga C, Mangel SC. Identification of a circadian clock-controlled neural pathway in the rabbit retina. PLoS One. 2010;5:e11020. doi: 10.1371/journal.pone.0011020. [DOI] [PMC free article] [PubMed] [Google Scholar]
- Ribelayga C, Cao Y, Mangel SC. The circadian clock in the retina controls rod-cone coupling. Neuron. 2008;59:790–801. doi: 10.1016/j.neuron.2008.07.017. [DOI] [PMC free article] [PubMed] [Google Scholar]
- Robson JG, Frishman LJ. Response linearity and kinetics of the cat retina: the bipolar cell component of the dark-adapted electroretinogram. Vis Neurosci. 1995;12:837–850. doi: 10.1017/s0952523800009408. [DOI] [PubMed] [Google Scholar]
- Schneeweis DM, Schnapf JL. Photovoltage of rods and cones in the macaque retina. Science. 1995;268:1053–1056. doi: 10.1126/science.7754386. [DOI] [PubMed] [Google Scholar]
- Schneeweis DM, Schnapf JL. The photovoltage of macaque cone photoreceptors: adaptation, noise, and kinetics. J Neurosci. 1999;19:1203–1216. doi: 10.1523/JNEUROSCI.19-04-01203.1999. [DOI] [PMC free article] [PubMed] [Google Scholar]
- Smith RG, Freed MA, Sterling P. Microcircuitry of the dark-adapted cat retina: functional architecture of the rod-cone network. J Neurosci. 1986;6:3505–3517. doi: 10.1523/JNEUROSCI.06-12-03505.1986. [DOI] [PMC free article] [PubMed] [Google Scholar]
- Sohl G, Maxeiner S, Willecke K. Expression and functions of neuronal gap junctions. Nat Rev Neurosci. 2005;6:191–200. doi: 10.1038/nrn1627. [DOI] [PubMed] [Google Scholar]
- Srinivas M, Rozental R, Kojima T, Dermietzel R, Mehler M, Condorelli DF, Kessler JA, Spray DC. Functional properties of channels formed by the neuronal gap junction protein connexin36. J Neurosci. 1999;19:9848–9855. doi: 10.1523/JNEUROSCI.19-22-09848.1999. [DOI] [PMC free article] [PubMed] [Google Scholar]
- Trexler EB, Li W, Massey SC. Simultaneous contribution of two rod pathways to AII amacrine and cone bipolar cell light responses. J Neurophysiol. 2005;93:1476–1485. doi: 10.1152/jn.00597.2004. [DOI] [PubMed] [Google Scholar]
- Tsukamoto Y, Masarachia P, Schein SJ, Sterling P. Gap junctions between the pedicles of macaque foveal cones. Vision Res. 1992;32:1809–1815. doi: 10.1016/0042-6989(92)90042-h. [DOI] [PubMed] [Google Scholar]
- Tsukamoto Y, Morigiwa K, Ueda M, Sterling P. Microcircuits for night vision in mouse retina. J Neurosci. 2001;21:8616–8623. doi: 10.1523/JNEUROSCI.21-21-08616.2001. [DOI] [PMC free article] [PubMed] [Google Scholar]
- Vardi N, Duvoisin R, Wu G, Sterling P. Localization of mGluR6 to dendrites of ON bipolar cells in primate retina. J Comp Neurol. 2000;423:402–412. doi: 10.1002/1096-9861(20000731)423:3<402::aid-cne4>3.0.co;2-e. [DOI] [PubMed] [Google Scholar]
- Wikler KC, Rakic P, Bhattacharyya N, Macleish PR. Early emergence of photoreceptor mosaicism in the primate retina revealed by a novel cone-specific monoclonal antibody. J Comp Neurol. 1997;377:500–508. [PubMed] [Google Scholar]
- Zhang H, Cuenca N, Ivanova T, Church-Kopish J, Frederick JM, MacLeish PR, Baehr W. Identification and light-dependent translocation of a cone-specific antigen, cone arrestin, recognized by monoclonal antibody 7G6. Invest Ophthalmol Vis Sci. 2003;44:2858–2867. doi: 10.1167/iovs.03-0072. [DOI] [PubMed] [Google Scholar]
- Zhang J, Wu SM. Connexin35/36 gap junction proteins are expressed in photoreceptors of the tiger salamander retina. J Comp Neurol. 2004;470:1–12. doi: 10.1002/cne.10967. [DOI] [PubMed] [Google Scholar]
- Zhang J, Wu SM. Physiological properties of rod photoreceptor electrical coupling in the tiger salamander retina. J Physiol. 2005;564:849–862. doi: 10.1113/jphysiol.2005.082859. [DOI] [PMC free article] [PubMed] [Google Scholar]