Abstract
We have recently proposed a new model of cancer metabolism to explain the role of aerobic glycolysis and L-lactate production in fueling tumor growth and metastasis. In this model, cancer cells secrete hydrogen peroxide (H2O2), initiating oxidative stress and aerobic glycolysis in the tumor stroma. This, in turn, drives L-lactate secretion from cancer-associated fibroblasts. Secreted L-lactate then fuels oxidative mitochondrial metabolism (OXPHOS) in epithelial cancer cells, by acting as a paracrine onco-metabolite. We have previously termed this type of two-compartment tumor metabolism the “reverse Warburg effect,” as aerobic glycolysis takes place in stromal fibroblasts, rather than epithelial cancer cells. Here, we used MCT4 immunostaining of human breast cancer tissue microarrays (TMAs; >180 triple-negative patients) to directly assess the prognostic value of the “reverse Warburg effect.” MCT4 expression is a functional marker of hypoxia, oxidative stress, aerobic glycolysis and L-lactate efflux. Remarkably, high stromal MCT4 levels (score = 2) were specifically associated with decreased overall survival (<18% survival at 10 years post-diagnosis). In contrast, patients with absent stromal MCT4 expression (score = 0), had 10-year survival rates of ∼97% (p-value < 10−32). High stromal levels of MCT4 were strictly correlated with a loss of stromal Cav-1 (p-value < 10−14), a known marker of early tumor recurrence and metastasis. In fact, the combined use of stromal Cav-1 and stromal MCT4 allowed us to more precisely identify high-risk triple-negative breast cancer patients, consistent with the goal of individualized risk-assessment and personalized cancer treatment. However, epithelial MCT4 staining had no prognostic value, indicating that the “conventional” Warburg effect does not predict clinical outcome. Thus, the “reverse Warburg effect” or “parasitic” energy-transfer is a key determinant of poor overall patient survival. As MCT4 is a druggable target, MCT4 inhibitors should be developed for the treatment of aggressive breast cancers, and possibly other types of human cancers. Similarly, we discuss how stromal MCT4 could be used as a biomarker for identifying high-risk cancer patients that could likely benefit from treatment with FDA-approved drugs or existing MCT-inhibitors (such as, AR-C155858, AR-C117977 and AZD-3965).
Key words: caveolin-1, oxidative stress, pseudohypoxia, lactate shuttle, MCT4, metabolic coupling, tumor stroma, predictive biomarker, SLC16A3, monocarboxylic acid transporter, two-compartment tumor metabolism
Introduction
Previously, we identified a loss of stromal Cav-1 as a predictive biomarker of early tumor recurrence, metastasis, tamoxifen-resistance and decreased survival in human breast cancer patients.1,2 The predictive value of a loss of stromal Cav-1 was independent of epithelial marker status, as a loss of stromal Cav-1 was predictive in ER+, PR+, HER2+ and triple-negative breast cancer patients.1,2 Similarly, in DCIS-patients, a loss of stromal Cav-1 predicts invasive progression.3 Importantly, the prognostic value of a loss of stromal Cav-1 in breast cancers has now been independently validated by six other groups world-wide (Australia, Argentina, Korea, Japan, Egypt and Leeds, UK)4–8 and has been extended to other types of human cancers, such as advanced prostate cancer9 and metastatic melanoma.10
To mechanistically understand the prognostic basis of a loss of stromal Cav-1, we studied Cav-1-deficient-mice. Metabolomic, proteomic and genomic profiling established that fibroblasts and the mammary fat pads from Cav-1-deficient mice are highly catabolic and show strong metabolic shifts toward autophagy/mitophagy and aerobic glycolysis, due to increased oxidative stress.11–15 Virtually identical catabolic processes and associations with aerobic glycolysis were identified via analysis of laser-captured tumor stroma from human breast cancer patients lacking stromal Cav-1.16 This led to the proposal of a novel two-compartment model of tumor metabolism, termed the “reverse Warburg effect.”11,11–24 In this model, the glycolytic tumor stroma transfers energy-rich nutrients (such as, L-lactate and ketone bodies) to anabolic tumor cells, which then “fuels” mitochondrial metabolism in epithelial cancer cells.18
Thus, we searched for new biomarker(s) of clinical outcome, by analyzing breast cancer cells co-cultured with human fibroblasts. In this co-culture system, Cav-1 is degraded by oxidative stress-induced autophagy in cancer-associated fibroblasts, resulting in a loss of stromal Cav-1 expression,25–28 mirroring what we observe in high-risk breast cancer patients. Under the same conditions, we demonstrated that breast cancer cells induce MCT4 overexpression in stromal fibroblasts, and that MCT4-induction can be prevented by antioxidants.29 Importantly, MCT4 is the major transporter directly responsible for L-lactate efflux/export from glycolytic cells. As such, MCT4 is a functional biological marker of oxidative stress (pseudo-hypoxia) and aerobic glycolysis in the tumor stroma.29
However, it remains unknown if MCT4 levels are controlled by Cav-1 and/or if stromal MCT4 has any prognostic value as a biomarker in breast cancer patients. To address this issue, we evaluated the prognostic value of stromal Cav-1 and stromal MCT4 in parallel in the same triple-negative breast cancer patient cohort.
Here, we show that stromal MCT4 is (1) a new biomarker that independently predicts poor overall survival in triple-negative (TN) breast cancer patients and (2) stromal MCT4 can be used in conjunction with stromal Cav-1 to further stratify the intermediate-risk group into high-risk and low-risk patients.
As MCT4 is a new druggable target, we suggest that MCT4 inhibitors should be developed for the treatment of aggressive breast cancers, and possibly other types of human cancers.
Results
Predicting overall survival in triple-negative (TN) breast cancer patients: Assessing the prognostic value of stromal MCT4.
Here, we investigated the predictive value of stromal MCT4 as a new candidate biomarker for determining clinical outcome in TN breast cancer patients. More specifically, we used anti-MCT4 isoform-specific polyclonal antibodies to immunostain a tumor tissue microarray (TMA) containing paraffin sections taken from TN breast cancer patients at surgical resection. This TMA cohort is well-annotated and contains 181 patients seen at Thomas Jefferson University Hospital (TJUH), with up to 250 months (> 20 years) of follow-up. In this TN breast cancer population, our main outcome of interest was overall survival. For comparison, the expression of MCT4 was scored in both the epithelial and stromal compartments. Also, the same TN-TMA was immunostained for stromal Cav-1 expression. Table 1 shows the descriptive statistics (age, race, tumor size, histologic grade, stage and lymph-node status) for the entire patient population.
Table 1.
Descriptive statistics for the TN Cohort
| Variable | N | Values |
| Age (years) | 179 | 55.5 ± 13.7 |
| Race | 178 | |
| White | 76% (135) | |
| African American | 24% (43) | |
| Tumor size (cm) | 164 | 2.34 ± 1.80 |
| Histologic grade | 168 | |
| 1–2 | 26% (43) | |
| 3 | 74% (125) | |
| Stage | 171 | |
| 0 | 1% (1) | |
| 1 | 36% (62) | |
| 2 | 46% (78) | |
| 3 | 12% (21) | |
| 4 | 5% (9) | |
| Lymph node status | 146 | |
| Negative | 58% (85) | |
| Positive | 42% (61) |
Numbers in brackets are frequencies. m ± s denotes mean ± standard deviation. N denotes number of non-missing observations. Total number of subjects in this study is 181.
Stromal MCT4 and stromal Cav-1 levels are inversely related.
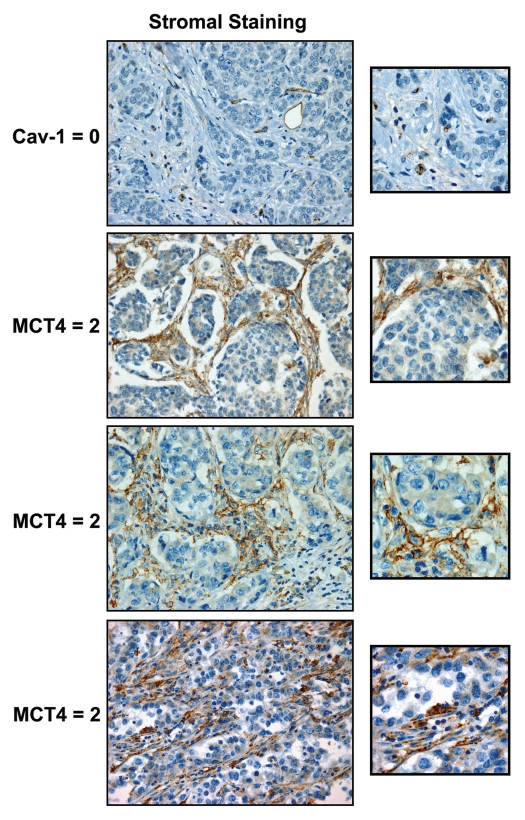
Representative images of MCT4 staining are shown in Figure 1, highlighting MCT4 expression in the stromal compartment. Of the 181 TN breast cancer cases examined, 164 could be effectively scored for stromal MCT4 staining (0 = no staining; 1 = mild-or-moderate staining; 2 = strong staining). Similarly, 159 patients could be effectively scored for stromal Cav-1 staining.
Figure 1.
Cav-1 and MCT4: stromal staining in human breast cancer patients. Note the high expression of MCT4 in the tumor stroma and cancer-associated fibroblasts in a subset of TN breast cancer patients, which is associated with a loss of stromal Cav-1 (Table 2). Representative images of patients in the stromal high-risk groups are shown (Cav 1 = 0 and MCT4 = 2). Despite a loss of stromal Cav-1 immunostaining, blood vessels remain Cav-1-positive, as endothelial cells are resistant to oxidative stress. Original magnification, 40x.
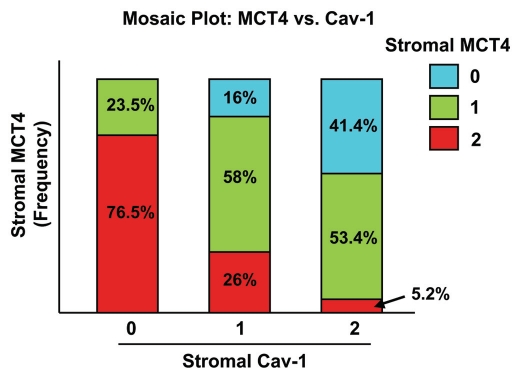
Interestingly, the expression levels of stromal MCT4 and stromal Cav-1 were inversely related. High levels of stromal MCT4 directly correlated with a loss of stromal Cav-1 immunostaining, with a p-value of 5 × 10⁻¹⁵. Table 2 shows the joint frequency distribution of stromal MCT4 and stromal Cav-1, and Figure 2 presents a mosaic plot of the data.
Table 2.
Joint frequency distribution of stromal Cav-1 and stromal MCT4
| MCT4 | p value | |||||
| 0 | 1 | 2 | Total | |||
| Cav-1 | 0 | 0 | 12 | 39 | 51 | 5 × 10⁻¹⁵ |
| 1 | 8 | 29 | 13 | 50 | ||
| 2 | 24 | 31 | 3 | 58 | ||
| Total | 32 | 72 | 55 | 159 | ||
There is evidence of a strong negative relationship between Cav-1 and MCT4 expression. The p-value is for the Fisher's exact test of independence between Cav-1 and MCT4 expression. The table includes only those records for which both Cav-1 and MCT4 are present (n = 159).
Figure 2.
The levels of stromal MCT4 and stromal Cav-1 are inversely related in human breast cancer. A mosaic plot of the joint distribution of stromal Cav-1 and stromal MCT4 is shown. Note that there is clearly a negative relationship between the two biomarkers. For example, if stromal Cav-1 = 0, you are mostly likely observe stromal MCT4 = 2. Conversely, if stromal Cav-1 = 2, you are most likely to observe stromal MCT4 = 0 or 1. For specific numbers, see Table 2.
In this joint frequency distribution analysis, 55 patients showed high levels of MCT4 stromal staining, 72 showed moderate staining and 32 showed an absence of MCT4 stromal staining. Similarly, 58 patients showed high levels of Cav-1 stromal staining, 50 showed an intermediate level of staining and 51 showed an absence of Cav-1 stromal staining.
Most notably, patients with stromal Cav-1 = 0 are most likely to be stromal MCT4 = 2. Conversely, patients with stromal Cav-1 = 2 are most likely to be stromal MCT4 = 0 or 1. Interestingly, we could not detect any patients with concomitant loss of both stromal Cav-1 (Cav-1 = 0) and stromal MCT4 (MCT4 = 0), indicating that a loss of stromal Cav-1 is strictly correlated with increased MCT4 expression. Conversely, only very few cases (3 out of 159 = 2%) had high stromal expression of both MCT4 and Cav-1, indicating that high stromal MCT4 and high stromal Cav-1 are nearly mutually exclusive events.
High stromal MCT4 predicts poor overall survival.
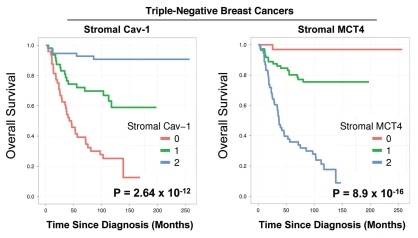
Stromal Cav-1 and stromal MCT4 levels were also used to generate Kaplan-Meier survival curves, plotting percent survival (%) vs. time since diagnosis (in months) (Fig. 3). The results of this analysis were highly statistically significant (with p-values in the range of 10−12 to 10−16).
Figure 3.
Kalplan-Meier analysis reveals the prognostic value of stromal MCT4: Comparison with stromal Cav-1. Stromal Cav-1 and stromal MCT4 levels were used to generate Kaplan-Meier survival curves, plotting percent overall survival (%) vs. time since diagnosis (in months). The results of this analysis were highly statistically significant (with p-values in the range of 10−12 to 10−16). This analysis identified the two high-risk groups as patients with absent stromal Cav-1 (score = 0; n = 51 patients) and high stromal MCT4 (score = 2; n = 55 patients).
This univariate analysis identified the two high-risk groups as patients with (1) absent stromal Cav-1 (score = 0; n = 51 patients) and (2) high stromal MCT4 (score = 2; n = 55 patients). Notably, the intersection of these two high-risk groups shows considerable overlap, with n = 39 patients in common (Table 2).
Hazard ratios are shown in Tables 3 and 4, with stromal Cav-1 and stromal MCT4 showing 14-fold and 50-fold differences in relative risk stratification, respectively.
Table 3.
Hazard ratios for stromal Cav-1
| Hazard Ratio | 95% Confidence Interval | ||
| Stromal Cav-1 | 0 | 14.17 | (5.53, 36.35) |
| 1 | 4.82 | (1.78, 13.08) | |
| 2 (ref) | 1 |
Table 4.
Hazard ratios for stromal MCT4
| Hazard Ratio | 95% Confidence Interval | ||
| Stromal MCT4 | 0 | 0.02 | (0.00, 0.16) |
| 1 | 0.20 | (0.11, 0.35) | |
| 2 (ref) | 1 |
In addition, 10-year survival rates are shown in Tables 5 and 6. For example, if stromal MCT4 = 0, the 10-year survival rate was ∼97% vs. < 20% for stromal MCT4 = 2. Conversely, if stromal Cav-1 = 2, the 10-year survival rate was ∼91% vs. ∼25% for stromal Cav-1 = 0.
Table 5.
10-year survival by stromal MCT4 expression
| Stromal MCT4 | ||||
| MCT4 = 0 | MCT4 = 1 | MCT4 = 2 | ||
| Overall | 10-y survival | 96.9% | 75.5% | 17.7% |
| MCT4 = 0 | 3.9 × 10⁻⁴ | 4.2 × 10⁻³³ | ||
| MCT4 = 1 | 1.5 × 10⁻¹³ | |||
| Cav-1 = 1 | 10-y survival | 87.5% | 77.9% | 0% |
| MCT4 = 0 | 0.50 | 7.3 × 10⁻¹⁴ | ||
| MCT4 = 1 | 2.14 × 10⁻²² | |||
Overall 10-year survival and conditional on stromal Cav-1 expression. The survival estimates and the pairwise p-values testing equality of 10-y survival between strata are shown
Table 6.
10-year survival by stromal Cav-1 expression
| Stromal Cav-1 | ||||
| Cav-1 = 0 | Cav-1 = 1 | Cav-1 = 2 | ||
| Overall | 10-y survival | 25.2% | 58.9% | 90.8% |
| Cav-1 = 0 | 0.001 | 5.9 × 10⁻¹⁸ | ||
| Cav-1 = 1 | 4.6 × 10⁻⁴ | |||
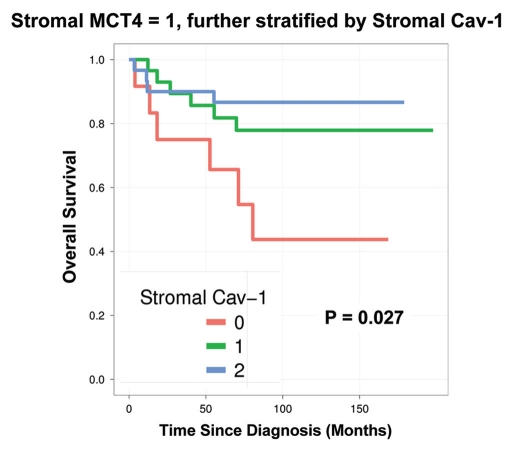
| MCT4 = 1 | 10-y survival | 43.8% | 77.9% | 86.7% |
| Cav-1 = 0 | 0.05 | 0.01 | ||
| Cav-1 = 1 | 0.39 | |||
Overall 10-year survival and conditional on stromal MCT4 expression. The survival estimates and the pairwise p-values testing equality of 10-y survival between strata are shown
Combining stromal Cav-1 with stromal MCT4 allows further stratification of the intermediate risk group.
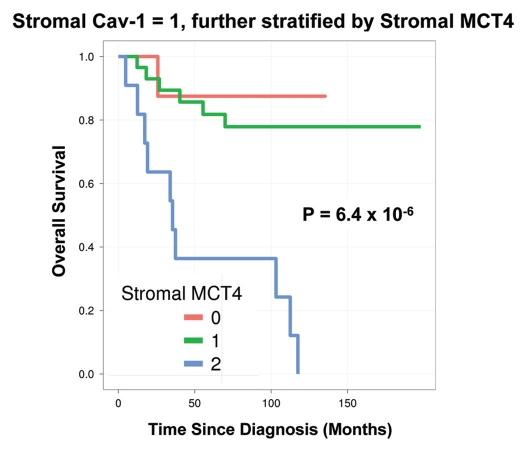
Notably, the two intermediate risk groups identified by stromal Cav-1 (score = 1) and stromal MCT4 (score = 1) could be further stratified by combining both stromal markers, allowing the unambiguous identification of high-risk and low-risk patients (Fig. 4 and 5 and Tables 5 and 6).
Figure 4.
Combined use of stromal Cav-1 and stromal MCT4 for stratification of the intermediate risk group (stromal Cav-1 = 1). The intermediate risk group identified by stromal Cav-1 (score = 1) could be further stratified using stromal MCT4, allowing the unambiguous identification of high-risk and low-risk patients. More specifically, patients with stromal Cav-1 (score = 1) could be further divided into high- and low-risk groups using stromal MCT4, yielding 10-year survival rates of ∼78–88% vs. <1% survival.
Figure 5.
Combined use of stromal MCT4 and stromal Cav-1 for stratification of the intermediate risk group (stromal MCT4 = 1). The intermediate risk group identified by stromal MCT4 (score = 1) could be further stratified using stromal Cav-1, allowing the unambiguous identification of high-risk and low-risk patients. More specifically, patients with stromal MCT4 (score = 1) could be further divided into high- and low-risk groups using stromal Cav-1, yielding 10-year survival rates of ∼78–87% vs. <45% survival.
For example, patients with stromal Cav-1 (score = 1) could be further sub-divided into high- and low-risk groups using stromal MCT4 (Fig. 4 and Table 5). Remarkably, in this intermediate risk group (Cav-1 = 1), the 10-year survival rates sharply declined from 88% (MCT4 = 0) and 78% (MCT4 = 1), to < 1% (MCT4 = 2).
MCT4 expression in tumor epithelial cells has no prognostic value.
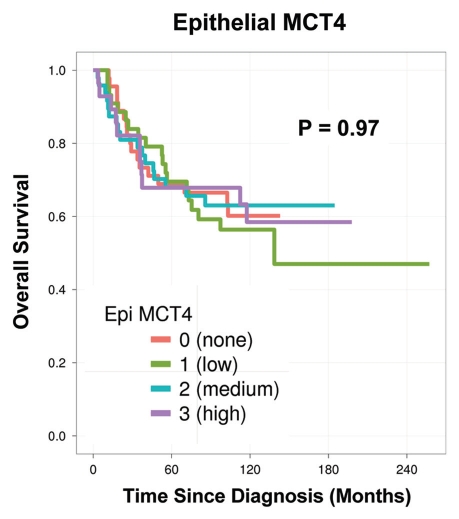
Finally, in a parallel analysis performed on the same exact patient TMAs, the levels of tumor epithelial MCT4 were scored (Fig. 6). However, they showed no prognostic significance (p = 0.97). Thus, the prognostic value of MCT4 expression is highly compartment-specific and restricted to the tumor stroma.
Figure 6.
MCT4 levels in tumor epithelial cells have no prognostic value. In a parallel analysis performed on the same patient TMAs, the levels of tumor epithelial MCT4 were scored. However, they showed no prognostic significance (p = 0.97). Thus, the prognostic value of MCT4 expression is restricted to the tumor stroma.
Similarly, we have previously shown that tumor epithelial Cav-1 levels have no prognostic value in two different breast cancer cohorts.1,2
Discussion
Two-compartment tumor metabolism: The reverse Warburg effect.
In 1889, Dr. Paget proposed the “seed and soil hypothesis,” suggesting that cancer cells (the seeds) require a permissive microenvironment (the soil) to facilitate tumor growth, progression and metastatic dissemination.34–36
Recently, it has been proposed that oxidative stress in the tumor microenvironment may function as “fertilizer,” driving DNA-damage, inflammation and metabolic alterations.24,37–39 Tumor cells secrete hydrogen peroxide (H2O2) to induce oxidative stress (pseudo-hypoxia), “fertilizing” the tumor stroma.28 As a consequence, oxidative stress initiated by tumor cells is transferred to cancer-associated fibroblasts.28
Oxidative stress in cancer-associated fibroblasts then results in increased stromal ROS production and the activation of NFκB and HIF1-α transcription factors, inducing autophagy/mitophagy, inflammation and aerobic glycolysis. Mitophagy (mitochondrial autophagy) then increases L-lactate and ketone production, due to mitochondrial dysfunction or deficiency.26,27,40
As a consequence, tumor-associated fibroblasts release high-energy metabolites (L-lactate and ketones) and chemical building blocks (nucleotides, fatty acids and amino acids, such as glutamine). These catabolites stimulate mitochondrial biogenesis, OXPHOS and autophagy-resistance in epithelial cancer cells, and protect cancer cells against chemotherapy-induced apoptosis.17,41,42
We have termed this new model of cancer metabolism the “reverse Warburg effect,” as aerobic glycolysis takes place in stromal fibroblasts and not in epithelial tumor cells11,17,18 (Fig. 7).
Figure 7.
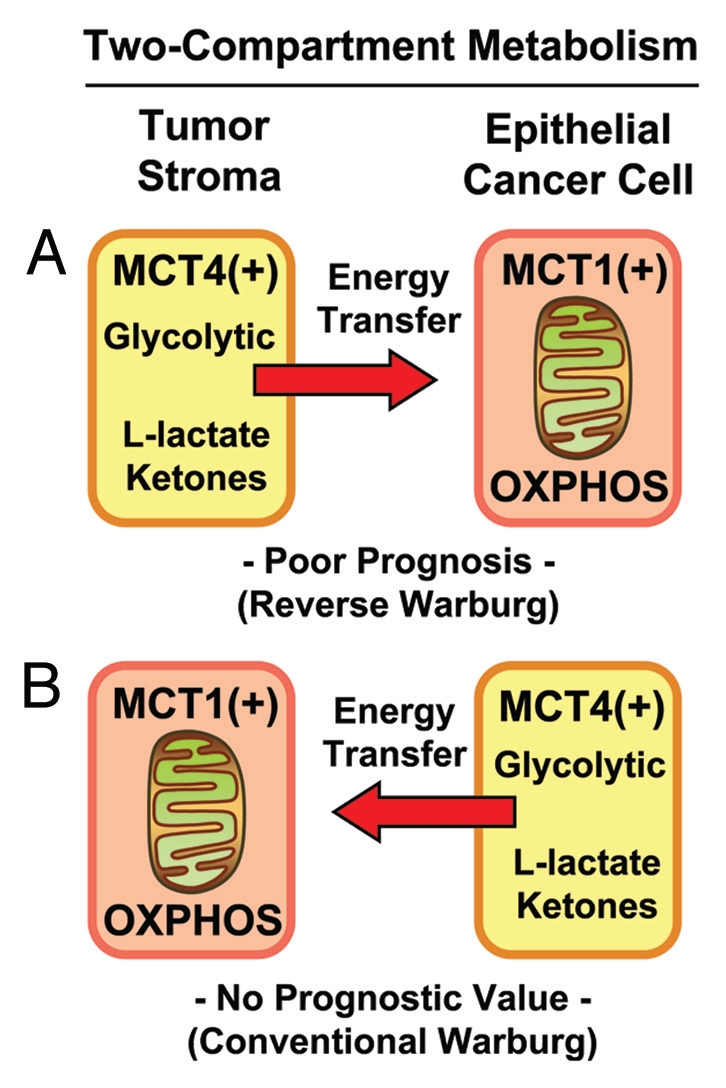
Two-compartment tumor metabolism: MCT4 expression and the Warburg effect. Here, we directly compared the prognostic value of stromal and epithelial MCT4 expression in triple-negative breast cancer patients within the same patient cohort. MCT4 expression is a specific marker of aerobic glycolysis (with enhanced L-lactate and ketone production), also known as the Warburg effect. Our results directly show that high stromal MCT4 levels are specifically associated with poor overall survival (A). In contrast, expression of MCT4 in epithelial tumor cells had no prognostic value (B). Thus, only induction of the Warburg effect in the tumor stroma has prognostic value. In both (A and B), note that glycolytic MCT4(+) cells would be metabolically coupled with oxidative mitochondrial metabolism (OXPHOS) in adjacent MCT1(+) cells, resulting net energy transfer (red arrows). MCT4 normally functions in L-lactate efflux/export, while MCT1 functions in L-lactate uptake/import.
In this two-compartment system, oxidative cancer cells and glycolytic fibroblasts are metabolically coupled in a host-parasite relationship.17 Tumor cells directly “feed” off the glycolytic host microenvironment, behaving like an infectious parasite.18 Thus, two-compartment tumor metabolism may be the basis of chemoresistance or therapy-failure in cancer patients.17 We have also demonstrated that ROS produced in cancer-associated fibroblasts, has a “bystander effect” on adjacent epithelial cancer cells, leading to DNA-damage, genomic instability and aneuploidy.26
In summary, we believe that a critical biological function of the tumor stroma is to produce L-lactate and other high-energy catabolites (such as ketones and glutamine) to “fuel” oxidative mitochondrial metabolism (OXPHOS) in adjacent epithelial cancer cells.43–47
MCT4 and normal lactate transport.
Specialized transporters, termed monocarboxylate transporters (MCTs), function as “shuttles” to transfer L-lactate from one cell type to another.48,49 For example, MCT4 is primarily a transporter that extrudes L-lactate from cells that utilize aerobic glycolysis for energy metabolism and lack functional mitochondria.50 Ketones are thought to be transported by the same MCT transporters that handle lactate transport. Physiologically, MCT4 expression is induced by hypoxia and/or oxidative stress, and MCT4 is a known HIF1-α target gene.48,51 Thus, MCT4 is a functional marker of oxidative stress and aerobic glycolysis, also known as the “Warburg effect.”29
Two physiological examples of cells that normally undergo aerobic glycolysis are fast-twitch fibers in skeletal muscle and astrocytes in the brain.52–56 In skeletal muscle, MCT4 is selectively expressed in fast-twitch fibers that are glycolytic and extrude lactate, which is then taken up by slow-twitch fibers.48,49 In the brain, MCT4 is selectively expressed in astrocytes that are glycolytic and export lactate, which is used as an energy source by adjacent neurons.48,49 In skeletal muscle, such metabolic coupling is known as the “lactate shuttle,” and in the brain, it is called “neuron-glia metabolic coupling”.52–56
These normal physiologic forms of metabolic coupling are analogous to the “reverse Warburg effect,” which is observed in tumor tissue.29
MCT4 and the reverse Warburg effect.
Here, we investigated the compartment-specific expression of MCT4 in human breast cancer patients and determined its potential association with overall clinical outcome. As MCT4 is a marker of oxidative stress and aerobic glycolysis as well as L-lactate extrusion, it should allow us to determine if the “Warburg effect” shows any prognostic value in epithelial cancer cells or the tumor stroma or, possibly, in both tumor compartments.
In the conventional Warburg effect, epithelial cancer cells undergo aerobic glycolysis, likely due to mitochondrial dysfunction,57–60 and are predicted to express high levels of MCT4. Conversely, in the “reverse Warburg effect,” stromal fibroblasts undergo aerobic glycolysis due to oxidative stress and autophagy/mitophagy in the tumor stroma, resulting in a functional mitochondrial deficiency. As such, in the “reverse Warburg effect,” cancer-associated fibroblasts and the tumor stroma should overexpress MCT4.29 In both scenarios, glycolytic MCT4(+) cells would be metabolically coupled with oxidative mitochondrial metabolism (OXPHOS) in adjacent MCT1(+) cells: MCT4 functions in L-lactate efflux, while MCT1 functions in L-lactate uptake (Fig. 7).
Thus, we directly compared the prognostic value of stromal and epithelial MCT4 expression in triple-negative breast cancer patients within the same patient cohort. Our results show that high stromal MCT4 levels are specifically associated with poor overall survival. In contrast, expression of MCT4 in epithelial tumor cells had no prognostic value. As a result, it appears that high expression of MCT4 in the tumor stroma (the “reverse Warburg effect”) is specifically associated with a “lethal tumor microenvironment” (Fig. 7).
Consistent with our current observations, increased serum and tumor L-lactate is a specific marker of poor clinical outcome in variety of cancer types,61–64 and lactic acidosis is a life-threatening complication in patients with metastatic breast cancer.65–70 Thus, these previous results may have been due to L-lactate over-production in the tumor microenvironment, rather than in epithelial tumor cells.
Stromal MCT4: Implications for treatment stratification.
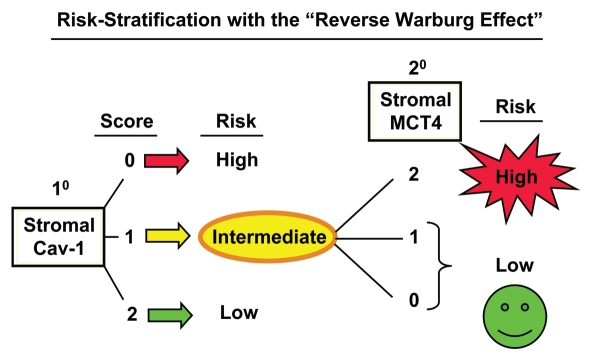
Here, we also show that stromal Cav-1 can be used in combination with stromal MCT4 to further stratify the intermediate risk group into high-risk and low-risk subgroups, effectively increasing the prognostic power of stromal Cav-1 as a biomarker (Fig. 8). Now that we believe we can unambiguously identify high-risk breast cancer patients (stromal Cav-1 = 0 and stromal MCT4 = 2) with the “reverse Warburg effect,” this new biomarker combination could be used to initiate a series of prospective clinical trials to effectively predict prognosis and reduce mortality in this high-risk patient population.
Figure 8.
Combining stromal Cav-1 with stromal MCT4 allows for more powerful prognostic stratification. Based on our current studies, patients would first be stratified into high-, intermediate- and low-risk groups, based on the levels of stromal Cav-1 (as a primary biomarker). Then, patients in the intermediate-risk group (with stromal Cav-1 = 1) could be further stratified into high- and low-risk groups, using stromal MCT4 (as a secondary biomarker). High-risk patients, with stromal MCT4 = 2, could be treated differently than lower-risk patients, with stromal MCT4 = 0 and 1, allowing for more personalized cancer care.
Based on our mechanistic studies, this high-risk patient population should be more responsive to certain FDA-approved therapeutics, such as antioxidants [N-acetyl-cysteine (NAC)], autophagy inhibitors (chloroquine and hydroxy-chloroquine), mitochondrial “poisons” (metformin) as well as authophagy inducers (rapamycin and its derivatives).20 All of these therapies would uncouple anabolic cancer cells from their catabolic hosts, by interrupting energy-transfer, effectively cutting off the fuel supply or preventing cancer cells from using the fuel supply (L-lactate, ketones and/or glutamine) (Table 7). For example, they could be used synergistically, in combination with conventional therapies or during remission after conventional therapy, to prevent recurrence, or even as single agents in patients with advanced metastatic disease.
Table 7.
Candidate FDA-approved drugs for targeting two-compartment tumor metabolism
| Candidate Drugs | Predicted Mechanism(s) of Action |
| 1. N-Acetyl-Cysteine (NAC) | Antioxidant |
| Will prevent oxidative stress in cancer-associated fibroblasts, halting autophagy in the tumor stroma, thereby cutting of the fuel supply (L-lactate, ketones, glutamine) to breast cancer cell mitochondria. | |
| 2. Hydroxy-Chloroquine* | Autophagy Inhibitor |
| Will inhibit autophagy and mitophagy in cancer-associated fibroblasts, thereby cutting off the fuel supply (L-lactate, ketones, glutamine) to breast cancer cell mitochondria. | |
| 3. Metformin | Inhibitor of Mitochondrial OXPHOS (Complex I) |
| Will inhibit oxidative mitochondrial metabolism (OXPHOS) in breast cancer cells, preventing them from using L-lactate, ketones and glutamine as mitochondrial fuels. | |
| 4. Rapamycin and Rapalogues | Autophagy Inducer(s) |
| Will induce autophagy and mitophagy in breast cancer cells, preventing them from using the available high-energy mitochondrial fuels, such as L-lactate, ketones and glutamine. | |
Clinically, hydroxy-chloroquine is preferred as it has less side-effects than the parent compound, chloroquine. Importantly, we have shown that NAC, chloroquine and metformin all prevent loss of stromal Cav-1 in fibroblasts, when co-cultured with breast cancer cells.
New targeted therapies would include MCT4 inhibitors, which have yet to be developed, to inhibit L-lactate/ketone efflux from glycolytic cancer-associated fibroblasts. MCT1/2 inhibitors may also be a rational approach, as they would likely prevent epithelial cancer cells from “siphoning-off” L-lactate/ketones from the MCT4(+) tumor microenvironment. MCT1 is highly expressed in epithelial tumor cells and is involved in L-lactate/ketone uptake.29
So, high-risk patients (defined as, stromal Cav-1 = 0 and stromal MCT4 = 2) could be selected for treatment with MCT1-inhibitors (such as, AR-C155858, AR-C117977 and AZD-3965 71,72), which have recently been developed by AstraZeneca and are now undergoing Phase I/II clinical trials.
Materials and Methods
Materials.
Anti-MCT4 isoform-specific rabbit polyclonal antibodies were previously generated and characterized by Dr. Nancy Philp.30 Isoform-specific antibodies were produced against the 18-mer synthetic oligopeptide corresponding to the C-terminal amino acids of MCT4.30
The study population and tumor microarray construction.
Cases for the study were obtained from the Surgical Pathology files at Thomas Jefferson University with Institutional Review Board approval. The tissue microarray (TMA) contained tumor samples derived from 181 largely consecutive patients with triple-negative breast carcinoma (with follow-up information) treated at the Thomas Jefferson University. For inclusion in this study as TN breast cancer, expression of estrogen, progesterone receptors was not detected or present in < 1% of tumor cells, with a satisfactory positive control. HER2 was scored 0–1+ or 2+, and an absence of HER2 amplification by fluorescent in situ hybridization was required for negativity. All cases were invasive ductal carcinomas (IDC). Clinical and pathological variables were determined following well-established criteria. All TN breast cancers were graded according to the method described by Elston and Ellis; lymphovascular invasion was classified as either present or absent. The tumor tissue-microarrays (TMAs) were constructed using a tissue arrayer (Veridiam). Two tissue cores (0.6 µm diameter) were sampled from each block to account for tumor and tissue heterogeneity and transferred to the recipient block. Clinical and treatment information was extracted by chart review.
Immunostaining.
Cav-1 and MCT4 expression levels were assessed using a standard three-step avidin-biotin immunoperoxidase method, with a rabbit polyclonal anti-Cav-1 antibody (Santa Cruz Biotech, Inc. (N-20; sc-894, Santa Cruz Biotech, diluted 1:1,000) or a rabbit polyclonal anti-MCT4 antibody (diluted 1:250) a three-step avidin biotin immunoperoxidase method. TMA sections were de-paraffinized and re-hydrated through graded alcohols. Antigen retrieval was performed in 10 mM citrate buffer, pH 6.0, for 10 min in a pressure cooker. Sections were cooled to room temperature, rinsed in PBS, blocked with 3% (v/v) H2O2 for 15 min, followed by blocking for endogenous biotin using the DakoCytomation Biotin Blocking System (#X0590). Slides were then incubated for 1 h with 10% goat serum and incubated with primary antibody overnight at 4°C. Antibody binding was detected using a biotinylated secondary antibody (Vector Labs, #BA-1000) followed by streptavidin-HRP (Dako #K1016). Immunoreactivity was detected using Dako Liquid DAB + Substrate-Chromogen Solution.
Stromal scoring.
Stromal Cav-1 staining was scored semi-quantitatively as negative (0, no staining), weak (1, either diffuse weak staining or strong staining in less than 30% of stromal cells per core) or strong (2, defined as strong staining of 30% or more of the stromal cells).1–3 MCT4 expression in the stroma was performed using same criteria as those we applied for scoring Cav-1 expression.
Epithelial scoring.
For evaluating MCT4 expression in tumor epithelial cells, we used a previously developed scoring system.31 Sections were scored semi-quantitatively as follows: 0, 0% immuno-reactive cells; 1, < 5% immuno-reactive cells; 2, 5–50% immuno-reactive cells; and 3, > 50% immuno-reactive cells. Similarly, intensity of staining was evaluated semi-quantitatively on a scale 0–3, with 0 representing negative; 1, weak; 2, moderate and 3, strong staining. Then, the final score was calculated, reflecting both the percent of immuno-reactive cells and staining intensity.
Statistical analysis.
As noted, we scored stromal Cav-1 and MCT4 expression in the TMAs as 0 (none), 1 (low) and 2 (high). Epithelial MCT4 was scored as 0 (none), 1 (low), 2 (medium) and 3 (high). The outcome of interest here is overall survival, i.e., death can occur for any cause. Survival curves were computed by expression strata using the Kaplan-Meier method, and differences between survival curves was assessed using the log-rank test. Hazard ratios for the biomarkers were computed using Cox proportional hazards regression, using the biomarker as predictor and adjusting for age and race. Agreement with the proportional hazards assumption was verified. Differences in 10-year survival were assessed based on two-sample z-tests, using estimates and standard errors from the Kaplan-Meier curves. All analyses were done using the statistical analysis package R version 2.13,32 along with the R package survival version 2.36–9.33 Associations were assessed using the χ2-test for independence.
See the following MCT1 inhibitor trial-related information.
Acknowledgments
A.K.W was supported by a Susan G. Komen Career Catalyst Grant. F.S. and her laboratory were supported by grants from the Breast Cancer Alliance (BCA) and the American Cancer Society (ACS). U.E.M. was supported by a Young Investigator Award from the Margaret Q. Landenberger Research Foundation. M.P.L. was supported by grants from the NIH/NCI (R01-CA-080250; R01-CA-098779; R01-CA-120876; R01-AR-055660), and the Susan G. Komen Breast Cancer Foundation. R.G.P. was supported by grants from the NIH/NCI (R01-CA-70896, R01-CA-75503, R01-CA-86072, and R01-CA-107382) and the Dr. Ralph and Marian C. Falk Medical Research Trust. The Kimmel Cancer Center was supported by the NIH/NCI Cancer Center Core grant P30-CA-56036 (to R.G.P.). Funds were also contributed by the Margaret Q. Landenberger Research Foundation (to M.P.L.). This work was also supported, in part, by a Centre grant in Manchester from Breakthrough Breast Cancer in the U.K. (to Dr. Anthony Howell) and an Advanced ERC Grant from the European Research Council.
Disclosure of Potential Conflicts of Interest
No potential conflicts of interest were disclosed.
References
- 1.Witkiewicz AK, Dasgupta A, Sotgia F, Mercier I, Pestell RG, Sabel M, et al. An absence of stromal caveolin-1 expression predicts early tumor recurrence and poor clinical outcome in human breast cancers. Am J Pathol. 2009;174:2023–2034. doi: 10.2353/ajpath.2009.080873. [DOI] [PMC free article] [PubMed] [Google Scholar]
- 2.Witkiewicz AK, Dasgupta A, Sammons S, Er O, Potoczek MB, Guiles F, et al. Loss of stromal caveolin-1 expression predicts poor clinical outcome in triple-negative and basal-like breast cancers. Cancer Biol Ther. 2010;10:135–143. doi: 10.4161/cbt.10.2.11983. [DOI] [PMC free article] [PubMed] [Google Scholar]
- 3.Witkiewicz AK, Dasgupta A, Nguyen KH, Liu C, Kovatich AJ, Schwartz GF, et al. Stromal caveolin-1 levels predict early DCIS progression to invasive breast cancer. Cancer Biol Ther. 2009;8:1071–1079. doi: 10.4161/cbt.8.11.8874. [DOI] [PubMed] [Google Scholar]
- 4.Sloan EK, Ciocca DR, Pouliot N, Natoli A, Restall C, Henderson MA, et al. Stromal cell expression of caveolin-1 predicts outcome in breast cancer. Am J Pathol. 2009;174:2035–2043. doi: 10.2353/ajpath.2009.080924. [DOI] [PMC free article] [PubMed] [Google Scholar]
- 5.Koo JS, Park S, Kim SI, Lee S, Park BW. The impact of caveolin protein expression in tumor stroma on prognosis of breast cancer. Tumour Biol. 2011;32:787–799. doi: 10.1007/s13277-011-0181-6. [DOI] [PubMed] [Google Scholar]
- 6.Qian N, Ueno T, Kawaguchi-Sakita N, Kawashima M, Yoshida N, Mikami Y, et al. Prognostic significance of tumor/stromal caveolin-1 expression in breast cancer patients. Cancer Sci. 2011;102:1590–1596. doi: 10.1111/j.1349-7006.2011.01985.x. [DOI] [PubMed] [Google Scholar]
- 7.El-Gendi SM, Mostafa MF, El-Gendi AM. Correlation with Early Tumor Recurrence and Clinical Outcome. Stromal Caveolin-1 Expression in Breast Carcinoma. Pathol Oncol Res. 2011 doi: 10.1007/s12253-011-9469-5. [DOI] [PubMed] [Google Scholar]
- 8.Simpkins S, Holliday D, Speirs V. NCRI Cancer Conference. 2011. The role of stromal caveolin-1 in breast cancer progression. Absract #A222; http://www.ncri.org.uk/ncriconference/2011abstracts/abstracts/A222.html. [Google Scholar]
- 9.Di Vizio D, Morello M, Sotgia F, Pestell RG, Freeman MR, Lisanti MP. An absence of stromal caveolin-1 is associated with advanced prostate cancer, metastatic disease and epithelial Akt activation. Cell Cycle. 2009;8:2420–2424. doi: 10.4161/cc.8.15.9116. [DOI] [PMC free article] [PubMed] [Google Scholar]
- 10.Wu KN, Queenan M, Brody JR, Potoczek M, Sotgia F, Lisanti MP, et al. Loss of stromal caveolin-1 expression in malignant melanoma metastases predicts poor survival. Cell Cycle. 2011;10:4250–4255. doi: 10.4161/cc.10.24.18551. [DOI] [PubMed] [Google Scholar]
- 11.Pavlides S, Whitaker-Menezes D, Castello-Cros R, Flomenberg N, Witkiewicz AK, Frank PG, et al. The reverse Warburg effect: aerobic glycolysis in cancer associated fibroblasts and the tumor stroma. Cell Cycle. 2009;8:3984–4001. doi: 10.4161/cc.8.23.10238. [DOI] [PubMed] [Google Scholar]
- 12.Pavlides S, Tsirigos A, Vera I, Flomenberg N, Frank PG, Casimiro MC, et al. Loss of stromal caveolin-1 leads to oxidative stress, mimics hypoxia and drives inflammation in the tumor microenvironment, conferring the “reverse Warburg effect”: a transcriptional informatics analysis with validation. Cell Cycle. 2010;9:2201–2219. doi: 10.4161/cc.9.11.11848. [DOI] [PubMed] [Google Scholar]
- 13.Pavlides S, Tsirigos A, Migneco G, Whitaker-Menezes D, Chiavarina B, Flomenberg N, et al. The autophagic tumor stroma model of cancer: Role of oxidative stress and ketone production in fueling tumor cell metabolism. Cell Cycle. 2010;9:3485–3505. doi: 10.4161/cc.9.17.12721. [DOI] [PMC free article] [PubMed] [Google Scholar]
- 14.Trimmer C, Sotgia F, Whitaker-Menezes D, Balliet RM, Eaton G, Martinez-Outschoorn UE, et al. Caveolin-1 and mitochondrial SOD2 (MnSOD) function as tumor suppressors in the stromal microenvironment: a new genetically tractable model for human cancer associated fibroblasts. Cancer Biol Ther. 2011;11:383–394. doi: 10.4161/cbt.11.4.14101. [DOI] [PMC free article] [PubMed] [Google Scholar]
- 15.Bonuccelli G, Whitaker-Menezes D, Castello-Cros R, Pavlides S, Pestell RG, Fatatis A, et al. The reverse Warburg effect: glycolysis inhibitors prevent the tumor promoting effects of caveolin-1 deficient cancer associated fibroblasts. Cell Cycle. 2010;9:1960–1971. doi: 10.4161/cc.9.10.11601. [DOI] [PubMed] [Google Scholar]
- 16.Witkiewicz AK, Kline J, Queenan M, Brody JR, Tsirigos A, Bilal E, et al. Molecular profiling of a lethal tumor microenvironment, as defined by stromal caveolin-1 status in breast cancers. Cell Cycle. 2011;10:1794–1809. doi: 10.4161/cc.10.11.15675. [DOI] [PMC free article] [PubMed] [Google Scholar]
- 17.Martinez-Outschoorn UE, Pestell RG, Howell A, Tykocinski ML, Nagajyothi F, Machado FS, et al. Energy transfer in “parasitic” cancer metabolism: Mitochondria are the powerhouse and Achilles' heel of tumor cells. Cell Cycle. 2011;10:4208–4216. doi: 10.4161/cc.10.24.18487. [DOI] [PMC free article] [PubMed] [Google Scholar]
- 18.Martinez-Outschoorn UE, Sotgia F, Lisanti MP. Power Surge: Supporting Cells “Fuel” Cancer Cell Mitochondria. Cell Metab. 2012;15:4–5. doi: 10.1016/j.cmet.2011.12.011. [DOI] [PubMed] [Google Scholar]
- 19.Martinez-Outschoorn UE, Pavlides S, Howell A, Pestell RG, Tanowitz HB, Sotgia F, et al. Stromal-epithelial metabolic coupling in cancer: integrating autophagy and metabolism in the tumor microenvironment. Int J Biochem Cell Biol. 2011;43:1045–1051. doi: 10.1016/j.biocel.2011.01.023. [DOI] [PMC free article] [PubMed] [Google Scholar]
- 20.Martinez-Outschoorn UE, Whitaker-Menezes D, Pavlides S, Chiavarina B, Bonuccelli G, Casey T, et al. The autophagic tumor stroma model of cancer or “battery-operated tumor growth”: A simple solution to the autophagy paradox. Cell Cycle. 2010;9:4297–4306. doi: 10.4161/cc.9.21.13817. [DOI] [PMC free article] [PubMed] [Google Scholar]
- 21.Sotgia F, Martinez-Outschoorn UE, Howell A, Pestell RG, Pavlides S, Lisanti MP. Caveolin-1 and Cancer Metabolism in the Tumor Microenvironment: Markers, Models and Mechanisms. Annu Rev Pathol. 2011;7:423–467. doi: 10.1146/annurev-pathol-011811-120856. [DOI] [PubMed] [Google Scholar]
- 22.Sotgia F, Martinez-Outschoorn UE, Pavlides S, Howell A, Pestell RG, Lisanti MP. Understanding the Warburg effect and the prognostic value of stromal caveolin-1 as a marker of a lethal tumor microenvironment. Breast Cancer Res. 2011;13:213. doi: 10.1186/bcr2892. [DOI] [PMC free article] [PubMed] [Google Scholar]
- 23.Pavlides S, Vera I, Gandara R, Sneddon S, Pestell RG, Mercier I, et al. Warburg Meets Autophagy: Cancer-Associated Fibroblasts Accelerate Tumor Growth and Metastasis via Oxidative Stress, Mitophagy and Aerobic Glycolysis. Antioxid Redox Signal. 2011 doi: 10.1089/ars.2011.4243. Epub Ahead of Print. [DOI] [PMC free article] [PubMed] [Google Scholar]
- 24.Ertel A, Tsirigos A, Whitaker-Menezes D, Birbe RC, Pavlides S, Martinez-Outschoorn UE, et al. Is cancer a metabolic rebellion against host aging? In the quest for immortality, tumor cells try to save themselves by boosting mitochondrial metabolism. Cell Cycle. 2012;11:253–263. doi: 10.4161/cc.11.2.19006. [DOI] [PMC free article] [PubMed] [Google Scholar]
- 25.Martinez-Outschoorn UE, Pavlides S, Whitaker-Menezes D, Daumer KM, Milliman JN, Chiavarina B, et al. Tumor cells induce the cancer associated fibroblast phenotype via caveolin-1 degradation: implications for breast cancer and DCIS therapy with autophagy inhibitors. Cell Cycle. 2010;9:2423–2433. doi: 10.4161/cc.9.12.12048. [DOI] [PubMed] [Google Scholar]
- 26.Martinez-Outschoorn UE, Balliet RM, Rivadeneira DB, Chiavarina B, Pavlides S, Wang C, et al. Oxidative stress in cancer associated fibroblasts drives tumor-stroma co-evolution: A new paradigm for understanding tumor metabolism, the field effect and genomic instability in cancer cells. Cell Cycle. 2010;9:3256–3276. doi: 10.4161/cc.9.16.12553. [DOI] [PMC free article] [PubMed] [Google Scholar]
- 27.Martinez-Outschoorn UE, Trimmer C, Lin Z, Whitaker-Menezes D, Chiavarina B, Zhou J, et al. Autophagy in cancer associated fibroblasts promotes tumor cell survival: Role of hypoxia, HIF1 induction and NFκB activation in the tumor stromal microenvironment. Cell Cycle. 2010;9:3515–3533. doi: 10.4161/cc.9.17.12928. [DOI] [PMC free article] [PubMed] [Google Scholar]
- 28.Martinez-Outschoorn UE, Lin Z, Trimmer C, Flomenberg N, Wang C, Pavlides S, et al. Cancer cells metabolically “fertilize” the tumor microenvironment with hydrogen peroxide, driving the Warburg effect: implications for PET imaging of human tumors. Cell Cycle. 2011;10:2504–2520. doi: 10.4161/cc.10.15.16585. [DOI] [PMC free article] [PubMed] [Google Scholar]
- 29.Whitaker-Menezes D, Martinez-Outschoorn UE, Lin Z, Ertel A, Flomenberg N, Witkiewicz AK, et al. Evidence for a stromal-epithelial “lactate shuttle” in human tumors: MCT4 is a marker of oxidative stress in cancer-associated fibroblasts. Cell Cycle. 2011;10:1772–1783. doi: 10.4161/cc.10.11.15659. [DOI] [PMC free article] [PubMed] [Google Scholar]
- 30.Gallagher SM, Castorino JJ, Wang D, Philp NJ. Monocarboxylate transporter 4 regulates maturation and trafficking of CD147 to the plasma membrane in the metastatic breast cancer cell line MDA-MB-231. Cancer Res. 2007;67:4182–4189. doi: 10.1158/0008-5472.CAN-06-3184. [DOI] [PubMed] [Google Scholar]
- 31.Pértega-Gomes N, Vizcaíno JR, Miranda-Gonçalves V, Pinheiro C, Silva J, Pereira H, et al. Monocarboxylate transporter 4 (MCT4) and CD147 overexpression is associated with poor prognosis in prostate cancer. BMC Cancer. 2011;11:312. doi: 10.1186/1471-2407-11-312. [DOI] [PMC free article] [PubMed] [Google Scholar]
- 32.R-Development-Core-Team, author. R: A language and environment for statistical computing. Vienna, Austria: R Foundation for Statistical Computing; 2011. ISBN 3-900051-07-0. [Google Scholar]
- 33.Therneau T. Survival: Survival analysis, including penalised likelihood. 2011. Original Report by T. Lumley. R package version 236-9; http://CRAN.R-project.org/package=survival. [Google Scholar]
- 34.Paget S. The distribution of secondary growths in cancer of the breast. 1889. Cancer Metastasis Rev. 1989;8:98–101. [PubMed] [Google Scholar]
- 35.Hart IR. ‘Seed and soil’ revisited: mechanisms of site-specific metastasis. Cancer Metastasis Rev. 1982;1:5–16. doi: 10.1007/BF00049477. [DOI] [PubMed] [Google Scholar]
- 36.Hart IR, Fidler IJ. Role of organ selectivity in the determination of metastatic patterns of B16 melanoma. Cancer Res. 1980;40:2281–2287. [PubMed] [Google Scholar]
- 37.Lisanti MP, Martinez-Outschoorn UE, Lin Z, Pavlides S, Whitaker-Menezes D, Pestell RG, et al. Hydrogen peroxide fuels aging, inflammation, cancer metabolism and metastasis: the seed and soil also needs “fertilizer”. Cell Cycle. 2011;10:2440–2449. doi: 10.4161/cc.10.15.16870. [DOI] [PMC free article] [PubMed] [Google Scholar]
- 38.Lisanti MP, Martinez-Outschoorn UE, Pavlides S, Whitaker-Menezes D, Pestell RG, Howell A, et al. Accelerated aging in the tumor microenvironment: connecting aging, inflammation and cancer metabolism with personalized medicine. Cell Cycle. 2011;10:2059–2063. doi: 10.4161/cc.10.13.16233. [DOI] [PMC free article] [PubMed] [Google Scholar]
- 39.Martinez-Outschoorn UE, Whitaker-Menezes D, Lin Z, Flomenberg N, Howell A, Pestell RG, et al. Cytokine production and inflammation drive autophagy in the tumor microenvironment: role of stromal caveolin-1 as a key regulator. Cell Cycle. 2011;10:1784–1793. doi: 10.4161/cc.10.11.15674. [DOI] [PMC free article] [PubMed] [Google Scholar]
- 40.Martinez-Outschoorn UE, Prisco M, Ertel A, Tsirigos A, Lin Z, Pavlides S, et al. Ketones and lactate increase cancer cell “stemness,” driving recurrence, metastasis and poor clinical outcome in breast cancer: achieving personalized medicine via Metabolo-Genomics. Cell Cycle. 2011;10:1271–1286. doi: 10.4161/cc.10.8.15330. [DOI] [PMC free article] [PubMed] [Google Scholar]
- 41.Martinez-Outschoorn UE, Goldberg A, Lin Z, Ko YH, Flomenberg N, Wang C, et al. Anti-estrogen resistance in breast cancer is induced by the tumor microenvironment and can be overcome by inhibiting mitochondrial function in epithelial cancer cells. Cancer Biol Ther. 2011;12:924–938. doi: 10.4161/cbt.12.10.17780. [DOI] [PMC free article] [PubMed] [Google Scholar]
- 42.Martinez-Outschoorn UE, Lin Z, Ko YH, Goldberg AF, Flomenberg N, Wang C, et al. Understanding the metabolic basis of drug resistance: therapeutic induction of the Warburg effect kills cancer cells. Cell Cycle. 2011;10:2521–2528. doi: 10.4161/cc.10.15.16584. [DOI] [PMC free article] [PubMed] [Google Scholar]
- 43.Whitaker-Menezes D, Martinez-Outschoorn UE, Flomenberg N, Birbe RC, Witkiewicz AK, Howell A, et al. Hyperactivation of oxidative mitochondrial metabolism in epithelial cancer cells in situ: visualizing the therapeutic effects of metformin in tumor tissue. Cell Cycle. 2011;10:4047–4064. doi: 10.4161/cc.10.23.18151. [DOI] [PMC free article] [PubMed] [Google Scholar]
- 44.Chiavarina B, Whitaker-Menezes D, Martinez-Outschoorn UE, Witkiewicz AK, Birbe RC, Howell A, et al. Pyruvate kinase expression (PKM1 and PKM2) in cancer-associated fibroblasts drives stromal nutrient production and tumor growth. Cancer Biol Ther. 2011;12:1101–1113. doi: 10.4161/cbt.12.12.18703. [DOI] [PMC free article] [PubMed] [Google Scholar]
- 45.Ko YH, Lin Z, Flomenberg N, Pestell RG, Howell A, Sotgia F, et al. Glutamine fuels a vicious cycle of autophagy in the tumor stroma and oxidative mitochondrial metabolism in epithelial cancer cells: Implications for preventing chemotherapy resistance. Cancer Biol Ther. 2011;12:1085–1097. doi: 10.4161/cbt.12.12.18671. [DOI] [PMC free article] [PubMed] [Google Scholar]
- 46.Balliet RM, Capparelli C, Guido C, Pestell TG, Martinez-Outschoorn UE, Lin Z, et al. Mitochondrial oxidative stress in cancer-associated fibroblasts drives lactate production, promoting breast cancer tumor growth: understanding the aging and cancer connection. Cell Cycle. 2011;10:4065–4073. doi: 10.4161/cc.10.23.18254. [DOI] [PMC free article] [PubMed] [Google Scholar]
- 47.Chiavarina B, Whitaker-Menezes D, Migneco G, Martinez-Outschoorn UE, Pavlides S, Howell A, et al. HIF1alpha functions as a tumor promoter in cancer associated fibroblasts, and as a tumor suppressor in breast cancer cells: Autophagy drives compartment-specific oncogenesis. Cell Cycle. 2010;9:3534–3551. doi: 10.4161/cc.9.17.12908. [DOI] [PMC free article] [PubMed] [Google Scholar]
- 48.Bergersen LH. Is lactate food for neurons? Comparison of monocarboxylate transporter subtypes in brain and muscle. Neuroscience. 2007;145:11–19. doi: 10.1016/j.neuroscience.2006.11.062. [DOI] [PubMed] [Google Scholar]
- 49.Pierre K, Pellerin L. Monocarboxylate transporters in the central nervous system: distribution, regulation and function. J Neurochem. 2005;94:1–14. doi: 10.1111/j.1471-4159.2005.03168.x. [DOI] [PubMed] [Google Scholar]
- 50.Dimmer KS, Friedrich B, Lang F, Deitmer JW, Bröer S. The low-affinity monocarboxylate transporter MCT4 is adapted to the export of lactate in highly glycolytic cells. Biochem J. 2000;350:219–227. doi: 10.1042/0264-6021:3500219. [DOI] [PMC free article] [PubMed] [Google Scholar]
- 51.Ullah MS, Davies AJ, Halestrap AP. The plasma membrane lactate transporter MCT4, but not MCT1, is upregulated by hypoxia through a HIF-1alpha-dependent mechanism. J Biol Chem. 2006;281:9030–9037. doi: 10.1074/jbc.M511397200. [DOI] [PubMed] [Google Scholar]
- 52.Brooks GA. Lactate shuttles in nature. Biochem Soc Trans. 2002;30:258–264. doi: 10.1042/BST0300258. [DOI] [PubMed] [Google Scholar]
- 53.Brooks GA. Current concepts in lactate exchange. Med Sci Sports Exerc. 1991;23:895–906. doi: 10.1249/00005768-199108000-00003. [DOI] [PubMed] [Google Scholar]
- 54.Magistretti PJ. Neuron-glia metabolic coupling and plasticity. J Exp Biol. 2006;209:2304–2311. doi: 10.1242/jeb.02208. [DOI] [PubMed] [Google Scholar]
- 55.Magistretti PJ. Role of glutamate in neuron-glia metabolic coupling. Am J Clin Nutr. 2009;90:875–880. doi: 10.3945/ajcn.2009.27462CC. [DOI] [PubMed] [Google Scholar]
- 56.Magistretti PJ, Pellerin L. The contribution of astrocytes to the 18F-2-deoxyglucose signal in PET activation studies. Mol Psychiatry. 1996;1:445–452. [PubMed] [Google Scholar]
- 57.Warburg O. On respiratory impairment in cancer cells. Science. 1956;124:269–270. [PubMed] [Google Scholar]
- 58.Warburg O. On the origin of cancer cells. Science. 1956;123:309–314. doi: 10.1126/science.123.3191.309. [DOI] [PubMed] [Google Scholar]
- 59.Vander Heiden MG, Cantley LC, Thompson CB. Understanding the Warburg effect: the metabolic requirements of cell proliferation. Science. 2009;324:1029–1033. doi: 10.1126/science.1160809. [DOI] [PMC free article] [PubMed] [Google Scholar]
- 60.Zu XL, Guppy M. Cancer metabolism: facts, fantasy and fiction. Biochem Biophys Res Commun. 2004;313:459–465. doi: 10.1016/j.bbrc.2003.11.136. [DOI] [PubMed] [Google Scholar]
- 61.Brizel DM, Schroeder T, Scher RL, Walenta S, Clough RW, Dewhirst MW, et al. Elevated tumor lactate concentrations predict for an increased risk of metastases in head-and-neck cancer. Int J Radiat Oncol Biol Phys. 2001;51:349–353. doi: 10.1016/S0360-3016(01)01630-3. [DOI] [PubMed] [Google Scholar]
- 62.Walenta S, Wetterling M, Lehrke M, Schwickert G, Sundfør K, Rofstad EK, et al. High lactate levels predict likelihood of metastases, tumor recurrence and restricted patient survival in human cervical cancers. Cancer Res. 2000;60:916–921. [PubMed] [Google Scholar]
- 63.Walenta S, Mueller-Klieser WF. Lactate: mirror and motor of tumor malignancy. Semin Radiat Oncol. 2004;14:267–274. doi: 10.1016/j.semradonc.2004.04.004. [DOI] [PubMed] [Google Scholar]
- 64.Walenta S, Salameh A, Lyng H, Evensen JF, Mitze M, Rofstad EK, et al. Correlation of high lactate levels in head and neck tumors with incidence of metastasis. Am J Pathol. 1997;150:409–415. [PMC free article] [PubMed] [Google Scholar]
- 65.Sculier JP, Nicaise C, Klastersky J. Lactic acidosis: a metabolic complication of extensive metastatic cancer. Eur J Cancer Clin Oncol. 1983;19:597–601. doi: 10.1016/0277-5379(83)90174-8. [DOI] [PubMed] [Google Scholar]
- 66.Varanasi UR, Carr B, Simpson DP. Lactic acidosis associated with metastatic breast carcinoma. Cancer Treat Rep. 1980;64:1283–1285. [PubMed] [Google Scholar]
- 67.McConnell AA, Parfitt VL, Walker PR. An unusual case of shock in a young woman. Postgrad Med J. 1989;65:120. doi: 10.1136/pgmj.65.760.120. [DOI] [PMC free article] [PubMed] [Google Scholar]
- 68.Warner E. Type B lactic acidosis and metastatic breast cancer. Breast Cancer Res Treat. 1992;24:75–79. doi: 10.1007/BF01832361. [DOI] [PubMed] [Google Scholar]
- 69.Evans TR, Stein RC, Ford HT, Gazet JC, Chamberlain GV, Coombes RC. Lactic acidosis. A presentation of metastatic breast cancer arising in pregnancy. Cancer. 1992;69:453–456. doi: 10.1002/1097-0142(19920115)69:2<453::AID-CNCR2820690230>3.0.CO;2-N. [DOI] [PubMed] [Google Scholar]
- 70.Cheng JC, Esparza SD, Knez VM, Sakamoto KM, Moore TB. Severe lactic acidosis in a 14-year-old female with metastatic undifferentiated carcinoma of unknown primary. J Pediatr Hematol Oncol. 2004;26:780–782. doi: 10.1097/00043426-200411000-00021. [DOI] [PubMed] [Google Scholar]
- 71.Bueno V, Binet I, Steger U, Bundick R, Ferguson D, Murray C, et al. The specific monocarboxylate transporter (MCT1) inhibitor, AR-C117977, a novel immunosuppressant, prolongs allograft survival in the mouse. Transplantation. 2007;84:1204–1207. doi: 10.1097/01.tp.0000287543.91765.41. [DOI] [PubMed] [Google Scholar]
- 72.Ovens MJ, Davies AJ, Wilson MC, Murray CM, Halestrap AP. AR-C155858 is a potent inhibitor of monocarboxylate transporters MCT1 and MCT2 that binds to an intracellular site involving transmembrane helices 7–10. Biochem J. 2010;425:523–530. doi: 10.1042/BJ20091515. [DOI] [PMC free article] [PubMed] [Google Scholar]


