

Abstract
Ovarian cancer progression is correlated with accumulation of aberrant CpG island methylation. In ovarian cancer, ascites fluid contains numerous Epidermal-Growth-Factor-Receptor (EGFR) activators, which could result in a tumor microenvironment of constant EGFR activation. Signaling pathways downstream of EGFR, such as Ras, regulate DNA methylation. We hypothesized that chronic EGFR activation could alter DNA methylation. We found that EGFR activation increased DNA methyltransferase (DNMT) activity acutely, as well as after long-term EGF treatment or expression of a mutationally activated EGFR. Furthermore, this increase in DNMT activity was dependent on EGFR catalytic activity and resulted in increased global DNA methylation. Additionally, treatment with the DNMT inhibitor/hypomethylating agent 5-Aza-2′-deoxycytidine (AZA) inhibited the EGF induced increase of both DNMT activity and global methylation. These data support a role for EGFR in the process of accumulated DNA methylation during ovarian cancer progression and suggest that epigenetic therapy may be beneficial for the treatment of ovarian cancer.
Key words: ovarian cancer, DNA methylation, epidermal growth factor receptor, DNA methyltransferase, epigenetics, E-cadherin
Introduction
As the leading cause of death arising from gynecological malignancies, ovarian cancer is estimated to claim 15,460 lives in 2011.1 Ovarian cancer progression is characterized by the accumulation of ascites in which there are several activators of Epidermal Growth Factor Receptor (EGFR) including heparin-binding EGF (HB-EGF), endothelin-1 (ET-1) and lysophosphatidic acid (LPA).2 The presence of these activators in patient ascites suggests that the tumor microenvironment is under chronic EGFR activation and may account for the observation that approximately 35% of all ovarian cancer tumors are positive for activated EGFR (tyrosine phosphorylated EGFR).3,4 Overexpression of EGFR, and its ligands, has been detected in ovarian tumors and correlates with poor prognosis.3,5,6
EGFR is a member of the receptor tyrosine kinase family that possesses intrinsic tyrosine kinase activity. Activation of EGFR stimulates numerous downstream signaling cascades including Ras and Extracellular-signal Regulated Kinase (ERK)/Mitogen Activated Protein Kinase (MAPK), which are associated with cell growth, proliferation, survival, angiogenesis, cell migration, cell-cell/cell-matrix interaction and tumor metastasis.2,3,7,8 Activation of EGFR is also reported to induce an epithelial to mesenchymal transition (EMT).2,3,9,10 EMT is important in development and wound healing, but there is strong evidence that it also plays a role in tumor progression and metastasis.11–13 EMT is characterized by the loss of epithelial markers such as the intercellular adhesion molecule E-cadherin and the induction of mesenchymal markers such as vimentin.11–13 The presence of such EMT markers in cancer is correlated with poor prognosis.11–13 Changes in gene expression during EMT have been shown to be dependent on epigenetic mechanisms.14,15 In particular, in breast cancer cells, loss of E-cadherin by the epigenetic mechanism of promoter methylation results in cells with a mesenchymal morphology; however, when E-cadherin is inactivated by mutation, the cells retain their epithelial morphology.14,15 These findings indicate that downregulation of E-cadherin is not sufficient to induce EMT; rather, EMT requires epigenetic downregulation of E-cadherin to induce EMT.14,15
Epigenetic changes are defined as heritable changes in gene expression that occur without changes to the DNA sequence.16 The best-known epigenetic mark is DNA methylation of cytosine residues within CG rich areas of the genome known as CpG islands, which are present in the promoter regions of many genes.17 Hypermethylation resulting in transcriptional repression has been documented in several human cancers including ovarian cancer.18–23 CpG island methylation is known to be cumulative during ovarian cancer progression22 and methylation of several genes, including tumor suppressor genes (BRCA1, RASSF1A) and cell adhesion genes (CDH1, CDH13), has been documented in ovarian cancer.21,24,25 Methylation is carried out by DNA methyltransferases (DNMTs). DNMT1 is described as the maintenance methyltransferase, which preferentially methylates hemi-methylated DNA, while DNMT3A and DNMT3B are de novo methyltransferases.26,27 Methylation of DNA by DNMTs is an enzymatic process and increases in this enzyme activity have been correlated with cancer progression and poor prognosis.28 Additionally, DNMT expression, activity and resulting DNA methylation are regulated by Ras and ERK/MAPK, which function downstream of the EGFR.27,29–31 This suggests that activation of EGFR and its subsequent signaling pathways may play a role in DNMT expression and DNA methylation.
In order to evaluate potential epigenetic changes arising from EGFR activation within the tumor microenvironment, we stimulated ovarian cancer cells with EGF in vitro. We hypothesized that long-term EGFR activation could increase DNMT activity or DNA methylation. Our studies indicate that long-term EGF exposure or expression of a mutationally activated EGFR increases DNMT activity as well as global DNA methylation and these alterations were found to be dependent on continued EGFR activation. To our knowledge, this is the first evidence that persistent EGFR activation modulates DNMT activity and DNA methylation.
Results
Acute and long-term EGFR activation increase DNMT activity.
Ovarian cancer cells (OVCA 433) acutely treated with 10 nM EGF exhibited an approximately 2-fold increase in total DNMT activity (Fig. 1A). Significant increases from untreated control cells were observed following 15 min (0.25 h) and 24 h of EGF treatment. Similarly, we evaluated DNMT activity in human fibroblast HS68 cells after EGF stimulation and observed a 2-fold increase in DNMT activity after acute (15 min) EGF treatment (Fig. 1B). HS68 fibroblasts are mesenchymal cells that express the EGFR but cannot undergo EMT upon EGFR activation. In this way, we separate EGFR activation from the mesenchymal cell phenotype. Thus, increased DNMT activity results from EGFR activation rather than occurring as a consequence of EMT or the mesenchymal phenotype. We also measured total DNMT activity after long-term EGFR activation (Fig. 1C). Long-term EGF treatment also induced a significant increase in DNMT activity. Furthermore, this increase in activity was reversible when EGF was removed for 7 d, indicating a dependence on constant EGFR activation. OVCA 433 cells stably transfected with a constitutively active mutational variant of the EGFR [EGFRvIII (A1)6] were evaluated as an alternate model of persistent EGFR activation. Inhibition of EGFRvIII kinase activity by treatment with AG1478 for 24 h led to a significant decrease in DNMT activity further demonstrating that the increase in DNMT activity is dependent on EGFR activation (Fig. 1D). Experiments with the hypomethylating agent 5-Aza-2′-deoxycytidine (AZA) were also performed (Fig. 1E). AZA is a nucleoside analog that is incorporated into DNA during replication and inhibits DNA methylation by trapping DNMTs onto DNA thereby decreasing their availability to work properly within the cell.32 As expected, AZA treatment of ovarian cancer cells prevented the EGF induced increase in DNMT activity.
Figure 1.

Acute and long-term EGF treatment increase DNMT activity. (A) Normalized DNMT activity following acute EGF treatment, n = 5. One way ANOVA revealed a significant overall effect of EGF treatment F(3,19) = 4.815, p = 0.0142. Dunnet's post hoc revealed a significant increase from control cells in DNMT activity at 0.25 h and 24 h. (B) Normalized DNMT activity following acute EGF treatment (15 min) in HS68 fibroblasts. Data were normalized to control, untreated ovarian cancer 433 cells run simultaneously within the experiment. t-test showed a significant increase in DNMT activity in HS68 cells treated with 10 nM EGF, n = 3. (C) Normalized DNMT activity for control, long-term EGF treated (EGF) and long-term EGF followed by 7 d removal from EGF (7dR), n = 5. One way ANOVA followed by Tukey's post hoc revealed a significant increase in DNMT activity after long-term EGF. Additionally, 7dR removal samples were significantly decreased compared with EGF samples, #p < 0.05. (D) Normalized DNMT activity of cells expressing the constitutively active EGFRvIII (A1) and A1 cells treated with 2 µM of the EGFR inhibitor AG1478, n = 5. Standard unpaired t-test revealed that DNMT activity was significantly reduced when the EGFR kinase activity was inhibited. (E) Normalized DNMT activity for control and EGF treated samples with and without 5 µM 5-Aza-2′-deoxycytidine (AZA) for 3 d, n = 4. One way ANOVA followed by Tukey's post hoc revealed that EGF treatment caused a significant increase from control and AZA treated samples. Furthermore, this increase in DNMT activity with EGF was significantly decreased with AZA treatment. All data were normalized to the average values of control, untreated samples run within the same experiment, thus data are expressed relative to 1 (control). *p < 0.05, **p < 0.01.
EGFR activation increases DNA methylation in ovarian cancer cells and this increase is dependent on the tyrosine kinase activity of EGFR and can be blocked by AZA treatment.
In order to evaluate the outcome resulting from increased DNMT activity, we measured global DNA methylation (total 5-methyl-cytosine content) within the experimental groups (Fig. 2A). Data were normalized to values obtained for control cells and graphed as a percentage of the control. Total 5-methyl-cytosine content was increased by approximately 50% after long-term EGF exposure and the response was reversible. Following 7 d of EGF removal, DNA methylation approached control levels thus showing that the increased methylation status was perpetuated by EGFR activation. We also evaluated global methylation of A1 cells treated with the EGFR inhibitor AG1478 (Fig. 2B). Standard unpaired t-test showed a significant decrease in global methylation of A1 cells when the EGFRvIII tyrosine kinase activity was blocked with AG1478 for 24 h. This confirms that the increase in methylation is dependent on EGFR activation. Global methylation in AZA treated control and long-term EGF samples were also evaluated (Fig. 2C). While AZA treatment alone did not produce a significant decrease in global methylation in control samples, it did reverse the EGF-induced increase in global methylation. Similarly, AZA treatment of A1 cells also produced a significant decrease in global methylation (Fig. 2D).
Figure 2.
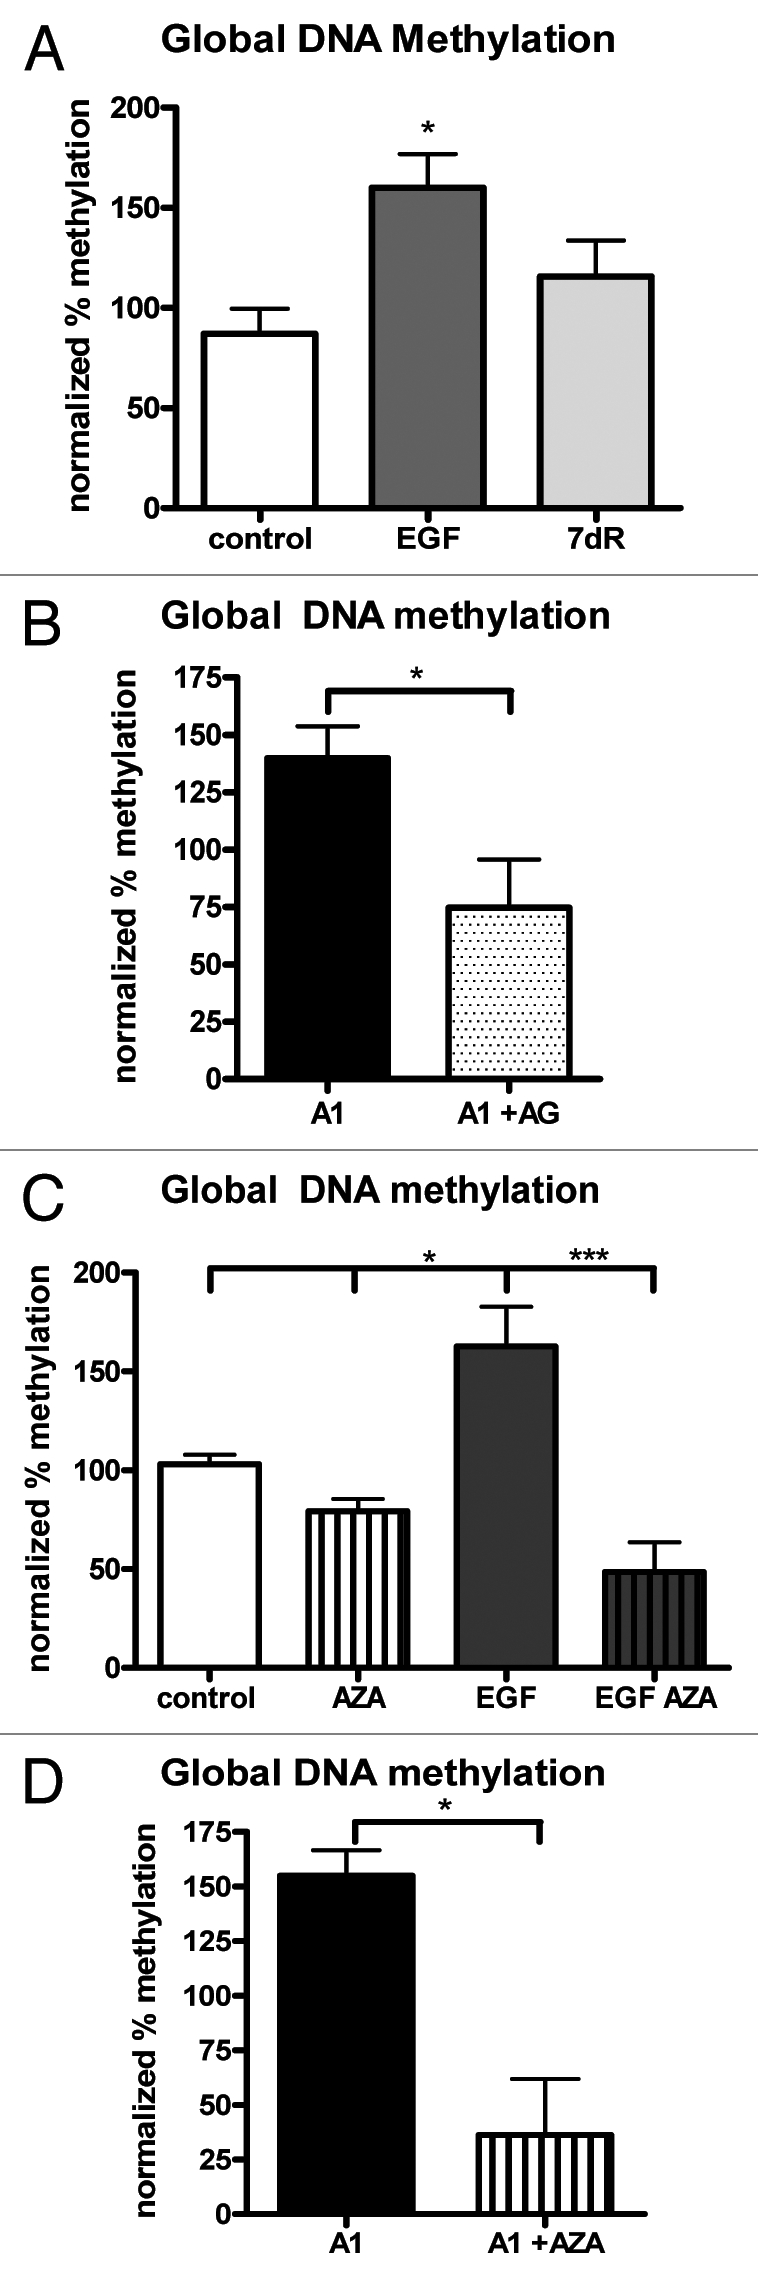
EGFR activation increases global DNA methylation. (A) Normalized percent DNA global methylation for control, long-term EGF treated (EGF) and long-term EGF followed by 7 d removal from EGF (7dR), n = 6. One way ANOVA followed by Tukey's post hoc revealed a significant increase in global DNA methylation after long-term EGF. (B) Normalized percent DNA global methylation for EGFRvIII (A1) and A1 cells treated with the EGFR inhibitor AG1478, n = 4. Unpaired t-test showed a significant decrease in global DNA methylation when EGFR activation was blocked with 2 µM AG1478 for 24 hrs. (C) Normalized global methylation for control and EGF treated samples with and without 5 µM 5-Aza-2′-deoxycytidine (AZA) for 3 d, n = 4. One way ANOVA followed by Tukey's post hoc revealed EGF treated samples were significantly increase compared with control and AZA treated samples. Furthermore, the increase in global methylation with EGF was significantly decreased with AZA treatment. (D) Normalized global methylation for A1 cells with and without AZA for 3 d, n = 3. Unpaired t-test revealed a significant decrease in the global methylation of A1 cells following treatment with AZA. All data were normalized and graphed as a percentage of control, untreated samples run simultaneously with within the experiment. *p < 0.05, ***p < 0.001.
Constitutive EGFR activation results in alterations to DNA methylation across specific genes.
The degree of DNA methylation across a defined panel of genes was evaluated in control, long-term EGF treated and A1 cells using a DNA Methylation PCR breast cancer signature panel MethylProfiler™ array (Fig. 3A–C). This signature panel was chosen based on representation of several genes commonly altered in ovarian cancer,21,24,25 as denoted by an asterisk beside each gene within the figure. The percent of unmethylated (clear region), intermediately methylated (dotted region) and hypermethylated (checkered region) DNA for each gene is expressed as a percentage of total input DNA. EGF treated samples showed similar patterns of methylation compared with controls for the genes tested, and surprisingly showed 2 genes that had significant decreases in methylation compared with controls, as denoted by the arrows in Figure 3B (ESR1 and RASSF1) (Table 1). Alternatively, A1 cells showed two genes with significant increases in methylation, also denoted with arrows in Figure 3C (CCNA1, CDH13) (Table 1).
Figure 3.

Constitutive EGFR activation results alterations to methylation status across certain genes. MethylProfiler™ DNA PCR array data showing degree of methylation for a subset of genes in control (A), long-term EGF treated (EGF) (B) and EGFRvIII (A1) (C) samples, n = 6–9. *Denotes genes known to undergo epigenetic regulation in ovarian cancer.22 Graphs show the levels of unmethylated, intermediate methylation and hypermethylated DNA from the total input DNA in percentage for each gene. Arrows denote genes found to have significant alterations to DNA methylation compared with control cells. See Table 1 for details.
Table 1.
Comparison of genes found to have significant alterations to methylation status
| EGF | EGFRvIII (A1) | ||||
| Gene | unmethylated | hypermethylated | unmethylated | hypermethylated | Net result (compared with control) |
| CCNA1 | - | - | ▾, p < 0.05 | ▴, p < 0.01 | Increased methylation |
| CDH13 | - | - | - | ▴, p < 0.01 | Increased methylation |
| ESR1 | - | ▾, p < 0.05 | - | - | Decreased methylation |
| RASSF1 | ▴, p < 0.01 | - | - | - | Decreased methylation |
CpG island methylation evaluation of CDH13 and CDH1.
Further evaluation of methylation patterns for CDH13 and CDH1 were performed using MethylSpecific PCR (MSP) using sequences for methylated and unmethylated primers to CDH13, as previously reported in reference 33, and multiple CpG islands within the CDH1, as previously reported in reference 34, (Table 2). CDH13 (H-cadherin) showed approximately 50–90% methylation based on data generated from the MethylProfiler™ experiments (Fig. 3); it was also one of the genes that showed a significant increase in methylation in A1 cells compared with controls (Table 1). MSP experiments showed that CDH13 was methylated in control, EGF treated and A1 samples (Fig. 4A). Because E-cadherin expression is absent in A1 cells,6 we also evaluated specific CpG islands within the CDH1 promoter to see if the absence in E-cadherin expression was due to DNA methylation. A schematic of the CpG islands investigated is shown in Figure 4B and was adapted from Graff et al. Analysis of CpG islands within the CDH1 promoter indicates that only island 1 was partially methylated in our A1 samples whereas it remained unmethylated in control and EGF treated samples (Fig. 4C). CpG islands 2, 3 and 4 were unmethylated in all treatment groups (data not shown).
Table 2.
Sequences of methylated and unmethylated forward and reverse primers for methylspecific PCR experiments
| Gene/CpG Island | Methylated pair (5′-3′) forward/reverse | Product size | Unmethylated pair (5′-3′) forward/reverse | Product size | Anneal temp |
| CDH13 | TCG CGG GGT TCG TTT TTC GC | 243 bp | TTG TGG GGT TGT TTT TTG T | 242 bp | 60°C |
| GAC GTT TTC ATT CAT ACA CGC G | AAC TTT TCA TTC ATA CAC ACA | ||||
| CDH1/1 | TTA GGT TAG AGG GTT ATC GCG T | 116 bp | TAA TTT TAG CTT AGA GGG TTA TTG T | 97 bp | 54°C |
| TAA CTA AAA ATT CAC CTA CCG AC | CAC AAC CAA TCA ACA ACA CA | ||||
| CDH1/2 | GTG GGC GGG TCG TTA GTT TC | 172 bp | GGT GGG TGG GTT GTT AGT TTT GT | 174 bp | 61°C |
| CTC ACA AAT ACT TTA CAA TTC CGA CG | AAC TCA CAA ATC TTT ACA ATT CCA ACA | ||||
| CDH1/3 | GGT GAA TTT TTA GTT AAT TAG CGG TAC | 204 bp | GGT AGG TGA ATT TTT AGT TAA TTA GTG GTA | 211 bp | 61°C |
| CAT AAC TAA CCG AAA ACG CCG | ACC CAT AAC TAA CCA AAA ACA CCA | ||||
| CDH1/4 | GCG TTT GGT CGC GGA GTT C | 144 bp | GGG GTG TTT GGT TGT GGA GTT T | 147 bp | 63°C |
| TTC CCT CAA AAA TCG TCC CCA C | TTC CCT CAA AAA TCA TCC CCA C |
Figure 4.

Methylspecific PCR (MSP) analysis of CDH13 (H-cadherin) and CDH1 (E-cadherin). (A) Evaluation of CpG island methylation in CDH13 (H-cadherin) by MSP in control, long-term EGF treated (EGF) and EGFRvIII (A1) samples “+” denotes methylated positive control. At this specific CpG island previously described in Kuphal et al.40 all samples were found to be methylated. (B) Schematic of CDH1 (E-cadherin) CpG island map adapted from Graff et al.34 Amplified products for each CpG island evaluated in this study are depicted by dotted lines. (C) Representative MSP result for island 1 for control, EGF and A1 samples, “+” denotes methylated positive control. A1 samples where shown to be methylated on CpG island 1. (D) Representative MSP result for CDH island 1 for A1 cells treated with 2 µM AG1478 for 24 h or 5 µM 5-Aza-2′-deoxycytidine (AZA) for 3 d. Neither AG1478 nor AZA were sufficient to reverse methylation of CpG island1 in A1 cells. All results show products yielded from PCR with Methylated (M) or Unmethylated (U) primer sets (see Table 2).
In order to examine if CDH1 CpG island 1 methylation was dependent on continued EGFR activation, we treated A1 samples with 2 µM AG1478 for 24 h and performed MSP. We found that inhibition of EGFR activity by AG1478 was not sufficient to reverse CDH1 CpG island 1 methylation in A1 cells, but neither was treatment with the hypomethylating agent AZA (Fig. 4D). This observation is supported by the finding that neither AG1478 nor AZA were sufficient to re-induce mRNA or protein expression of E-cadherin in A1 cells, in contrast to re-expression of CDH13 mRNA following AZA treatment (data not shown).
Discussion
In the present study, we examined the possibility that long-term EGFR activation could lead to epigenetic alterations in ovarian cancer cells, mainly DNA methylation. This work may have clinical significance given that the ovarian tumor environment contains numerous EGFR activators2 and approximately 35% of all ovarian cancer tumors are positive for activated EGFR.3,4 Using an in vitro paradigm of EGF exposure of OVCA 433 cells, we found that acute and long-term EGFR activation increases DNMT activity. It is important to note the observed increase in DNMT activity is an increase in total DNMT activity and does not distinguish the relative contributions of the maintenance methyltransferase (DNMT1) or de novo methyltransferases (DNMT3A and DNMT3B). Relative contributions of DNMTs and how they can mediate increases in DNMT activity is an area of ongoing investigation. Regulation of DNMT activity can occur by several possible mechanisms, e.g., posttranslational modifications to DNMTs such as phosphorylation and sumoylation,35–37 as well as interactions with other proteins such as DNMT3L, which can regulate the activity of DNMT3A and 3B,38 or PARP-1, whose polymers prevent the enzymatic activity of DNMT1.39 Thus, a mechanism for how EGFR mediates this increase in DNMT activity has not been fully elucidated. However, our studies show that increases in DNMT activity were dependent on continued EGFR activation and ultimately resulted in an increase in global DNA methylation following long-term EGF exposure. To our knowledge, this is the first evidence that EGFR activation can cause such epigenetic alterations and it may be a contributing factor to why DNA methylation is cumulative in ovarian cancer progression.22
EGF-induced alterations to DNMT activity and DNA methylation required persistent activation of the EGFR. The responses are, in fact, dependent on EGFR activation and not simply a result of EMT, based on the observation that EGF treatment increased DNMT activity in HS68 fibroblasts that express the EGFR but cannot undergo EMT. Additionally, the EGF-dependent responses were reversed when the signal was discontinued by ligand removal or inhibition of kinase activity. As expected, use of the hypomethylating agent 5-Aza-2′-deoxycytidine (AZA) prevented EGF-induced increase in DNMT activity as well as global methylation. EGF-treated cells did show an increase in global methylation, but also showed decreases in DNA methylation for ESR1 and RASSF1, compared with controls in a defined gene panel. Methylation resulting in decreased expression of both of these genes has been documented in ovarian cancer cells lines;22,40 however, the degree of methylation can vary from cell line to cell line.40 Our observations suggest that following EGFR activation there can be a restructuring of the DNA methylation pattern such that some genes may undergo decreases in methylation and others may undergo increases in methylation. The increase in global DNA methylation observed following EGF treatment suggests that the net outcome is increased methylation over all genes, despite the significant decrease observed in ESR1 and RASSF1. Assays evaluating a subset of genes, such as the MethylProfiler™ array, can potentially fail to detect genes that are undergoing increased methylation; thus, future studies will focus on a larger, more unbiased assessment.
A1 cells served as another model of persistent EGFR activation. The constitutive EGFR activation conferred by expression of EGFRvIII and the observed mesenchymal phenotype6 might reflect a more advanced tumor stage. Data obtained from A1 cells closely resembled data obtained for cells treated with EGF long-term. Specifically, A1 cells showed increased DNMT activity and global DNA methylation and this increase was dependent on continued EGFR activation. Furthermore, these increases were also inhibited by AZA treatment. It is important to note that the two models (long-term EGF and A1) represent two different durations of EGFR activation and did not coincide in all aspects. According to data obtained from MethylProfiler™ experiments, EGF treated samples showed significant decreases in methylation of ESR1 and RASSF1 while A1 samples demonstrated a significant increase in methylation in a separate set of genes, compared with controls. Because both long-term EGF treatment and expression of EGFRvIII have the net effect of significantly increasing global methylation, this suggests that stable methylation of specific targets may require longer duration of receptor activation, as provided by EGFRvIII expression. A1 samples showed a significant increase in methylation of CCNA1 and CDH13. Recently, evidence linking DNMT1 activity to methylation of CCNA1 was established when decreasing expression of DNMT1 in cervical cancer cells led to decreased methylation of CCNA1.41 This is consistent with our observation that EGF-induced increases in DNMT activity result in increased methylation of CCNA1. CDH13 (H-cadherin), which is commonly methylated in ovarian cancer,21,24 showed significant increases in DNA methylation in A1 cells, compared with control cells. However, MSP analysis of CDH13 revealed that all samples, control, EGF treated and A1 were methylated in the region analyzed by published primers.33 Since we did not detect a difference between control and A1 samples in MSP experiments as we did with the MethylProfiler™, which contains primers incorporating several CpG islands over a CG rich area of the promoter, we believe this particular MSP primer sequence corresponds to a region of the gene that is highly methylated in ovarian cancer. While CDH1 (E-cadherin) did not display a significant increase in methylation based on MethylProfiler™ data, it did show a trend for an increase in methylation and is a gene previously shown to be methylated in EMT and ovarian cancer.14,25 Additionally, since E-cadherin expression, as measured by mRNA and protein, is known to be completely absent in A1 cells,6 we conclude that the ∼20% methylation observed in A1 cells in the MethylProfiler™ data likely corresponds to the increased methylation on CpG island 1 and may contribute to the loss of E-cadherin expression in this cell line.
Incidentally, neither inhibition of the EGFR tyrosine kinase activity nor AZA treatment prevented CpG island 1 methylation or re-induced expression of E-cadherin, thus suggesting that this particular island may be resistant to demethylation. In fact, 5 µM AZA treatment of ovarian cancer cells for 3 d previously showed genes and several specific CpG islands that were resistant to demethylation by AZA.23 A1 cells were the only group to show CpG island 1 methylation and this may suggest a continuum of response where the long-term EGF treatment conditions used in these studies represent an intermediate stage of tumor response and A1 cells reflect a more advanced tumor stage of much longer duration of EGFR activation, resulting in an increase in degree of DNA methylation.
Current literature on epigenetic alterations in ovarian cancer suggests that accumulation of epigenetic alterations is associated with advanced grade and stage of the disease (reviewed in refs. 42 and 43). Among the epigenetic changes, alterations to DNMT expression,26 increased methylation of imprinted tumor suppressor genes,44 and gene targets for methylation that predict survival, relapse and response to treatment42 have been previously reported. Epigenetic drugs such as AZA, as well as EGFR targeted drugs, have received some attention in treating platinum-resistant ovarian cancer.45–47 Ovarian cancer progression is positively correlated with cumulative aberrant DNA methylation that is believed to silence expression of tumor suppressor genes thus rendering those cells resistant to conventional chemotherapy.47 Hypomethylating agents, such as AZA or decitabine, allows for re-expression of these tumor suppressor genes and restoration of the drug response apoptotic pathway.45,47 Our studies clearly suggest a link between EGFR activation and DNA methylation through stimulation of DNMT activity. They also suggest that EGF mediated alterations to DNMT activity and global methylation can be prevented with hypomethylating agents such as AZA. Future studies will examine specific signaling pathways downstream of the EGFR that might play a role in the methylation anomalies observed.
Materials and Methods
Cell culture.
The ovarian carcinoma cell line OVCA 433 was provided by Dr. Robert Bast Jr, MD Anderson Cancer Center, and grown in Minimum Essential Medium Eagle (MEME) (Sigma) supplemented with 10% (v/v) fetal bovine serum (FBS) (Gibco, Invitrogen, Carlsbad, CA), 1 mM sodium pyruvate (Sigma), 2 mM L-glutamine (Sigma), 0.5 units/mL penicillin (Sigma), 0.5 µg/mL streptomycin (Sigma) (this media is later referred to as complete growth media). EGFRvIII-transfected OVCA 433 clone (A1) cells6 were maintained and selected in complete growth media with 300 µg/mL G418 (Gibco, Invitrogen). For inhibitor experiments, A1 cells were treated with 2 µM of the EGF receptor tyrosine kinase inhibitor AG1478 (LC laboratories) for 24 h. Human fibroblasts HS68 cells (obtained from ATCC) were used to examine the effects of EGF treatment in cells that could not undergo EMT. HS68 cells are known to express endogenous EGFR, which can decrease at higher passages,48 thus we used low passage cells for our experiments (below P15). HS68 cells were cultured in Dulbecco's Modified Eagle's Medium (DMEM) (Sigma) supplemented with 10% (v/v) fetal bovine serum (FBS) (Gibco, Invitrogen), 1 mM sodium pyruvate (Sigma), 4 mM L-glutamine (Sigma), 0.5 units/mL penicillin (Sigma), 0.5 µg/mL streptomycin (Sigma). All cells were maintained at 37°C under 5% CO2/95% air. Long-term EGFR activation in ovarian cancer cells was conducted for approximately 40 d using 10 nM EGF (Biomedical Technologies) added to complete growth media. Untreated cells were carried in parallel as passage controls. During long-term EGF paradigm, media, with and without 10 nM EGF, was changed every other day. Following the long-term EGF paradigm for ∼40 d, EGF was removed and cells were maintained in culture for 7 additional days in complete growth media to observe cellular response to EGF withdrawal; these samples were termed 7 d removal samples (7dR). 7dR samples were passaged once during the 7 d removal paradigm in order to prevent confounding variables associated with cell overgrowth. Throughout treatments, EGF treated, A1 and passage control cells were passaged prior to reaching 90% confluency on the plate thus avoiding potential confounds of contact inhibition. All cell collections were performed when cells were approximately 75–85% of confluent density.
5-Aza-2′-deoxycytidine (AZA) treatment.
Cells that were to be treated with AZA were plated in normal growth media and allowed to adhere to the plate and proliferate for 24–48 h prior to treatment. Cells were then treated with 5 µM 5-Aza-2′-deoxycytidine (AZA) (Sigma) for 3 d at 37°C under 5% CO2/95% air. Long-term EGF treated cells were treated for approximately 40 d with 10 nM EGF and then co-cultured with 10 nM EGF and 5 µM AZA for 3 additional days. Because aqueous solutions of AZA are unstable, normal growth media with or without AZA was replenished daily.
DNMT activity assay.
Cells were harvested and nuclear extracts were generated using the EpiQuik Nuclear Extraction Kit (Epigentek) according to the manufacturer's protocol. Protein concentrations for nuclear extracts were determined using the BCA protein assay kit (Thermo Fisher Scientific/Pierce). Total DNMT activity was determined using 15–20 µg total protein and the EpiQuik DNA Methyltransferase (DNMT) Activity/Inhibition Assay Kit as recommended by the vendor. The amount of methylated DNA is proportional to the DNMT enzymatic activity, which is detected by microplate reader at 450 nm. DNMT activity is calculated by the following equation:
Activity (OD/h/mg) = sample OD − blank OD/(µg protein × initial incubation time in hours) × 1,000
Sample values were normalized to values obtained for control, untreated OVCA 433 cells within the same experiment and expressed relative to one.
Global DNA methylation quantification.
Global DNA methylation was evaluated using 500 ng of DNA and the MethylFlash Methylated DNA Quantification Kit (Epigentek) according to the manufacturer's protocol. The amount of 5-methyl-cytosine within each sample is determined by a colorimetric assay, which is detected by microplate reader at 450 nm. Quantification of DNA methylation is calculated by the following equation:
Methylation = sample OD − blank OD/(slope of standards × 2)
Sample values were normalized to values obtained for control, untreated OVCA 433 cells within the same experiment and expressed as a percentage increase from 100% (control).
DNA isolation and DNA methylation PCR array.
DNA was isolated from cells using the DNeasy Blood and Tissue Kit according to manufacture's protocol (Qiagen). The methylation status of selected genes was evaluated using the MethylProfiler™ DNA Methylation PCR Array: Human Breast Cancer Signature Panel (SABioscience). Using 1.0 µg of total DNA, the analysis was conducted according to the manufacturer's protocol. Briefly, total DNA was separated into 4 digestion reactions: Mo, mock digestion (leaving both hypermethylated and unmethylated DNA); Ms, methylation-sensitive digestion (cutting unmethylated DNA and leaving hypermethylated DNA intact); Md, methylation-dependent digestion (cutting hypermethylated DNA and leaving unmethylated DNA intact); and Msd, methylation-sensitive and methylation-dependent digestion (cutting both hypermethylated and unmethylated DNA, giving background signal) and incubated with the appropriate enzyme supplied as Methyl-Profiler Enzyme Kit (SABioscience). DNA digestions were performed at 37°C, overnight. Enzymes were inactivated at 65°C for 20 min prior to the addition of PCR Master Mix RT2 Real-Time SYBR Green/ROX (SABioscience). Digested DNA/SYBR Green mixture was added to the plate according to manufacturer's protocol. PCR was run in 7900HT Fast Real Time PCR system (Applied Biosystems) and the SDS 2.2.2 program (Applied Biosystems) was used to determine threshold (Ct) values. Cycles were programmed as follows: 1 cycle, 95°C, 10 min followed by 40 cycles of 97°C for 15 sec and 72°C for 1 min.
Methylation data analysis.
The MethylProfiler™ PCR Array Excel-based data analysis template was downloaded from the SABioscience website at: http://www.sabiosciences.com/dna_methylation_data_analysis.php. Ct values for each digestion (Mo, Ms, Md, Msd) were entered into the raw data table and results were automatically determined by the template through a series of mathematical equations for each gene analyzed. These equations and calculations are described in detail in the MethylProfiler™ DNA Methylation PCR Array System User Manual (SABioscience). Briefly, the percent hypermethylation/unmethylation/intermediate methylation was calculated by these equations using the appropriate Ct values obtained from either the Ms or Md digestions with Mo values used to normalize and Msd values subtracted as background.
Methylspecific PCR (MSP).
For MethylSpecific PCR (MSP) experiments, a positive control was generated from control OVCA 433 DNA using CpG Methylase (M.SssI) (Zymo Research) which methylates all cytosine residues in double stranded, non-methylated and hemi-methylated DNA. The methylation reaction was performed using 8 µl of a DNA sample (with DNA concentrations between 100–200 ng/µl) and incubated for 2.5 h at 33°C as illustrated in the manufacturer's protocol (Zymo Research). Approximately 1,000 ng of total DNA for the positive control, OVCA 433, EGF treated and A1 samples were then bisulfite treated with the EZ Methylation Kit according to the manufacturer's protocol (Zymo Research). MSP was then performed on bisulfite treated DNA using the conditions and primer pairs for the CDH13 (H-cadherin) and CDH1 (E-cadherin) CpG islands (Sigma) listed in Table 2. CpG islands, primer pairs and conditions for MSP were previously described for CDH13 (H-cadherin),33 and CDH1 (E-cadherin),34 ZymoTaq PreMix (Zymo Research) was used for MSP and PCR cycle conditions were performed as suggested in the manufacturer's protocol (Zymo Research). PCR products were then electrophoresed in a 2% agarose gel containing SYBER Safe DNA Gel Stain (Invitrogen) at a 1:10,000 dilution. DNA bands were then visualized under UV illumination using the Kodak Image Station 440 (NEN Life Science Products).
Graphing and statistical analysis.
Data were graphed and analyzed using GraphPad Prism Software 4.0 and IBM SPSS Statistics 18 using ANOVA and Tukey's or Dunnet's post hoc test analysis where appropriate. If applicable, standard unpaired t-test was used in place of ANOVA.
Acknowledgments
We thank Joshua Roxby for technical assistance and Dr. Reema Zeineldin for initial characterization of the A1 cell line. We also thank Dr. Kevin Caldwell for helpful discussion in manuscript preparation. This study was supported by RO1 CA109545 and K12GM088021. We would also like to thank the UNM Cancer Center NCI P30 CA118100 for support. The content is solely the responsibility of the authors and does not necessarily represent the official views of the National Institute of General Medical Sciences or the National Institutes of Health.
Abbreviations
- EGFR
epidermal growth factor receptor
- EGF
epidermal growth factor
- DNMT
DNA methyltransferase
- EMT
epithelial to mesenchymal transition
- MSP
methylspecific PCR
- AZA
5-Aza-2′-deoxycytidine
Disclosure of Potential Conflicts of Interest
The authors report no potential conflict of interest.
References
- 1.Siegel R, Ward E, Brawley O, Jemal A. Cancer statistics 2011: the impact of eliminating socioeconomic and racial disparities on premature cancer deaths. CA Cancer J Clin. 2011;61:212–236. doi: 10.3322/caac.20121. [DOI] [PubMed] [Google Scholar]
- 2.Hudson LG, Moss NM, Stack MS. EGF-receptor regulation of matrix metalloproteinases in epithelial ovarian carcinoma. Future Oncol. 2009;5:323–338. doi: 10.2217/fon.09.10. [DOI] [PMC free article] [PubMed] [Google Scholar]
- 3.Zeineldin R, Muller CY, Stack MS, Hudson LG. Targeting the EGF receptor for ovarian cancer therapy. J Oncol. 2010;2010:414676. doi: 10.1155/2010/414676. [DOI] [PMC free article] [PubMed] [Google Scholar]
- 4.Cowden Dahl KD, Symowicz J, Ning Y, Gutierrez E, Fishman DA, Adley BP, et al. Matrix metalloproteinase 9 is a mediator of epidermal growth factor-dependent e-cadherin loss in ovarian carcinoma cells. Cancer Res. 2008;68:4606–4613. doi: 10.1158/0008-5472.CAN-07-5046. [DOI] [PMC free article] [PubMed] [Google Scholar]
- 5.Lafky JM, Wilken JA, Baron AT, Maihle NJ. Clinical implications of the ErbB/epidermal growth factor (EGF) receptor family and its ligands in ovarian cancer. Biochim Biophys Acta. 2008;1785:232–265. doi: 10.1016/j.bbcan.2008.01.001. [DOI] [PubMed] [Google Scholar]
- 6.Zeineldin R, Rosenberg M, Ortega D, Buhr C, Chavez MG, Stack MS, et al. Mesenchymal transformation in epithelial ovarian tumor cells expressing epidermal growth factor receptor variant III. Mol Carcinog. 2006;45:851–860. doi: 10.1002/mc.20237. [DOI] [PubMed] [Google Scholar]
- 7.Wieduwilt MJ, Moasser MM. The epidermal growth factor receptor family: biology driving targeted therapeutics. Cell Mol Life Sci. 2008;65:1566–1584. doi: 10.1007/s00018-008-7440-8. [DOI] [PMC free article] [PubMed] [Google Scholar]
- 8.Normanno N, De Luca A, Bianco C, Strizzi L, Mancino M, Maiello MR, et al. Epidermal growth factor receptor (EGFR) signaling in cancer. Gene. 2006;366:2–16. doi: 10.1016/j.gene.2005.10.018. [DOI] [PubMed] [Google Scholar]
- 9.Ahmed N, Maines-Bandiera S, Quinn MA, Unger WG, Dedhar S, Auersperg N. Molecular pathways regulating EGF-induced epithelio-mesenchymal transition in human ovarian surface epithelium. Am J Physiol Cell Physiol. 2006;290:1532–1542. doi: 10.1152/ajpcell.00478.2005. [DOI] [PubMed] [Google Scholar]
- 10.Hudson LG, Zeineldin R, Stack MS. Phenotypic plasticity of neoplastic ovarian epithelium: unique cadherin profiles in tumor progression. Clin Exp Metastasis. 2008;25:643–655. doi: 10.1007/s10585-008-9171-5. [DOI] [PMC free article] [PubMed] [Google Scholar]
- 11.Polyak K, Weinberg RA. Transitions between epithelial and mesenchymal states: acquisition of malignant and stem cell traits. Nat Rev Cancer. 2009;9:265–273. doi: 10.1038/nrc2620. [DOI] [PubMed] [Google Scholar]
- 12.Zeisberg M, Neilson EG. Biomarkers for epithelial-mesenchymal transitions. J Clin Invest. 2009;119:1429–1437. doi: 10.1172/JCI36183. [DOI] [PMC free article] [PubMed] [Google Scholar]
- 13.Yilmaz M, Christofori G. EMT, the cytoskeleton and cancer cell invasion. Cancer Metastasis Rev. 2009;28:15–33. doi: 10.1007/s10555-008-9169-0. [DOI] [PubMed] [Google Scholar]
- 14.Dumont N, Wilson MB, Crawford YG, Reynolds PA, Sigaroudinia M, Tlsty TD. Sustained induction of epithelial to mesenchymal transition activates DNA methylation of genes silenced in basal-like breast cancers. Proc Natl Acad Sci USA. 2008;105:14867–14872. doi: 10.1073/pnas.0807146105. [DOI] [PMC free article] [PubMed] [Google Scholar]
- 15.Lombaerts M, van Wezel T, Philippo K, Dierssen JW, Zimmerman RM, Oosting J, et al. E-cadherin transcriptional downregulation by promoter methylation but not mutation is related to epithelial-to-mesenchymal transition in breast cancer cell lines. Br J Cancer. 2006;94:661–671. doi: 10.1038/sj.bjc.6602996. [DOI] [PMC free article] [PubMed] [Google Scholar]
- 16.Barton CA, Clark SJ, Hacker NF, O'Brien PM. Epigenetic markers of ovarian cancer. Adv Exp Med Biol. 2008;622:35–51. doi: 10.1007/978-0-387-68969-2_4. [DOI] [PubMed] [Google Scholar]
- 17.Esteller M. Epigenetics in cancer. N Engl J Med. 2008;358:1148–1159. doi: 10.1056/NEJMra072067. [DOI] [PubMed] [Google Scholar]
- 18.Jones PA, Baylin SB. The fundamental role of epigenetic events in cancer. Nat Rev Genet. 2002;3:415–428. doi: 10.1038/nrg816. [DOI] [PubMed] [Google Scholar]
- 19.Herman JG, Baylin SB. Gene silencing in cancer in association with promoter hypermethylation. N Engl J Med. 2003;349:2042–2054. doi: 10.1056/NEJMra023075. [DOI] [PubMed] [Google Scholar]
- 20.Makarla PB, Saboorian MH, Ashfaq R, Toyooka KO, Toyooka S, Minna JD, et al. Promoter hypermethylation profile of ovarian epithelial neoplasms. Clin Cancer Res. 2005;11:5365–5369. doi: 10.1158/1078-0432.CCR-04-2455. [DOI] [PubMed] [Google Scholar]
- 21.Teodoridis JM, Hall J, Marsh S, Kannall HD, Smyth C, Curto J, et al. CpG island methylation of DNA damage response genes in advanced ovarian cancer. Cancer Res. 2005;65:8961–8967. doi: 10.1158/0008-5472.CAN-05-1187. [DOI] [PubMed] [Google Scholar]
- 22.Balch C, Fang F, Matei DE, Huang TH, Nephew KP. Minireview: epigenetic changes in ovarian cancer. Endocrinology. 2009;150:4003–4011. doi: 10.1210/en.2009-0404. [DOI] [PMC free article] [PubMed] [Google Scholar]
- 23.Menendez L, Walker D, Matyunina LV, Dickerson EB, Bowen NJ, Polavarapu N, et al. Identification of candidate methylation-responsive genes in ovarian cancer. Mol Cancer. 2007;6:10. doi: 10.1186/1476-4598-6-10. [DOI] [PMC free article] [PubMed] [Google Scholar]
- 24.Kawakami M, Staub J, Cliby W, Hartmann L, Smith DI, Shridhar V. Involvement of H-cadherin (CDH13) on 16q in the region of frequent deletion in ovarian cancer. Int J Oncol. 1999;15:715–720. doi: 10.3892/ijo.15.4.715. [DOI] [PubMed] [Google Scholar]
- 25.Yuecheng Y, Hongmei L, Xiaoyan X. Clinical evaluation of E-cadherin expression and its regulation mechanism in epithelial ovarian cancer. Clin Exp Metastasis. 2006;23:65–74. doi: 10.1007/s10585-006-9020-3. [DOI] [PubMed] [Google Scholar]
- 26.Ahluwalia A, Hurteau JA, Bigsby RM, Nephew KP. DNA methylation in ovarian cancer. II. Expression of DNA methyltransferases in ovarian cancer cell lines and normal ovarian epithelial cells. Gynecol Oncol. 2001;82:299–304. doi: 10.1006/gyno.2001.6284. [DOI] [PubMed] [Google Scholar]
- 27.Patra SK. Ras regulation of DNA-methylation and cancer. Exp Cell Res. 2008;314:1193–1201. doi: 10.1016/j.yexcr.2008.01.012. [DOI] [PubMed] [Google Scholar]
- 28.Roll JD, Rivenbark AG, Jones WD, Coleman WB. DNMT3b overexpression contributes to a hypermethylator phenotype in human breast cancer cell lines. Mol Cancer. 2008;7:15. doi: 10.1186/1476-4598-7-15. [DOI] [PMC free article] [PubMed] [Google Scholar]
- 29.Lu R, Wang X, Chen ZF, Sun DF, Tian XQ, Fang JY. Inhibition of the extracellular signal-regulated kinase/mitogen-activated protein kinase pathway decreases DNA methylation in colon cancer cells. J Biol Chem. 2007;282:12249–12259. doi: 10.1074/jbc.M608525200. [DOI] [PubMed] [Google Scholar]
- 30.Chang HC, Cho CY, Hung WC. Silencing of the metastasis suppressor RECK by RAS oncogene is mediated by DNA methyltransferase 3b-induced promoter methylation. Cancer Res. 2006;66:8413–8420. doi: 10.1158/0008-5472.CAN-06-0685. [DOI] [PubMed] [Google Scholar]
- 31.MacLeod AR, Rouleau J, Szyf M. Regulation of DNA methylation by the Ras signaling pathway. J Biol Chem. 1995;270:11327–11337. doi: 10.1074/jbc.270.19.11327. [DOI] [PubMed] [Google Scholar]
- 32.Sharma S, Kelly TK, Jones PA. Epigenetics in cancer. Carcinogenesis. 2010;31:27–36. doi: 10.1093/carcin/bgp220. [DOI] [PMC free article] [PubMed] [Google Scholar]
- 33.Kuphal S, Martyn AC, Pedley J, Crowther LM, Bonazzi VF, Parsons PG, et al. H-cadherin expression reduces invasion of malignant melanoma. Pigment Cell Melanoma Res. 2009;22:296–306. doi: 10.1111/j.1755-148X.2009.00568.x. [DOI] [PubMed] [Google Scholar]
- 34.Graff JR, Herman JG, Myöhänen S, Baylin SB, Vertino PM. Mapping patterns of CpG island methylation in normal and neoplastic cells implicates both upstream and downstream regions in de novo methylation. J Biol Chem. 1997;272:22322–22329. doi: 10.1074/jbc.272.35.22322. [DOI] [PubMed] [Google Scholar]
- 35.Sugiyama Y, Hatano N, Sueyoshi N, Suetake I, Tajima S, Kinoshita E, et al. The DNA-binding activity of mouse DNA methyltransferase 1 is regulated by phosphorylation with casein kinase 1delta/epsilon. Biochem J. 2010;427:489–497. doi: 10.1042/BJ20091856. [DOI] [PubMed] [Google Scholar]
- 36.Kang ES, Park CW, Chung JH. Dnmt3b, de novo DNA methyltransferase, interacts with SUMO-1 and Ubc9 through its N-terminal region and is subject to modification by SUMO-1. Biochem Biophys Res Commun. 2001;289:862–868. doi: 10.1006/bbrc.2001.6057. [DOI] [PubMed] [Google Scholar]
- 37.Goyal R, Rathert P, Laser H, Gowher H, Jeltsch A. Phosphorylation of serine-515 activates the Mammalian maintenance methyltransferase Dnmt1. Epigenetics. 2007;2:155–160. doi: 10.4161/epi.2.3.4768. [DOI] [PubMed] [Google Scholar]
- 38.Chen ZX, Riggs AD. DNA methylation and demethylation in mammals. J Biol Chem. 2011;286:18347–18353. doi: 10.1074/jbc.R110.205286. [DOI] [PMC free article] [PubMed] [Google Scholar]
- 39.Caiafa P, Guastafierro T, Zampieri M. Epigenetics: poly(ADP-ribosyl)ation of PARP-1 regulates genomic methylation patterns. FASEB J. 2009;23:672–678. doi: 10.1096/fj.08-123265. [DOI] [PubMed] [Google Scholar]
- 40.Imura M, Yamashita S, Cai LY, Furuta J, Wakabayashi M, Yasugi T, et al. Methylation and expression analysis of 15 genes and three normally-methylated genes in 13 Ovarian cancer cell lines. Cancer Lett. 2006;241:213–220. doi: 10.1016/j.canlet.2005.10.010. [DOI] [PubMed] [Google Scholar]
- 41.Zhang Y, Chen FQ, Sun YH, Zhou SY, Li TY, Chen R. Effects of DNMT1 silencing on malignant phenotype and methylated gene expression in cervical cancer cells. J Exp Clin Cancer Res. 2011;30:98. doi: 10.1186/1756-9966-30-98. [DOI] [PMC free article] [PubMed] [Google Scholar]
- 42.Asadollahi R, Hyde CA, Zhong XY. Epigenetics of ovarian cancer: from the lab to the clinic. Gynecol Oncol. 2010;118:81–87. doi: 10.1016/j.ygyno.2010.03.015. [DOI] [PubMed] [Google Scholar]
- 43.Maradeo ME, Cairns P. Translational application of epigenetic alterations: ovarian cancer as a model. FEBS Lett. 2011;585:2112–2120. doi: 10.1016/j.febslet.2011.03.016. [DOI] [PMC free article] [PubMed] [Google Scholar]
- 44.Feng W, Marquez RT, Lu Z, Liu J, Lu KH, Issa JP, et al. Imprinted tumor suppressor genes ARHI and PEG3 are the most frequently downregulated in human ovarian cancers by loss of heterozygosity and promoter methylation. Cancer. 2008;112:1489–1502. doi: 10.1002/cncr.23323. [DOI] [PubMed] [Google Scholar]
- 45.Matei DE, Nephew KP. Epigenetic therapies for chemoresensitization of epithelial ovarian cancer. Gynecol Oncol. 2010;116:195–201. doi: 10.1016/j.ygyno.2009.09.043. [DOI] [PMC free article] [PubMed] [Google Scholar]
- 46.Sheng Q, Liu J. The therapeutic potential of targeting the EGFR family in epithelial ovarian cancer. Br J Cancer. 2011;104:1241–1245. doi: 10.1038/bjc.2011.62. [DOI] [PMC free article] [PubMed] [Google Scholar]
- 47.Fang F, Balch C, Schilder J, Breen T, Zhang S, Shen C, et al. A phase 1 and pharmacodynamic study of decitabine in combination with carboplatin in patients with recurrent, platinum-resistant, epithelial ovarian cancer. Cancer. 2010;116:4043–4053. doi: 10.1002/cncr.25204. [DOI] [PMC free article] [PubMed] [Google Scholar]
- 48.Shiraha H, Gupta K, Drabik K, Wells A. Aging fibroblasts present reduced epidermal growth factor (EGF) responsiveness due to preferential loss of EGF receptors. J Biol Chem. 2000;275:19343–19351. doi: 10.1074/jbc.M000008200. [DOI] [PubMed] [Google Scholar]