Abstract
Recent evidence suggests that DNA methylation changes may underlie numerous complex traits and diseases. The advent of commercial, array-based methods to interrogate DNA methylation has led to a profusion of epigenetic studies in the literature. Array-based methods, such as the popular Illumina GoldenGate and Infinium platforms, estimate the proportion of DNA methylated at single-base resolution for thousands of CpG sites across the genome. These arrays generate enormous amounts of data, but few software resources exist for efficient and flexible analysis of these data. We developed a software package called MethLAB (http://genetics.emory.edu/conneely/MethLAB) using R, an open source statistical language that can be edited to suit the needs of the user. MethLAB features a graphical user interface (GUI) with a menu-driven format designed to efficiently read in and manipulate array-based methylation data in a user-friendly manner. MethLAB tests for association between methylation and relevant phenotypes by fitting a separate linear model for each CpG site. These models can incorporate both continuous and categorical phenotypes and covariates, as well as fixed or random batch or chip effects. MethLAB accounts for multiple testing by controlling the false discovery rate (FDR) at a user-specified level. Standard output includes a spreadsheet-ready text file and an array of publication-quality figures. Considering the growing interest in and availability of DNA methylation data, there is a great need for user-friendly open source analytical tools. With MethLAB, we present a timely resource that will allow users with no programming experience to implement flexible and powerful analyses of DNA methylation data.
Key words: DNA methylation, software, genome-wide, microarrays, Infinium 450K array
DNA methylation is an important epigenetic modification that plays a crucial role in the development of higher organisms. Recent evidence has also linked methylation changes to numerous complex traits and diseases.1–4 Although a variety of methods are currently available to assay DNA methylation, array-based methods such as Illumina's GoldenGate and Infinium platforms have gained immense popularity among the scientific community. Despite the advent of methods based on next generation sequencing, it has been predicted that projects involving large numbers of samples will rely heavily on array-based methods for years to come.5 However, the lack of user-friendly tools to analyze the data generated by array-based methods is likely to impede advancement of the field, as arrays become increasingly dense and analyses increasingly complex. Here we present an easy to use graphical user interface (GUI) coupled with an efficient algorithm to perform powerful statistical analyses of array-based methylation data.
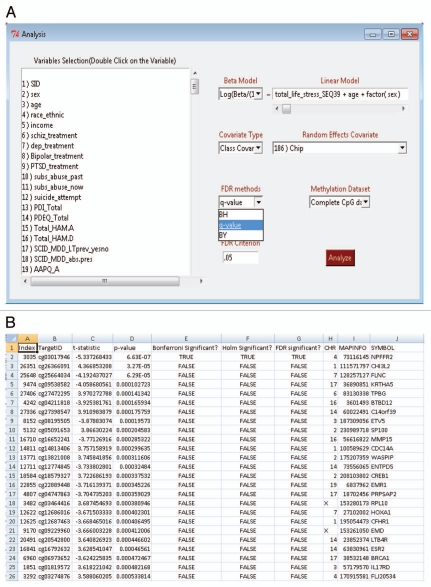
MethLAB has been developed using R, a powerful, open-source statistical language.6 It can be run on any machine capable of running R and, like other R packages, can be edited by the end user. MethLAB integrates the tcltk, widgetTools, nlme7 and qvalue8 packages, as well as native R functions into a GUI, similar in design to R Commander.9 The menu-driven format of MethLAB (Fig. 1A), along with its ease of use and automation of complex analyses, makes it highly accessible to those with no programming experience, in contrast to other open source packages such as Methylumi10 and ComBat.11 A detailed tutorial with sample data sets is also provided to aid new users.
Figure 1.
(A) A menu-driven Graphical User Interface (GUI) is used for loading methylation and phenotype files, selecting inclusion criteria and specifying the analytical model. (B) Analysis results are summarized in a spreadsheet-ready text file.
MethLAB reads in a user-supplied file of methylation β values (estimates of the proportion of DNA methylated), in which each row represents a CpG site and each column represents an individual sample, as well as a phenotype file, in which each row represents a phenotype or covariate and each column represents a sample. Users may restrict the analysis to a subset of CpG sites, which is useful for the testing of candidate genes or the exclusion of specific sites based on quality control parameters. Additionally, subsets of samples may be selected for analysis based on user-defined exclusion or inclusion criteria. For example, users may wish to exclude samples of low quality or to perform separate analyses by variables such as gender or tissue type.
For each CpG site, MethLAB models methylation as a function of a categorical or continuous phenotype and other covariates. MethLAB provides the user with options not available in other packages for analysis of methylation or expression data. Users may choose to model methylation via β values or logit-transformed β values (i.e., log(β/(1 − β)) or M-values); β values are easier to interpret biologically but M values may perform better in differential methylation analyses due to their stabilized variance.12 Methylation is modeled as a linear function of phenotype in a mixed model regression framework that allows users to adjust for any reasonable number of categorical and continuous covariates. To account for possible technical differences between samples, the user has the option to adjust for batch or chip effects through inclusion of either fixed or random effects. Fixed effects models run extremely fast in MethLAB due to our algorithm for partitioning large data sets. Random effects analyses are slower but may yield increased power to detect associations. MethLAB accounts for multiple testing by controlling the false discovery rate (FDR) at a user-specified level; users may select from the Benjamini-Hochberg,13 Benjamini-Yekutieli,14 and Storey8 methods to control the FDR.
To provide a case study exemplifying a typical MethLAB analysis, we re-analyzed data from a published study of DNA methylation in an urban cohort of African American adult subjects with a history of chronic stress.15 For 27,578 CpG sites from the Illumina HumanMethylation27 BeadChip, we tested for association between methylation and a continuous measure of total life stress (TLS) in 110 subjects. We modeled the logit-transformed β values (M values) as a linear function of TLS, adjusting for sex and age as covariates (Fig. 1A). We also included a chip-specific random effect term to account for potential differences between chips and selected to control the FDR at 0.05 via the Storey q value method8 (Fig. 1A). This random effects analysis took 12.5 min on a computer with 8 GB RAM and a quad core 2.93 Ghz processor; a similar fixed effects analysis took 4 sec on the same machine.
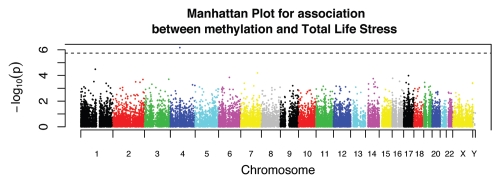
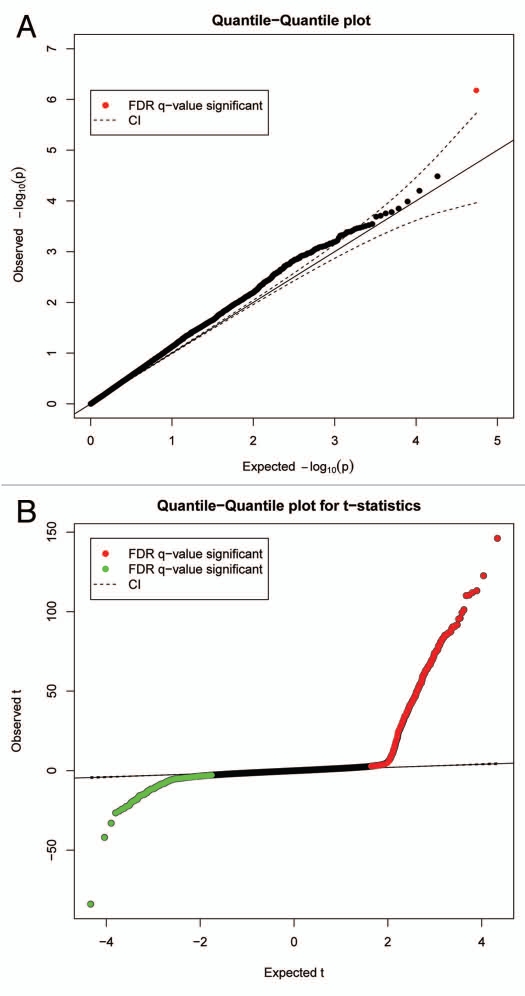
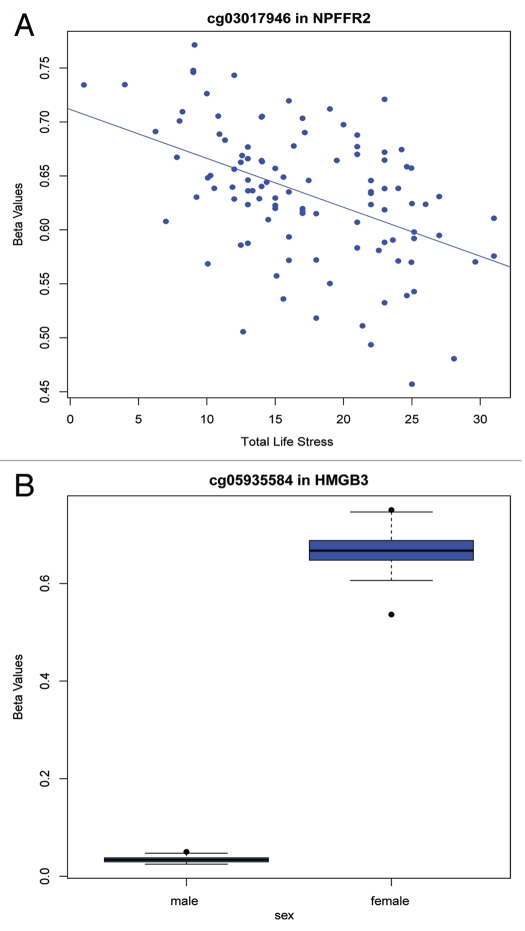
After completion of the specified analysis, MethLAB creates a folder containing output files in a user-specified location. These files include a log that stores the specified model and descriptive statistics, and a spreadsheet-ready text file (Fig. 1B) containing, for each CpG site, the t or F statistics, p values and indicators for FDR, Bonferroni and Holm (a step-down version of the Bonferroni approach that is less conservative16) significance. As demonstrated in Figure 1B, the MethLAB analysis is consistent with the published report, indicating that TLS associates with a single CpG site, cg03017946 in NPFFR2, after adjustment for multiple testing (t = −5.3; p = 6.6 × 10⁻⁷). If positional information for the CpG sites is provided, MethLAB automatically generates a Manhattan plot showing the genome-wide pattern of association between DNA methylation and the given phenotype; Figure 2 demonstrates that for the TLS analysis, a single CpG site on chromosome 4 achieves genome-wide Holm significance. Q-Q plots for the negative log p values (Fig. 3A) and ordered t statistics (Fig. 3B) are also created automatically for each analysis. Figure 3A plots the negative log p values observed in the TLS analysis against their expected quantiles under the null hypothesis, demonstrating a small amount of genomic inflation and the single genome-wide significant CpG site, cg03017946. For contrast, Figure 3B plots the t statistics obtained in an analysis of methylation differences by sex against their expected quantiles under the null hypothesis. As expected in an analysis that includes the X chromosome, thousands of CpG sites are significantly associated with sex (FDR < 0.05). The Q-Q plot of t-statistics allows visualization of the number of CpG sites demonstrating significant positive (red points) and negative (green points) correlation with a phenotype. In addition to the automated plots, a dialog box will offer users the option to create any number of CpG-specific plots, starting from the most significant site. For a continuous phenotype, the β values for a specific CpG site will be plotted against the phenotype; Figure 4A plots the β values of cg03017946 against TLS, demonstrating the inverse association between TLS and methylation of this CpG site. For categorical phenotypes boxplots are generated; Figure 4B displays methylation differences of an X chromosome CpG site by sex, demonstrating a pattern of hemi-methylation due to imprinting in females and no methylation in males. Finally, in addition to the single-CpG analyses described here, MethLAB can test for trends in global DNA methylation, measured as average methylation across all analyzed CpG sites. In the case study data set, global methylation was significantly greater for females than for males (t = 9.3, p = 2.6 × 10⁻¹⁵) but, consistent with the published report in reference 15, did not vary significantly with TLS (t = −0.29; p = 0.77).
Figure 2.
Manhattan plot of the negative log p values for each CpG site (vertical axis) by chromosome number and genomic position (horizontal axis). Dotted line indicates Holm significance.
Figure 3.
Automated quantile-quantile (Q-Q) plots based on (A) negative log p values from analysis of methylation and TLS and (B) ordered t statistics from analysis of sex-differential methylation.
Figure 4.
MethLAB automates (A) scatter or (B) box plots depicting methylation of specific CpG sites by continuous or categorical trait values. CpG probe and gene names are indicated in the plot titles.
MethLAB has been designed to optimize memory use during analyses. Upon recognizing that the memory requirements of an analysis exceed the available memory on a machine, it automatically partitions the analysis into smaller data sets to enable efficient processing. MethLAB then combines the partitioned analyses and outputs results for the complete data set. Thus, large data sets such as the HumanMethylation450 BeadChip can be accommodated even on machines with less-than-optimal configurations. Table 1 shows the comparative run times for fixed and random effects analyses in several common situations. Note that analysis time for fixed effects analyses depends on the number of CpG sites with missing data; this is because our algorithm makes efficient use of matrix multiplication to rapidly analyze CpG sites with no missing data, while for the other CpG sites the analysis must be performed site by site. On a computer having 4 GB RAM and operating with a dual core 1.33 Ghz processor, a fixed effects analysis with 27,578 CpG sites and 1,000 individuals takes <40 sec to complete whereas a random effects analysis takes ∼40 min. A fixed effects analysis of 450K CpG sites and 1,000 individuals can be performed on an 8 GB machine in <2 min for a fixed effects analysis with no missing data and <15 min if 6% of CpG sites have missing data.
Table 1.
Analysis times for fixed and random effects modeling
| No missing data, Seconds | 6% missing data, Seconds | Random effects analysis, Minutes | |
| 27k, n = 200 | 2.9 | 12.6 | 32.1 |
| 27k, n = 1,000 | 12.6 | 33.3 | 40.2 |
| 450k, n = 200 | 46.2 | 164.5 | 600.4 |
| 450k, n = 1,000* | 112.3 | 846.7 | 700.8 |
This analysis was conducted using an 8 GB machine because a 4 GB machine does not have sufficient memory to load a data set of this size. All other analyses were conducted on a 4 GB machine.
With continuing technological advances, data production is becoming less of an obstacle while analysis is becoming more arduous. The amount of genomic information available will only increase, as exemplified by the release of the HumanMethylation450 BeadChip. Development of computationally efficient and standardized methods to analyze the large data sets is vital for the continued growth of the field. With MethLAB, we present a user-friendly software tool to perform efficient and powerful analyses of array-based DNA methylation data. The MethLAB software, along with sample data sets and a detailed tutorial, is available at http://genetics.emory.edu/conneely/MethLAB.
Acknowledgments
The authors gratefully acknowledge Drs. Adriana Lori and Joseph Cubells for their feedback on early versions of the program. This work was supported, in part, by the National Institute of Mental Health (MH088609 and MH085806).
References
- 1.Fackler MJ, Umbricht CB, Williams D, Argani P, Cruz LA, Merino VF, et al. Genome-wide methylation analysis identifies genes specific to breast cancer hormone receptor status and risk of recurrence. Cancer Res. 2011;71:6195–6207. doi: 10.1158/0008-5472.CAN-11-1630. [DOI] [PMC free article] [PubMed] [Google Scholar]
- 2.Martino DJ, Tulic MK, Gordon L, Hodder M, Richman T, Metcalfe J, et al. Evidence for age-related and individual-specific changes in DNA methylation profile of mononuclear cells during early immune development in humans. Epigenetics. 2011;6 doi: 10.4161/epi.6.9.16401. [DOI] [PubMed] [Google Scholar]
- 3.Cotton AM, Lam L, Affleck JG, Wilson IM, Peñaherrera MS, McFadden DE, et al. Chromosome-wide DNA methylation analysis predicts human tissue-specific X inactivation. Hum Genet. 2011;130:187–201. doi: 10.1007/s00439-011-1007-8. [DOI] [PMC free article] [PubMed] [Google Scholar]
- 4.Bell CG, Teschendorff AE, Rakyan VK, Maxwell AP, Beck S, Savage DA. Genome-wide DNA methylation analysis for diabetic nephropathy in type 1 diabetes mellitus. BMC Med Genomics. 2010;3:33. doi: 10.1186/1755-8794-3-33. [DOI] [PMC free article] [PubMed] [Google Scholar]
- 5.Laird PW. Principles and challenges of genome-wide DNA methylation analysis. Nat Rev Genet. 2010;11:191–203. doi: 10.1038/nrg2732. [DOI] [PubMed] [Google Scholar]
- 6.Development Core Team, author. R: A language and environment for statistical computing. Vienna, Austria: R Foundation for Statistical Computing; 2005. ISBN 3-900051-07-0. [Google Scholar]
- 7.Pinheiro J, Bates D, Debroy S, Sarkar D The R Core Team, author. nlme: Linear and Nonlinear Mixed Effects Models. 2008 [Google Scholar]
- 8.Storey J. A direct approach to false discovery rates. J R Stat Soc. 2002;64:479–498. doi: 10.1111/1467-9868.00346. [DOI] [Google Scholar]
- 9.John F. The R Commander: A Basic-Statistics Graphical User Interface to R. J Stat Softw. 2005;14:1–42. [Google Scholar]
- 10.David S. Methylumi: Handle Illumina data. Bioconductor R. 2010 [Google Scholar]
- 11.Johnson WE, Li C, Rabinovic A. Adjusting batch effects in microarray expression data using empirical Bayes methods. Biostatistics. 2007;8:118–127. doi: 10.1093/biostatistics/kxj037. [DOI] [PubMed] [Google Scholar]
- 12.Du P, Zhang X, Huang CC, Jafari N, Kibbe WA, Hou L, et al. Comparison of Beta-value and M-value methods for quantifying methylation levels by microarray analysis. BMC Bioinformatics. 2010;11:587. doi: 10.1186/1471-2105-11-587. [DOI] [PMC free article] [PubMed] [Google Scholar]
- 13.Benjamini Y. Controlling the false discovery rate: a practical and powerful approach to multiple testing. J R Stat Soc. 1995;57:289–300. [Google Scholar]
- 14.Benjamini Y. The control of the false discovery rate in multiple testing under dependency. Ann Stat. 2001;29:1165–1188. [Google Scholar]
- 15.Smith AK, Conneely KN, Kilaru V, Mercer KB, Weiss TE, Bradley-Davino B, et al. Differential immune system DNA methylation and cytokine regulation in Posttraumatic Stress Disorder. Am J Med Genet B Neuropsychiatr Genet. 2011;156:700–708. doi: 10.1002/ajmg.b.31212. [DOI] [PMC free article] [PubMed] [Google Scholar]
- 16.Holm S. A simple sequentially rejective multiple test procedure. Scand J Stat. 1979;6:65–70. [Google Scholar]


