Abstract
A dynamic microdialysis sampling method with liquid chromatography-quadrupole time-of-flight mass spectrometry (Q-TOF-MS) was developed for rapid and sensitive analysis of the metabolite profile of Panax notoginseng extract (PNE) in rat bile. In vivo studies in male Sprague-Dawley rats were performed with microdialysis probes implanted into the bile duct before bile samples were collected from 0–12 h. Metabolites of PNE were identified using dynamic adjustment of the fragmentor voltage to produce structure-relevant fragment ions. The mass accuracy of precursor and fragment ions was typically within 5 ppm of the theoretical values. We identified 7 compounds: 4 parent compounds (notoginsenoside R1, ginsenosides Rg1, Rb1, and Rd) and 3 metabolites (ginsenosides Rg2, Rh2, and compound K). Data from this study suggest that this microdialysis technique could be used in notoginseng saponin metabolic animal studies.
Keywords: Microdialysis sampling, liquid chromatography-quadrupole time-of-flight mass spectrometry, Panax notoginseng, ginsenosides, bile, metabolites
1. Introduction
The dried root of Panax notoginseng (family Araliaceae) is a Chinese medicinal herb known as Sanqi. In traditional Chinese medicine, notoginseng is indicated for analgesia and hemostasis (Chinese Pharmacopoeia Commission, 2010). In China and other Asian countries, the herb has been widely utilized for the prevention and treatment of microcirculatory disturbances and other disorders [1,2]. Extensive phytochemical and pharmacological studies of P. notoginseng have isolated and characterized a total of 56 dammarane-type saponins [3,4], most of which have proven to be bioactive for the prevention and treatment of cardiovascular and cerebrovascular diseases [5,6], immunoregulation [7] and anti-carcinogenesis [8].
The liver plays a major role in drug metabolism and compounds and their metabolites are excreted into the bile duct. Hepatic disposition, biliary excretion and enterohepatic circulation may affect the pharmacokinetic profile of administered compounds. However, bile collection and compound isolation require painstaking efforts, which limit the ability to obtain a complete pharmacokinetic profile of a botanical such as notoginseng. Although most pharmacokinetic parameters of notoginseng have been investigated [9–13], there is no report of hepatobiliary excretion of active constituents and metabolites of Panax notoginseng extract (PNE). Whether the active components are eliminated through the bile to undergo extensive enterohepatic circulation or whether they are directly excreted into the urine or feces remains unknown.
Microdialysis sampling is an established method of diffusion-based collection that has gained wide acceptance for collection of solutes in vivo [14,15]. With microdialysis sampling, analytes can be collected from the sample medium in the recovery mode. Sampling can deliver substances with a molecular weight smaller than the membrane molecular weight cutoff to the fluid outside the probe [16]. Recently, microdialysis has been applied to studies of drug distribution and metabolism [17,18]. The in vivo microdialysis sampling method can substantially reduce the consumption of animals without withdrawal of biological fluids and involves minimal disturbance to physiological function [19].
Drug metabolism with microdialysis commonly requires an efficient and sensitive analytical method to measure the low concentration of analytes in the microdialysate [20]. The molecular specificity and ease of coupling liquid chromatography and mass spectrometry with high efficiency separation techniques is a powerful tool for the rapid and sensitive detection of compounds in complex mixtures [21]. In the present study, we developed a microdialysis technique coupled with sensitive liquid chromatography-quadrupole time-of-flight mass spectrometry (Q-TOF-MS) to investigate hepatobiliary excretion of PNE.
2. Experimental
2.1 Chemicals and reagents
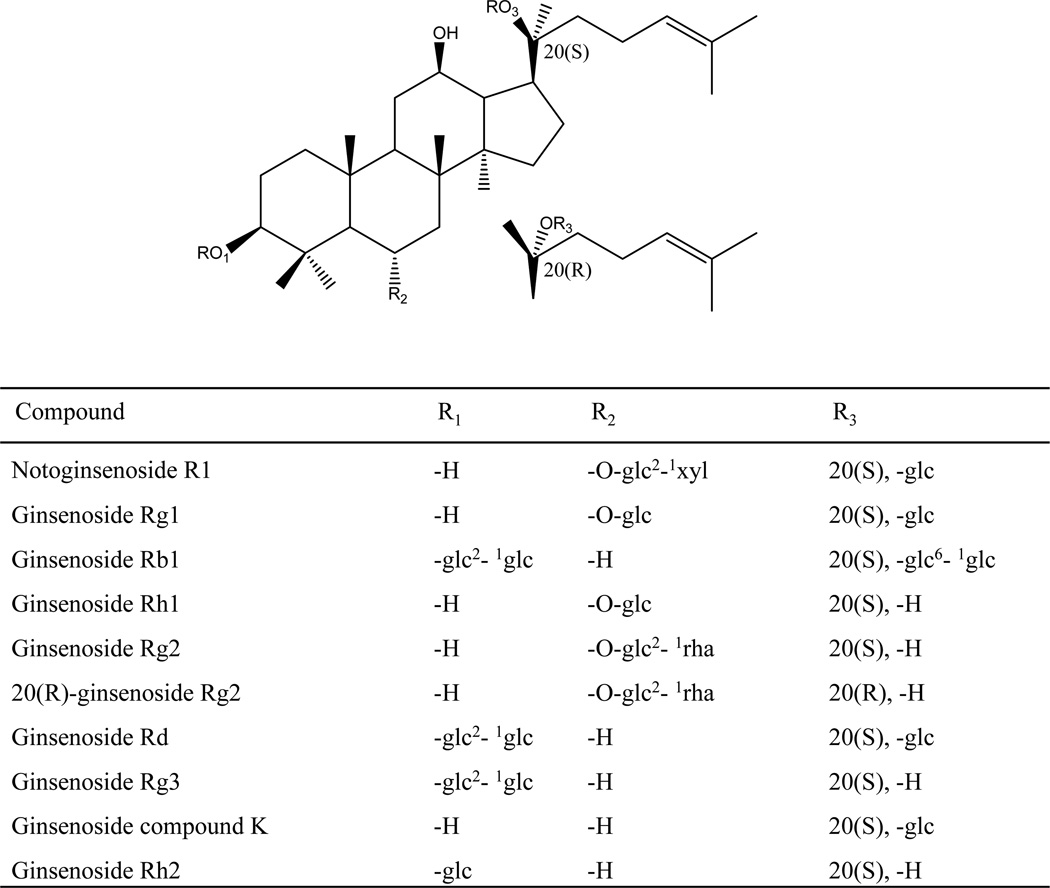
PNE (ginsenosides Rb1>20%, and Rg1>20%) was obtained from Kunming Pharmaceutical Co (Kunming, China). Authentic standards of ginsenosides Rb1, Rd, Rg1, Rg2(S), Rg2(R), Rg3, Rh1, Rh2, notoginsenoside R1, and ginsenoside compound K (Figure 1), were purchased from Shanghai Tauto Biotechnology Co., Ltd. The purities of the reference compounds were determined to be higher than 98% by high performance liquid chromatography-diode array detectors.
Figure 1.
Chemical structures of the mixed standards.
Acetonitrile was of HPLC grade from Merck (Darmstadt, Germany). Formic acid (FA) (purity: 96%) was purchased from Tedia (Fairfield, OH). Deionized water (18MΩ) was prepared by passing distilled water through a Milli-Q system (Millipore, Milford, MA). Other reagents and chemicals were of analytical grade.
2.2 Preparation of standard solutions
Standard stock solutions of 10 accurately weighed reference compounds were prepared in methanol. They contained 1 mg/mL of Rb1, Rd, Rg1, Rg2(S), Rg2(R), Rg3, Rh1, Rh2, notoginsenoside R1, and ginsenoside compound K and were prepared by dissolving approximately 10 mg (range 10–12 mg, weighed accurately) of each pure compound in 10 mL methanol.
2.3 Experimental animals
Male Sprague-Dawley rats (280 ± 20 g) were obtained from Slac Laboratory Animal Co. Ltd. (Shanghai, China) and housed with unlimited access to food and water except for a 12 h fasting period before the experiment. Rats were acclimated to the facilities and environment for 7 days before the experiments. The animals were maintained on a 12 h light/12 h dark cycle (light on at 8:00) at ambient temperature (22–25°C) and 60% relative humidity. Rats were randomly assigned to control group (n = 3) and treatment group (n = 3). The protocol was approved by the Animal Ethics Committee. PNE was dissolved in water to obtain a PNE oral solution with a concentration of 100 mg/mL. Before drug administration, the experimental animals were deprived of food for 12 h and then given PNE orally at a dose of 500 mg/kg (i.e., 0.5 mL per 100 g body weight).
2.4 Microdialysis sampling
The microdialysis system consisted of a 3-syringe bracket pump with a Bee Syringe Pump Controller (Bioanalytical System Inc., West Lafayette, IN). For bile sampling, a probe (MD-2100, 2.5 mm membrane, Bioanalytical system, Inc.) was lowered into the bile of an anesthetized rat. Perfusion of the probe with filtered Ringer’s solution (147 mM NaCl, 2.4 mM CaCl2, and 4.0 mM KCl with a pH of 7.3) was begun shortly before probe insertion and continued for the duration of the experiment, delivered by a microinjection pump at a constant flow-rate of 2 µL/min. The rats were anesthetized with urethane 1 g/kg (i.p.) before probe implantation surgery, and they remained anesthetized throughout the experimental period. Implantation of the shunt microdialysis probe was accomplished through a midline incision in the abdominal wall [22]. Bile samples were drawn every 2 h after administration of notoginseng extract until 12 h. The rat’s body temperature was maintained at 37°C during the experimental procedure.
2.5 Bile sample preparation
To avoid ion suppression, all bile samples were pretreated by solid phase extraction (SPE) before LC/Q-TOF-MS analysis. Waters Oasis HLB columns (1 cc, 30 mg, 30 µm, Waters) were first preconditioned with 2 mL of methanol and then equilibrated with 2 mL of deionized water. The bile samples (0.2mL) were loaded onto the preconditioned SPE columns directly. After being washed off with 2 mL of deionized water, the SPE columns were eluted using 1 mL of methanol solution. The supernatants were evaporated to dryness under a stream of nitrogen at 25°C, and the residue was reconstituted in 100 µL methanol and centrifuged at 14000 g at 4°C for 10 min before 0.5 µL aliquots of the supernatants were injected into the LC/Q-TOFMS system for analysis.
2.6 HPLC system
Chromatographic analysis was performed on an Agilent 1100 Series LC system (Agilent Technologies, Santa Clara, CA) equipped with a binary pump, online degasser, autoplate-sampler, and thermostatically controlled column compartment. Chromatographic separations were achieved on a Gemini C18 column of 250 mm × 4.6 mm, 5 µm particle size (Phenomenex, Inc, Torrance, CA). The chromatographic conditions were as follows: flow rate of 1 mL/min; sample injection volume, 0.5 µL; column temperature, 25°C; mobile phase A, 0.1% formic acid; and mobile phase B, 100% acetonitrile. The gradient profile was optimized as the following: 0–7 min, 25–30% B; 7–15 min, 30–35% B; 15–20 min, 35–50% B; 20–25 min, 50–60% B; 20–35 min, 60–80% B; and 35–40 min, 80–100% B. The QC sample (mixed standards) was used to optimize the condition of LC/Q-TOF-MS because it contained the most information on whole bile samples. Every day after the instrument was calibrated, the QC sample was analyzed first to test the stability of the instrument and to make sure the instrument was in the same condition throughout the entire analytical procedure.
2.7 Mass spectrometry
Detections were performed using a 6520 quadrupole time-of-flight (Q-TOF) mass spectrometer (Agilent Technologies, Santa Clara, CA) equipped with an electrospray ionization (ESI) interface. The electrospray source of the mass spectrometer was operated in both positive and negative modes, and the operating parameters were as follows: drying gas (N2) flow rate, 9.0 L/min; drying gas temperature, 320°C; nebulizer, 35 psig; capillary, 3000 V; Oct RFV, 750 V; and fragmentor voltage, 120 V. The operations, acquisition, and analysis of data were monitored by Agilent LC/Q-TOF-MS MassHunter Acquisition Software Version A.01.00 (Agilent Technologies) and operated under MassHunter Acquisition Software Version B.02.00 (Agilent Technologies). Mass spectra were recorded across the range m/z 100–2000 with accurate mass measurement of all mass peaks. To optimize signals and obtain maximal structural information, the collision energy was adjusted from 5 V to 60 V for MS/MS experiments.
3. Results and discussion
3.1 Microdialysis sampling and LC/Q-TOF-MS identification of the dammarane saponins in rat bile
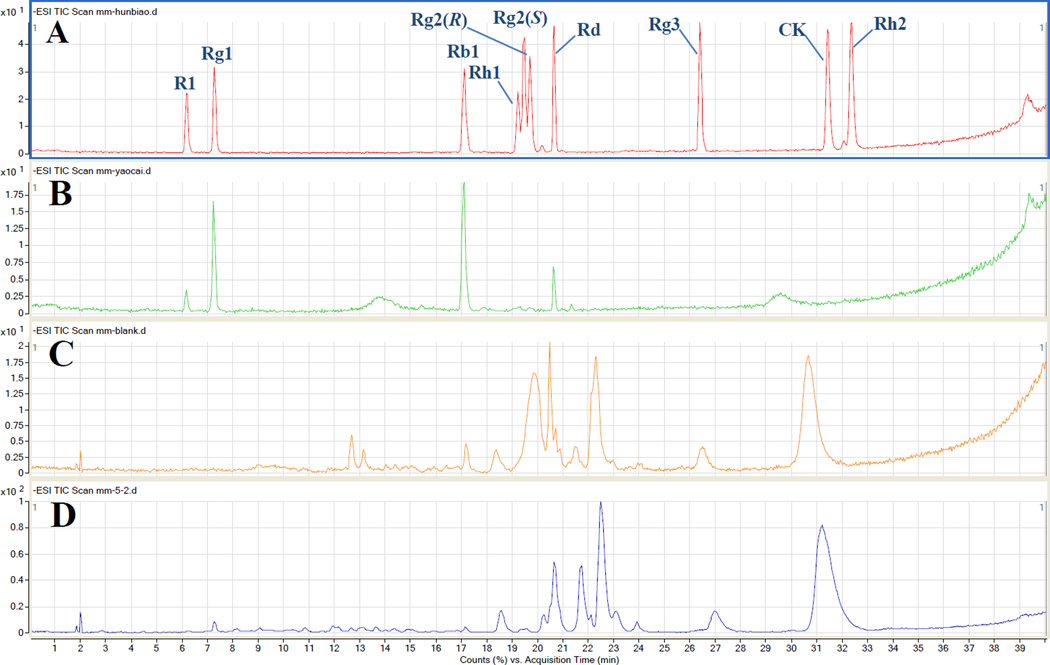
Dammarane saponins and their metabolites are active compounds in PNE [2]. In designing the experiment, we expected that in addition to the major ginsenosides in notoginseng extract, several metabolites would be detected in rat bile. We selected 10 ginsenoside/metabolite standards (Figure 2A). In the present study, we identified the main constituents in total saponins and analyzed the metabolite profile in rat bile. We identified 4 compounds in the notoginseng extract including notoginsenoside R1 and ginsenosides Rg1, Rb1, and Rd by comparing their retention times and MS data with authentic standards. The ion chromatogram of total saponins is presented in Figure 2B, and the monitored ions of each compound are listed in Table 1.
Figure 2.
Total ion chromatograms of rat bile samples in negative ion mode at 120V fragmentor voltage: (A) mixed standards; (B) Panax notoginseng extract; (C) blank bile; and (D) bile dialysate collected at 12 h after administration.
Table 1.
MS/MS data from microdialysis sampling for identified compounds from metabolites of Panax notoginseng extract in rat bile.
| Identification | Rt (min) |
Molecular formula |
Theoretical accurate mass |
Q-Tof-MS (ESI−) |
Mass accuracy (ppm) |
MS/MS fragment ion (m/z) |
|---|---|---|---|---|---|---|
| Notoginsenoside R1* | 6.149 | C47H80O18 | 977.5327 [M+COOH]− |
977.5348 [M+COOH]− |
2.22 | [M+COOH]−977.5348, [M-H]− 931.5296, [M-H-Glc-Xyl]− 637.4348 |
| Ginsenoside Rg1* | 7.215 | C42H72O14 | 845.4904 [M+COOH]− |
845.4906 [M+COOH]− |
0.45 | [M+COOH]−845.4906, [M-H- Glc]−637.4297, [M-H-2Glc]− 475.3788 |
| Ginsenoside Rb1* | 16.971 | C54H92O23 | 1107.6015 [M-H]− |
1107.5935 [M-H]− |
1.62 | [M-H]−1107.5935,[M-Glc-H]− 945.5397, [M-2Glc-H]−783.4878 |
| Ginsenoside Rg2 or 20(R)- Ginsenoside Rg2 |
19.084 19.342 |
C42H72O13 | 783.4877 [M-H]− |
783.4884 [M-H]− |
2.55 | [M+COOH]−829.4983, [M-H]− 783.4884, [M-H-Rha]−637.4304, [M-H-Rha-Glc]−475.3789 |
| Ginsenoside Rd* | 20.573 | C48H82O18 | 991.5483 [M+COOH]− |
991.5502 [M+COOH]− |
1.99 | [M+COOH]−991.5502, [M-H]− 945.5445, [M-H-Glc]−783.4895, [M-H-2Glc]−621.4366 |
| Ginsenoside compound K | 31.360 | C37H63O10 | 667.4400 [M+COOH]− |
667.4427 [M+COOH]− |
0.13 | [M+COOH]−667.4427, [M-H]− 621.4363, [M-H-Glc]−459.3842 |
| Ginsenoside Rh2 | 32.197 | C36H62O8 |
667.4427 [M+COOH]− |
667.4280 [M+COOH]− |
3.07 |
[M+COOH]−667.4280, [M-H]− 621.4379, [M-H-Glc]−459.3793 |
The parent constituents in Panax notoginseng extract
After the total saponins were administered, we identified 7 compounds including notoginsenoside R1, and ginsenosides Rg1, Rb1 Rg2 or 20(R)- Rg2, Rh2, Rd and compound K in rat bile by comparison of their retention times and MS data with authentic standards. The total ion chromatogram of the blank bile sample and drug-containing bile sample is presented in Figure 2C, D and the particular monitored ions of each compound are listed in Table 1. The identification of each compound is outlined below.
3.2 Identification of parent compounds
Compound 1 (notoginsenoside R1) (Figure 3A)
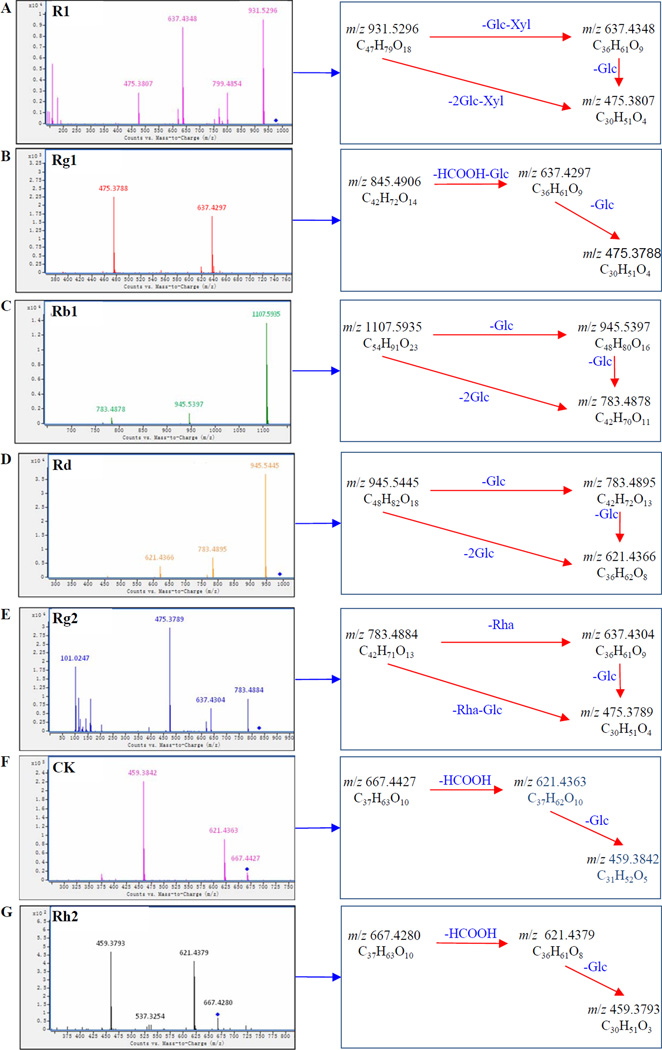
Figure 3.
Proposed fragmentation pathways of metabolites from analysis of the rat bile sample: (A) notoginsenoside R1; (B) ginsenoside Rg1; (C) ginsenoside Rb1; (D) ginsenoside Rd; (E) ginsenoside Rg2; (F) ginsenoside compound K; (G) ginsenoside Rh2
In negative ion mode, compound 1 exhibited a high-intensity [M+COOH]− ion at m/z 977.5348 and a [M–H]− ion at m/z 931.5296 with a fragmentor voltage of 45 V. It also displayed the product ion at m/z 637.4348, corresponding to the loss of a glucose and a xylose residue. The product ion at m/z 475.3870 originated from the simultaneous or successive loss of another glucose residue. By comparison of its retention time and MS data with an authentic standard, compound 1 was then unequivocally identified as notoginsenoside R1.
Compound 2 (ginsenoside Rg1) (Figure 3B)
Compound 2 showed an [M+COOH]− ion at m/z 845.4906 at 45 V. The fragment ion at m/z 637.4297 may be formed by the loss of a glucose residue and one COO molecule. The product ion at m/z 475.3788 corresponded to simultaneous or successive loss of another glucose residue. Compound 2 was unequivocally identified as ginsenoside Rg1 by comparison with an authentic standard.
Compound 3 (ginsenoside Rb1) (Figure 3C)
Compound 3 presented an [M+COOH]− ion at m/z 1107.5935 at 45 V. The succesive loss of glucose led to the product ions at m/z 945.5397 and 783.4878. Compound 3 was unequivocally identified as ginsenoside Rb1 by comparison with an authentic standard.
Compound 5 (ginsenoside Rd) (Figure 3D)
Compound 5 exhibited an [M+COOH]− ion at m/z 991.5502 and an [M-H]− ion at m/z 945.5445 at 45 V. A product ion at m/z 783.4895 originated from the loss of a glucose. Compound 6 was unequivocally identified as ginsenoside Rd by comparison with an authentic standard.
3.3 Identification of metabolites
Compound 4 (ginsenoside Rg2) (Figure 3E)
Compound 4 exhibited an [M+COOH]− ion at m/z 829.4983 and an [M-H]− ion at m/z 783.4884 with a fragmentor voltage of 45 V. An [M–H-Rha]− ion at m/z 637.4304 resulted from the loss of rhamnose. The product ion at m/z 475.3789 was generated by the simultaneous or successive loss of another glucose residue. Compound 4 was unequivocally identified as ginsenoside Rg2 by comparison with an authentic standard.
Compound 6 (ginsenoside compound K) (Figure 3F)
Compound 6 showed an [M+COOH]− ion at m/z 667.4427 and an [M-H]− ion at m/z 621.4363 at 30 V. It also yielded a product ion at m/z 459.3842 by the loss of a glucose. Compound 6 was unequivocally identified as ginsenoside compound K by comparison with an authentic standard.
Compound 7 (ginsenoside Rh2) (Figure 3G)
Compound 7 gave an [M+COOH]− ion at m/z 667.4280 and an [M-H]− ion at m/z 621.4379 with a fragmentor voltage of 30 V. It also yielded a product ion at m/z 459.3793 by the loss of a glucose. Compound 7 was unequivocally identified as ginsenoside Rh2 by comparison with an authentic standard.
3.4 Metabolites and metabolic profiles of PNE in rat bile
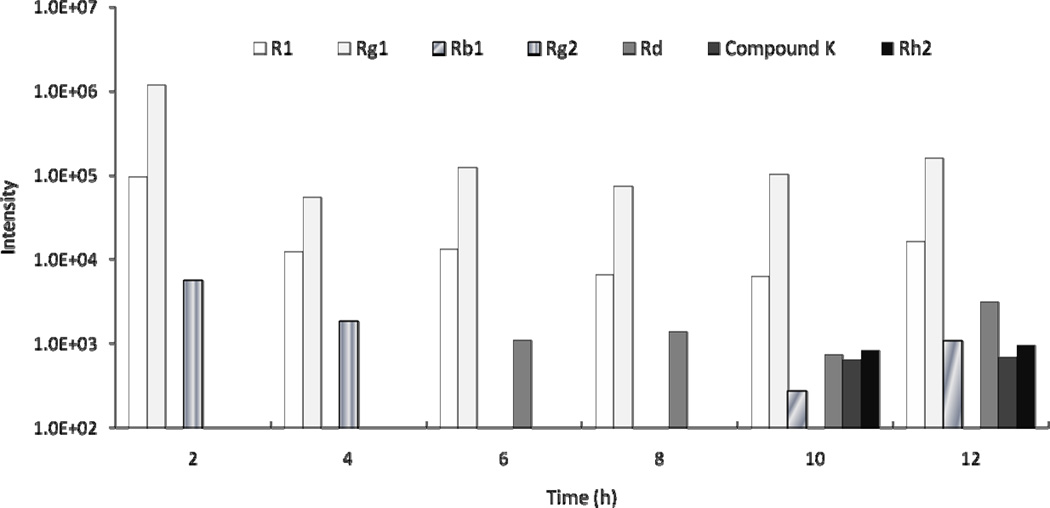
The biliary excretion of notoginsenoside R1 and ginsenosides Rg1 and Rg2 was detected within 4 h of administration. After 4 h, ginsenoside Rd was detected and Rg2 was eliminated; other metabolites could not be detected until 10 h. After 11 h, notoginsenoside R1 and ginsenosides Rg1, Rb1, Rd, compound K, and Rh2 were detected (Figure 4).
Figure 4.
Notoginseng saponins and metabolites detected in rat bile after oral administration of 500 mg/kg of PNE. “Intensity” refers to the response value of the mass spectrum of various compound.
Notoginsenoside R1 was excreted into bile within 2 h and detected after 12 h, suggesting its metabolism in rats is long. Ginsenoside Rg2 was excreted rapidly into the bile after administration but was not detected in the bile after 4 h. Since it can hydrolize into 20(S)-protopanaxtriol and 25-protopanaxtriol in gastric and intestinal fluid [23], it may have been transformed into its metabolites within 4 h. Ginsenoside Rb1 was detected in rat bile 11 h after administration, indicating a slow biliary excretion. Our results are consistent with those of another report of slow biliary excretion of Rb1, and renal excretion greatly contributed to its elimination [24].
Ginsenosides compound K and Rd were found in rat bile at 11 h. We speculated that they might have been transformed from ginsenoside Rb1. Ginsenoside Rb1 can be converted into Rd and then into compound K via ginsenoside F2 [23, 25]. In our study, Rd was detected after 4 h in rat bile and compound K was not found until 11 h, supporting the transformation pathway of ginsenoside Rb1.
Experimental results indicate that microdialysis sampling with Q-TOF-MS detection is a promising method for tissue targeted exogenous metabolic studies. The sampling and analysis method can provide minimally invasive, tissue-specific, metabolic information not available using current methodologies. Microdialysis sampling of tissues coupled with analysis using Q-TOF-MS is a means to continuously monitor multiple exogenous metabolites at specific tissue sites in an experimental animal.
4. Conclusion
In this study, a microdialysis technique and LC/Q-TOF-MS was used to investigate the excretion of extracts of PNE in the bile dialysate of rats. Four parent compounds and 3 metabolites were identified, demonstrating the analytical potential of this method for metabolism studies. Compared with conventional biological sampling techniques, our method offers continuous real-time monitoring, low invasiveness, and simple sample preparation. It can therefore be used for studies of pharmacokinetic and in vivo distribution and localization of ginsenosides.
Highlights.
Analysis of hepatic bile excretion is important to understanding drug metabolism
Technical difficulties limited notoginseng compound analysis in rat bile
A bile duct microdialysis with Q-TOF-MS was developed to obtain its metabolic profile
Four parent compounds and 3 metabolites were identified via real-time monitoring
One identified active metabolite, Compound K, has significant biological activity
Acknowledgements
This work was supported in part by grants from the NIH/NCCAM P01 AT004418 and K01 AT005362, from the research project (No.30973884) of the National Science Foundation of China, and from the program for Changjiang Scholars and Innovative Research Team in University (No. IRT0868).
Footnotes
Publisher's Disclaimer: This is a PDF file of an unedited manuscript that has been accepted for publication. As a service to our customers we are providing this early version of the manuscript. The manuscript will undergo copyediting, typesetting, and review of the resulting proof before it is published in its final citable form. Please note that during the production process errors may be discovered which could affect the content, and all legal disclaimers that apply to the journal pertain.
References
- 1.Wang CZ, Yuan CS. Am. J. Chin. Med. 2008;36:1019. doi: 10.1142/S0192415X08006545. [DOI] [PMC free article] [PubMed] [Google Scholar]
- 2.Wang CZ, Ni M, Sun S, Li XL, He H, Mehendale SR, Yuan CS. J. Agric. Food. Chem. 2009;25:2363. doi: 10.1021/jf803320d. [DOI] [PMC free article] [PubMed] [Google Scholar]
- 3.Wang CZ, McEntee E, Wicks S, Wu JA, Yuan CS. J. Nat. Med. 2006;60:97. [Google Scholar]
- 4.Wang S, Ye S, Cheng Y. J.Chromatogr. A. 2006;1109:279. doi: 10.1016/j.chroma.2006.01.023. [DOI] [PubMed] [Google Scholar]
- 5.Chen S, Liu J, Liu X, Fu Y, Zhang M, Lin Q, Zhu J, Mai L, Shan Z, Yu X, Yang M, Lin S. J. Ethnopharmacol. 2011;137:263. doi: 10.1016/j.jep.2011.05.011. [DOI] [PubMed] [Google Scholar]
- 6.Cai BX, Li XY, Chen JH, Tang YB, Wang GL, Zhou JG, Qui QY, Guan YY. Eur. J. Pharmacol. 2009;606:142. doi: 10.1016/j.ejphar.2009.01.033. [DOI] [PubMed] [Google Scholar]
- 7.Sun H, Yang Z, Ye Y. Int. Immunopharmacol. 2006;6:14. doi: 10.1016/j.intimp.2005.07.003. [DOI] [PubMed] [Google Scholar]
- 8.Bi X, Zhao Y, Fang W, Yang W. Clin.Exp. Pharmacol. Physiol. 2009;36:1074. doi: 10.1111/j.1440-1681.2009.05203.x. [DOI] [PubMed] [Google Scholar]
- 9.Xu QF, Fang XL, Chen DF. J. Ethnopharmacol. 2003;84:187. doi: 10.1016/s0378-8741(02)00317-3. [DOI] [PubMed] [Google Scholar]
- 10.Li L, Sheng YX, Zhang JL, Wang CS, Guo DA. Biomed. Chromatogr. 2004;18:849. doi: 10.1002/bmc.400. [DOI] [PubMed] [Google Scholar]
- 11.Li L, Sheng YX, Zhang JL, Wang SS, Guo DA. Biomed. Chromatogr. 2006;20:327. doi: 10.1002/bmc.567. [DOI] [PubMed] [Google Scholar]
- 12.Li XY, Sun JG, Wang GJ, Hao HP, Liang Y, Zheng YT, Yan B, Sheng LS. Biomed. Chromatogr. 2007;21:735. doi: 10.1002/bmc.813. [DOI] [PubMed] [Google Scholar]
- 13.Li XY, Wang GJ, Sun JG, Hao HP, Xiong YQ, Yan B, Zheng YT, Sheng LS. Biol. Pharm. Bull. 2007;30:847. doi: 10.1248/bpb.30.847. [DOI] [PubMed] [Google Scholar]
- 14.Stenken JA. Microdialysis Sampling. In: Webster JG, editor. Encyclopedia of Medical Devices and Instrumentation. 2nd ed. Vol. 4. Hoboken, NJ: John Wiley & Sons, Inc.; 2006. p. 400. [Google Scholar]
- 15.Bourne JA. Clin. Exp. Pharmacol. Physiol. 2003;30:16. [Google Scholar]
- 16.Wang Y, Zagorevski DV, Lennartz MR, Loegering DJ, Stenken JA. Anal. Chem. 2009;81:9961. doi: 10.1021/ac901703g. [DOI] [PMC free article] [PubMed] [Google Scholar]
- 17.Wang XD, Stenken JA. Anal. Chem. 2006;78:6026. doi: 10.1021/ac0602930. [DOI] [PubMed] [Google Scholar]
- 18.Wen XD, Qi LW, Li B, Li P, Yi L, Wang YQ, Liu EH, Yang XL. J. Pharm. Biomed. Anal. 2009;50:100. doi: 10.1016/j.jpba.2009.03.038. [DOI] [PubMed] [Google Scholar]
- 19.Behrens HL, Chen RB, Li LJ. Anal. Chem. 2008;80:6949. doi: 10.1021/ac800798h. [DOI] [PMC free article] [PubMed] [Google Scholar]
- 20.Vieira MLT, Singh RP, Derendorf H. J. Chromatogr. B. 2010;878:2967. doi: 10.1016/j.jchromb.2010.08.048. [DOI] [PubMed] [Google Scholar]
- 21.Westerink BHC, Cremers TIFH. handbook of microdialysis-methods, applications and perspectives. Amsterdam: Elsevier; 2007. p. 251. [Google Scholar]
- 22.Heppert KE, Davies MI. Anal. Chim. Acta. 1999;379:359. [Google Scholar]
- 23.Wang HY, Qi LW, Wang CZ, Li P. Am. J. Chin. Med. 2011;39:1103. doi: 10.1142/S0192415X11009433. [DOI] [PMC free article] [PubMed] [Google Scholar]
- 24.Chen W, Zhu CY. Central South Pharmacy. 2005;3:32. [Google Scholar]
- 25.Wang CZ, Kim KE, Du GJ, Qi LW, Wen XD, Li P, Bauer BA, Bissonnette MB, Musch MW, Chang EB, Yuan CS. Am. J. Chin. Med. 2011;39:1161. doi: 10.1142/S0192415X11009470. [DOI] [PMC free article] [PubMed] [Google Scholar]


