

Abstract
Background
Liver is the primary site of alcohol metabolism and is highly vulnerable to injuries due to chronic alcohol abuse. Several molecular mechanisms, including oxidative stress and altered cellular metabolism, have been implicated in the development and progression of alcoholic liver disease. We sought to gain further insight into the molecular pathogenesis by studying the effects of ethanol exposure on global gene expression in HepG2 cells.
Methods
HepG2 cells were cultured in the presence or absence of 75 mM ethanol for nine days, with fresh media daily. Global gene expression changes were studied using Affymetrix GeneChip® Human Exon 1.0 ST Arrays. Gene expression differences were validated for thirteen genes by quantitative real-time RT-PCR. To identify biological pathways affected by ethanol treatment, differentially expressed genes were analyzed by Ingenuity Pathway Analysis software.
Results
Long term ethanol exposure altered the expression of 1093 genes (FDR ≤ 3%); many of these changes were modest. Long term ethanol exposure affected several pathways, including acute phase response, amino acid metabolism, carbohydrate metabolism and lipid metabolism.
Conclusions
Global measurements of gene expression show that a large number of genes are affected by chronic ethanol, although most show modest effect. These data provide insight into the molecular pathology resulting from extended alcohol exposure.
Keywords: ethanol, liver cells, alcoholism, global gene expression, pathways
Introduction
Alcoholism is a complex disease affecting millions in the world and is associated with numerous health risks. Alcohol is chiefly metabolized in hepatocytes, parenchymal cells which form 85% of the total volume of a healthy liver; thus, liver is the most susceptible organ for alcohol induced injuries including alcoholic steatosis, alcoholic hepatitis and alcoholic cirrhosis (Mann et al., 2003).
Several molecular mechanisms have been implicated in the development and progression of alcoholic liver disease, including direct effects of ethanol on liver and effects on other tissues that can indirectly affect liver function. Ethanol metabolism in hepatocytes produces acetaldehyde, which forms adducts with proteins and disrupts their functions (Niemela et al., 1998). Ethanol metabolism alters the energy state of the cell: in reactions catalyzed by both alcohol dehydrogenases (ADH) and aldehyde dehydrogenases (ALDH), NAD+ is reduced to NADH, increasing the NADH/NAD+ ratio in cells. This change in the redox state leads to inhibition of activity of many enzymes that are involved in metabolic pathways, including carbohydrate and fatty acid metabolism (Badawy, 1977). NADH enters the electron transport chain and leads to the generation of reactive oxygen species (ROS) (Bailey et al., 1999), which can damage mitochondrial membranes and induce oxidative stress within the cell. Chronic alcohol abuse also damages the lining of the intestine, exposing the liver to gut-derived bacterial endotoxins (Keshavarzian et al., 1999) that activate the liver macrophages (Kupffer cells) which release ROS and cause further damage to hepatocytes (Thurman, 1998). Kupffer cells also produce inflammatory cytokines including TNF-α that contribute to liver damage. ROS and cytokines activate hepatic stellate cells to proliferate and increase the synthesis and secretion of extracellular matrix proteins, particularly collagen (Siegmund and Brenner, 2005). Accumulation of these matrix proteins alters the morphology of the liver, leading to the development of fibrotic liver.
A number of studies have explored the effects of alcohol on global gene expression in liver (Deaciuc et al., 2004a; Deaciuc et al., 2004B; Deaciuc et al., 2004C; Park et al., 2008; Seth et al., 2003; Tadic et al., 2002; Yin et al., 2007). They differ in the animal species, the means of alcohol feeding and the length of exposure, and the power to detect changes. To focus on effects of long-term ethanol exposure on one liver cell type in the absence of signaling from other tissues, we studied a simple model system, HepG2 human hepatocellular carcinoma cells cultured in ethanol for 9 days.
Materials and Methods
Long-term treatment of HepG2 cells with ethanol
Two million HepG2 cells (HB-8065; ATCC, Manassas, VA) were seeded per 75 cm2 flask (catalog 430725, Corning Inc., Corning, NY). Six hours after seeding, ethanol was added to a final concentration of 75 mM (0.34%) to one set of flasks. Every 24 h, media were replaced in both control and ethanol treatment flasks with fresh media, without or with ethanol, respectively. Four days after seeding, cells were trypsinized and seeded into new flasks at two million viable cells per flask, with media changes continuing daily as before. Five days after the split (a total of 9 days without or with ethanol), cells were collected by trypsinization. Four independent experiments were carried out.
The numbers of viable cells in the control and ethanol treatment flasks were measured by trypan blue exclusion. Briefly, 0.1 ml of 0.4% Trypan blue stain (Sigma T8154) was added to 0.5 ml of trypsinized cells, and allowed to stand at room temperature for 5 min. Cells that were not stained by the dye were counted as viable.
RNA extraction, labeling and hybridization
Trypsinized cells were pelleted by centrifugation at 2500 rpm for 3 min. The cell pellet was suspended in 5 ml of Trizol (Invitrogen, Carlsbad, CA) and total RNA was extracted following the manufacturer’s protocol. RNA was further purified on RNeasy Mini kit columns (Qiagen, Valencia, CA). The quality of the RNA was tested on a Bioanalyzer (Agilent Technologies, Palo Alto, CA); RNA integration numbers (RIN) ranged from 9.6 to 10. Starting with 1 μg of total RNA, ribosomal RNA (rRNA) was reduced from the total RNA using RiboMinus Human/Mouse Transcriptome Isolation Kit (Invitrogen, Carlsbad, CA). cDNA was synthesized with random primers tagged with the T7 promoter. This cDNA was used as template for cRNA synthesis by T7 RNA polymerase, using the GeneChip Whole Transcript Sense target labeling assay kit (Affymetrix, Santa Clara, CA). The sense strand of cDNA was then synthesized from cRNA, fragmented, terminally labeled with biotin, and hybridized to GeneChip® Human Exon 1.0 ST Arrays (Affymetrix). Chips were stained, washed and scanned following the standard Affymetrix protocols. Two technical replicates (processed in separate batches) of each of the 8 independent samples (4 control, 4 ethanol treated) were carried out.
Exon array data analysis
Affymetrix CEL files were imported into Expression console software (Affymetrix) and analyzed at the core exon level (HuEx-1_0-st-v2.na28.hg18 annotation) using the PLIER algorithm. For further steps, control probe sets (e.g. those targeted to introns) were excluded. Because cross-hybridizing probe sets were shown to be a major cause of false predictions of differential alternative splicing (Xing et al., 2008), only unique probe sets (a probe set in which all probes perfectly match only one sequence) were included. Thus 228,871 PLIER probe set signal estimates representing 17,881 genes were imported into Partek® Genomics Suite software version 6.4 (Partek, St. Charles, MO), quantile normalized, and log2 transformed. Technical replicates were normalized and transformed independently.
To remove signals that were not significantly different from the background, “detection above background” p-values were calculated by comparing the signal from each probe to the median intensity of background probes with the same GC content (Affymetrix, 2005; Clark et al., 2007). Probe sets were also filtered based on fraction present (McClintick and Edenberg, 2006). Only probe sets with a detection above background p-value ≤ 0.05 in all the arrays in at least one of the treatment conditions (ethanol or control) were analyzed. This approach was shown to reduce false positives (McClintick and Edenberg, 2006) and to improve correlation between fold changes obtained in array data and quantitative reverse transcription PCR (qRT-PCR) data (Mieczkowski et al., 2010).
A group of probe sets covering all the known isoforms for a given gene (a Transcript cluster) will, for simplicity, be called a gene. After probe sets were filtered (above), genes were subjected to present/absent filtering (McClintick and Edenberg, 2006). A gene was considered to be present if at least 50% of its probe sets were called present in all the samples in at least one treatment group. In the genes that were called present, only probe sets that were present were analyzed. After these quality filtering steps, 127,805 probe sets representing 10,738 genes were included in further analysis.
To determine if a gene is differentially expressed or alternatively spliced, two-way analysis of variance (ANOVA) was carried out in Partek ® Genomics Suite (St. Louis, Missouri). The ANOVA model included experimental factors [treatment condition (ethanol vs. control) and batch ID (technical replicate)] along with the probe sets in each gene. False discovery rate was calculated by the method of Benjamini and Hochberg (1995).
Pathway analysis
To examine canonical pathways affected by chronic ethanol exposure, differentially expressed genes (at a very stringent false discovery rate, FDR ≤ 3%) that had a minimum of 10% change in expression level (991 genes) were analyzed using Ingenuity Pathway Analysis (Ingenuity, Redwood City, CA). Pathways that were significantly affected were then enlarged by adding other genes associated with them that met the criterion of FDR ≤ 15% and at least 10% fold change. This strategy allowed us to focus on the pathways most clearly affected by ethanol, and provided greater insight into the effects of the alcohol on these pathways.
Results
Effects of alcohol on gene expression
To determine the effects of long term ethanol exposure on global gene expression, human hepatoma cells (HepG2) were exposed to 75 mM (0.34%) ethanol for nine days, with fresh media daily. After the initial four day exposure to 75 mM ethanol, there were only 48% as many viable cells as in the control cultures. Two million viable cells were again seeded in new flasks and cultured in ethanol for the next five days. There were again 48% as many viable cells in the ethanol-treated cultures as in the control cultures. Cells appeared to be similar in morphology in both ethanol and control conditions with few floating or dead cells in either culture. Thus the decrease in viable cell number is most likely due to a longer lag phase (as seen in an unpublished experiment on lymphoblastoid cells treated with a similar concentration of ethanol) rather than cell death.
Effects of ethanol on gene expression were studied using Affymetrix GeneChip® Human Exon 1.0 ST Arrays. Among the 17,881 genes represented by main and unique probe sets, 10,738 genes (60%) were reliably detected in at least one of the treatment conditions, and only those were further analyzed. Genes with just one probe set reliably detected were also excluded (516 genes), leaving 10,222 genes that were analyzed. A large number of the genes were differentially expressed: 32% showed differential expression at FDR ≤ 15% (Table 1). However, most of the expression differences were modest; 70% of the absolute fold changes were less than or equal to 1.2 (Figure 1).
Table 1. Ethanol affects expression of many genes.
The number of genes differentially expressed by long-term ethanol exposure is shown at three levels of False Discovery Rate (FDR; calculated according to Benjamini and Hochberg, 1995)
| Number of genes affected by ethanol | ||
|---|---|---|
| FDR 15% | FDR 10% | FDR 3% |
| 3242 | 2423 | 1093 |
Figure 1. Distribution of fold changes of differentially expressed genes (FDR ≤ 15%).
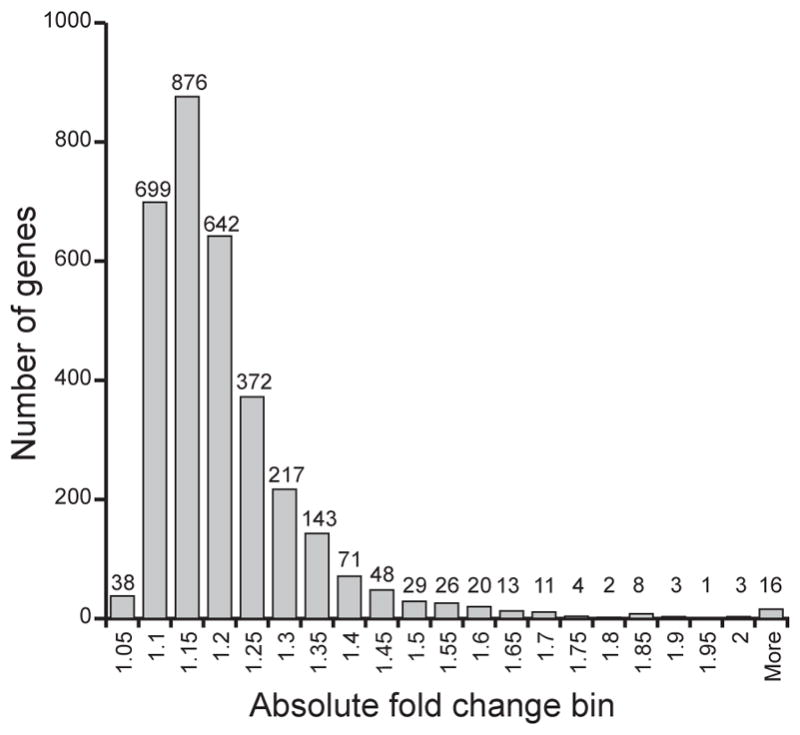
Each bin represents number of genes that have absolute fold change equal to or less than the given value, but greater than the previous bin value (e.g. bin 1.1 shows the number of genes with absolute fold change between 1.0501 and 1.1000).
Genes and pathways affected by chronic ethanol exposure
Among genes involved in alcohol metabolism, the expression of ALDH3B1 and ALDH2 was decreased by 1.32-fold and 1.12-fold, respectively, whereas ALDH1B1 expression increased by 1.13-fold. 44 genes that have been associated with risk for alcoholism (Bierut et al., 2010; Dick et al., 2008; Edenberg et al., 2010; Edenberg et al., 2006; Hill et al., 2004; Kalsi et al., 2009; Reich et al., 1998; Treutlein et al., 2009; Wang et al., 2009) were differentially expressed (Table 2). These include cholinergic receptor, nicotinic, alpha 5 (CHRNA5), 5-hydroxytryptamine (serotonin) receptor 3B (HTR3B) and insulin-like growth factor 1 receptor (IGF1R).
Table 2. Genes associated with alcoholism are differentially expressed.
Differentially expressed genes (FDR ≤ 15% and expression difference ≥ 10%) that have previously been associated with the risk for alcoholism (Bierut et al., 2010; Dick et al., 2008; Edenberg et al., 2010; Edenberg et al., 2006; Hill et al., 2004; Kalsi et al., 2009; Reich et al., 1998; Treutlein et al., 2009; Wang et al., 2009) are shown
| Transcript cluster ID | Gene | Gene Description | Fold-Change (E/C) | Differential expression FDR |
|---|---|---|---|---|
| 3521174 | ABCC4 | ATP-binding cassette, sub-family C (CFTR/MRP), member 4 | 1.14 | 0.01 |
| 3606304 | AKAP13 | A kinase (PRKA) anchor protein 13 | 1.22 | 0.01 |
| 3927226 | APP | amyloid beta (A4) precursor protein | 1.13 | 0.00 |
| 3673684 | CDT1 | chromatin licensing and DNA replication factor 1 | −1.22 | 0.00 |
| 3603436 | CHRNA5 | cholinergic receptor, nicotinic, alpha 5 | 1.36 | 0.02 |
| 2772968 | COX18 | COX18 cytochrome c oxidase assembly homolog (S. cerevisiae) | −1.23 | 0.01 |
| 3720228 | CRKRS | Cdc2-related kinase, arginine/serine-rich | 1.19 | 0.02 |
| 3652424 | EEF2K | eukaryotic elongation factor-2 kinase | 1.11 | 0.01 |
| 3260383 | ENTPD7 | ectonucleoside triphosphate diphosphohydrolase 7 | 1.12 | 0.01 |
| 2948587 | FLOT1 | flotillin 1 | −1.15 | 0.01 |
| 3199511 | FREM1 | FRAS1 related extracellular matrix 1 | 1.82 | 0.00 |
| 2469825 | GREB1 | GREB1 protein | 1.24 | 0.01 |
| 3636391 | HOMER2 | homer homolog 2 (Drosophila) | 1.27 | 0.01 |
| 3349660 | HTR3B | 5-hydroxytryptamine (serotonin) receptor 3B | 2.13 | 0.00 |
| 3779362 | IMPA2 | inositol(myo)-1(or 4)-monophosphatase 2 | −1.24 | 0.01 |
| 3817733 | JMJD2B | jumonji domain containing 2B | −1.17 | 0.00 |
| 3517793 | KLF12 | Kruppel-like factor 12 | 1.30 | 0.00 |
| 2667809 | OSBPL10 | oxysterol binding protein-like 10 | 1.17 | 0.01 |
| 2698996 | PCOLCE2 | procollagen C-endopeptidase enhancer 2 | 1.88 | 0.00 |
| 3358361 | PDDC1 | Parkinson disease 7 domain containing 1 | −1.16 | 0.02 |
| 2361401 | PMF1 | polyamine-modulated factor 1 | −1.19 | 0.02 |
| 2480168 | PRKCE | protein kinase C, epsilon | 1.20 | 0.00 |
| 3213847 | SHC3 | SHC (Src homology 2 domain containing) transforming protein 3 | 1.31 | 0.02 |
| 2902884 | SKIV2L | superkiller viralicidic activity 2-like (S. cerevisiae) | −1.16 | 0.02 |
| 3369366 | SLC1A2 | solute carrier family 1 (glial high affinity glutamate transporter), member 2 | 1.17 | 0.01 |
| 2610544 | SLC6A11 | solute carrier family 6 (neurotransmitter transporter, GABA), member 11 | 1.23 | 0.01 |
| 3751794 | SLC6A4 | solute carrier family 6 (neurotransmitter transporter, serotonin), member 4 | 1.20 | 0.00 |
| 3318666 | SMPD1 | sphingomyelin phosphodiesterase 1, acid lysosomal | 1.18 | 0.03 |
| 2378662 | TRAF5 | TNF receptor-associated factor 5 | 1.84 | 0.00 |
| 3316375 | TSPAN4 | tetraspanin 4 | −1.20 | 0.00 |
| 3896976 | TXNDC13 | thioredoxin domain containing 13 | 1.23 | 0.00 |
| 3815328 | WDR18 | WD repeat domain 18 | −1.19 | 0.01 |
| 3989089 | ZBTB33 | zinc finger and BTB domain containing 33 | 1.27 | 0.01 |
| 3971923 | ZFX | zinc finger protein, X-linked | 1.16 | 0.00 |
| 3078478 | ZNF786 | zinc finger protein 786 | 1.20 | 0.03 |
Forty pathways were significantly affected by this prolonged ethanol exposure (Table 3). Many differentially expressed genes formed parts of several different pathways: 93 differentially expressed genes appeared in more than one significant pathway (Table 4) and thus appear to play important roles in cellular processes. Pathways associated with liver functions, including the acute phase response, hepatic fibrosis and the oxidative stress response (known to play a role in alcohol induced-liver injury), were significantly affected by chronic ethanol. Alcohol affected many acute phase proteins including fibrinogen (FGA) and hemeoxygenase1 (HMOX1) (Table 3, Supplementary Table 1). Several receptors involved in hepatic fibrosis were upregulated by chronic alcohol: fibroblast growth factor receptors (FGFR1 and FGFR2, 1.5-fold), insulin-like growth factor receptor (IGFR1, 1.29-fold), and transforming growth factor B (TGFB1, 1.23). Genes associated with the Nrf2-mediated oxidative stress response were also affected by chronic ethanol treatment (Table 3, Supplementary Table 1).
Table 3. Pathways significantly affected by ethanol exposure.
Genes that were differentially expressed (FDR ≤ 3%; difference ≥ 10%) upon chronic exposure to ethanol were analyzed by Ingenuity Pathways Analysis; significant pathways (p ≤ 0.05) are shown; the differentially expressed genes that met these stringent criteria are shown in bold. Also shown are the genes within these pathways that met FDR ≤ 15% and fold difference ≥ 10%
| Canonical Pathways | p-value | Differentially expressed genes in the pathway |
|---|---|---|
| Liver related | ||
| Acute Phase Response Signaling | 0.0001 | AGT, AMBP, C1R, C1S, CEBPB, CFB, ECSIT, FGA, HAMP, HMOX1, HP, HPX, IL6R, ITIH3, JUN, MRAS, PLG, RBP5, SERPINA3, SERPIND1, SERPINE1, SERPING1, SHC1, STAT3, TTR,C4B, C4BPA, C5, FGG, FTL, IKBKG, IL1R1, IL1RAP, IL6ST, IRAK1, JAK2, MAP2K6, MAPK13, NFKBIB, PIK3R3, RIPK1, TF, TRAF6 |
| Hepatic Fibrosis/Hepatic Stellate Cell Activation | 0.0447 | AGT, CTGF, EGFR, FGFR1, FGFR2, IGF1R, IL4R, IL6R, LEPR, PDGFRB, TGFB1, TGFBR2, TIMP1,BAX, CD40, CSF1, FAS, IFNAR1, IFNAR2, IGF1R, IL1R1, MYL9 (includes EG:10398), TIMP2, VEGFB (includes EG:7423) |
| Cellular stress and injury | ||
| NRF2-mediated Oxidative Stress Response | 0.0355 | ACTA1, DNAJA3, DNAJC3, EPHX1, GCLC, GPX2, HERPUD1, HMOX1, JUN, JUND, MRAS, PRKCE, PRKD1, TXNRD1,ATF4, DNAJB11, DNAJB4, DNAJB9, DNAJC15, DNAJC6, EP300, FTL, GSK3B, GSTA4, MAFK, MAP2K5, MAP2K6, NQO1, PIK3R3, PRKCA, PRKCH, SOD1 |
| Coagulation System | 0.0355 | F10, F7, FGA, PLG, SERPINA5, SERPIND1, SERPINE1,F2R, F5, FGG, SERPINC1 |
| Amino acid Metabolism | ||
| Arginine and Proline Metabolism | 0.0001 | AGMAT, ALDH1B1, ALDH3A2, ALDH3B1, ASL, BCKDHB, C22ORF30, CKB, DAO, GATM, ODC1, P4HA2, PRODH2, SAT2,AOC2 (includes EG:314), ALDH2, ALDH3A2, ALDH5A1, ARG2, ASL, FAAH, GAMT, LAP3, LCMT2, NOS3, PYCR2, PYCRL, VNN1 |
| Glycine, Serine and Threonine Metabolism | 0.0006 | AGXT, BHMT, C22ORF30, CBS, DAO, ETNK2, GATM, GCAT, GLYCTK, GNMT, SARDH, SARS2, SHMT2,AMT (includes EG:275), AOC2 (includes EG:314), CHKA, DMGDH, ELOVL6, GAMT, PSAT1, TARS2 |
| Urea Cycle and Metabolism of Amino Groups | 0.0093 | AGMAT, ASL, CKB, GATM, ODC1, SARDH,ACY1, ARG2, GAMT, LCMT2, PYCR2, PYCRL |
| D-glutamine and D-glutamate Metabolism | 0.0200 | GLS2, TGM4 |
| Glutathione Metabolism | 0.0417 | ACSS2, ANPEP, GCLC, GPX2, IDH2, RAB15,GGT5, GGT7, GSTA4, OPLAH, RNPEP, TAF2 |
| Carbohydrate Metabolism | ||
| Pyruvate Metabolism | 0.0001 | ACSL1, ACSS1, ACSS2, ALDH1B1, ALDH3A2, ALDH3B1, BCKDHB, C22ORF30, NKD1, PC, PCK1, PCK2, RWDD2B, UEVLD,AKR1B1, ALDH1B1, ALDH2, ALDH5A1, LDHD |
| Fructose and Mannose Metabolism | 0.0002 | ALDOC, DUSP18, GMPPB, HK2, MPI, PFKFB1, PFKFB3, PFKFB4, PFKL, PFKP,AKR1B1, ALDOB, ALDOC, DUSP18, FPGT, FUK, GALK1, GMPPB, HK2, MPI, PFKFB1, PFKFB2, PFKFB3, PFKFB4, PFKL, PFKP |
| Glycolysis/Gluconeogenesis | 0.0003 | ACSL1, ACSS1, ACSS2, ALDH1B1, ALDH3A2, ALDH3B1, ALDOC, ENO2, HK2, PFKL, PFKP, PTGR1, RWDD2B, UEVLD,ALDH2, ALDH5A1, ALDOB, GALK1 |
| Ascorbate and Aldarate Metabolism | 0.0019 | ALDH1B1, ALDH3A2, ALDH3B1, BCKDHB, C22ORF30, CYP24A1,ALDH2, ALDH5A1 |
| Propanoate Metabolism | 0.0025 | ACADS, ACSL1, ACSS1, ACSS2, ALDH1B1, ALDH3A2, ALDH3B1, ALDH6A1, CCBL1, GCDH, UEVLD,ALDH2, ALDH5A1, EHHADH, MUT, SLC27A3, SUCLG1 |
| Citrate Cycle | 0.0151 | IDH2, OGDH, PC, PCK1, PCK2,SDHA, SUCLG1 |
| Glycosaminoglycan Degradation | 0.0355 | GALNS, KLB, MGEA5, NAGLU, SULF2,ARSB, GM2A, HYAL3, IDS, NAGA, SGSH |
| Lipid metabolism | ||
| Glycerolipid Metabolism | 0.0060 | AGPAT3, ALDH1B1, ALDH3A2, ALDH3B1, DGKG, GLYCTK, GPAM, LIPC, LIPG, LPIN2, PNPLA3, PTGR1,AKR1B1, ALDH1B1, ALDH2, ALDH3A2, ALDH3B1, ALDH5A1, DGKG, GK, GLYCTK, GPAM, LIPA, LIPC, LIPG, LPIN1, LPIN2, NAGA, PNPLA3, PTGR1 |
| Glycerophospholipid Metabolism | 0.0166 | AGPAT3, C22ORF30, DGKG, ETNK2, GDE1, GPAM, HMOX1, LIPG, LPCAT2, LPIN2, NAPEPLD, PLA2G12B, PLA2G15, PNPLA3,CHKA, ELOVL6, ETNK1, GDPD1, GPLD1, LPIN1, PHKA1 |
| Fatty Acid Metabolism | 0.0407 | ACADS, ACOX1, ACSL1, ALDH1B1, ALDH3A2, ALDH3B1, CPT1A, CYP4F11, GCDH, PTGR1,ALDH2, ALDH3B1, ALDH5A1, CYP19A1, CYP2S1, CYP3A43, CYP4F12, EHHADH, SLC27A3 |
| C21-Steroid Hormone Metabolism | 0.0479 | CYP21A2, HSD17B2, HSD3B7,AKR1C1 |
| Cellular/humoral immune response | ||
| IL-3 Signaling | 0.0045 | FOXO1, JUN, MRAS, PAK1, PRKCE, PRKD1, SHC1, STAT3, STAT6,JAK2, PIK3R3, PRKCA, PRKCH, PTPN6 |
| T Helper Cell Differentiation | 0.0117 | IL10RB, IL4R, IL6R, RORC, STAT3, STAT6, TGFB1, TGFBR2,CD40, IL6ST |
| Fcγ Receptor-mediated Phagocytosis in Macrophages and Monocytes | 0.0468 | ACTA1, HMOX1, LYN, MYO5A, NAPEPLD, PAK1, PRKCE, PRKD1, PTK2B,CBL, GPLD1, PIK3R3, PRKCA, PRKCH, RPS6KB1, VASP |
| Nuclear receptor signaling | ||
| FXR/RXR Activation | 0.0138 | FASN, FOXA1, FOXO1, HNF4A, LIPC, MTTP, NR0B2, PCK2, SREBF1, UGT2B4, VLDLR,ABCB4, APOE, CYP19A1, CYP7A1, HNF4A, NR1H3, NR1I2, PLTP, SLC22A7, SULT2A1 |
| PPARα/RXRα Activation | 0.0166 | ABCA1, ACOX1, ADCY1, FASN, GNAQ, JUN, MAP4K4, MRAS, NCOA3, NR0B2, NR2C2, SHC1, TGFB1, TGFBR2, TGFBR3,ACVR1B, ACVR2B, EP300, GK, IKBKG, IL1R1, JAK2, MAP2K6, NFKBIB, PRKAB1, PRKACB, PRKCA, TRAF6 |
| PXR/RXR Activation | 0.0209 | ALDH3A2, CES3, CPT1A, FOXO1, HNF4A, NR0B2, PCK2,ABCB1, ABCB9, CYP7A1, IGFBP1, NCOA1, NR1I2, PRKACB, SULT2A1 |
| TR/RXR Activation | 0.0347 | AKR1C2, F10, FASN, FGA, HP, LDLR, NCOA3, PCK1, PFKP, SLC16A3, SREBF1, UCP2,AKR1C1, CYP7A1, EP300, HIF1A, MDM2, NCOA1, PDE3B, PIK3R3, STRBP |
| Signaling pathways | ||
| Estrogen-Dependent Breast Cancer Signaling | 0.0019 | CREB3L4, EGFR, HSD17B1, HSD17B2, HSD17B8, IGF1R, JUN, MRAS, TERT,ATF4, CCND1, CYP19A1, HSD17B12, PIK3R3 |
| Renin-Angiotensin Signaling | 0.0024 | ADCY1, AGT, GNAQ, ITPR3, JUN, MRAS, PAK1, PRKCE, PRKD1, PTK2B, SHC1, SHC3, STAT3,ITPR2, JAK2, MAPK13, PRKACB, PRKCA, PRKCH, PTPN6 |
| Thrombopoietin Signaling | 0.0089 | JUN, MRAS, PRKCE, PRKD1, SHC1, STAT3, THPO,JAK2, PIK3R3, PRKCA, PRKCH |
| Oncostatin M Signaling | 0.0126 | EPAS1, MRAS, SHC1, STAT3, TIMP3,IL6ST, JAK2, MMP3 |
| Cholecystokinin/Gastrin-mediated Signaling | 0.0263 | EGFR, FNBP1, GNAQ, ITPR3, JUN, MRAS, PRKCE, PRKD1, PTK2B, SHC1,BCAR1, ITPR2, MAP2K5, MAP2K6, MEF2A (includes EG:4205), PRKCA, PRKCH, RHOT2, ROCK1, SRF |
| GNRH Signaling | 0.0269 | ADCY1, CREB3L4, DNM2, EGFR, EGR1, GNAQ, ITPR3, JUN, MAP3K15, MRAS, PAK1, PRKCE, PRKD1,ATF4, ITPR2, MAP2K6, MAP3K8, MAPK13, PRKACB, PRKCA, PRKCH |
| Phospholipase C Signaling | 0.0468 | ADCY1, ARHGEF3, CREB3L4, FNBP1, GNAQ, HDAC11, HDAC5, HDAC6, HMOX1, ITPR3, LYN, MRAS, NAPEPLD, PLA2G12B, PRKCE, PRKD1, SHC1,ARHGEF11, ARHGEF16, ATF4, EP300, GNB2, GPLD1, ITGB1, ITPR2, MARCKS, MEF2A (includes EG:4205), MYL9 (includes EG:10398), PEBP1, PRKCA, PRKCH, RHOT2 |
| Prolactin Signaling | 0.0065 | CEBPB, JUN, MRAS, NMI, PDK1, PRKCE, PRKD1, SHC1, STAT3,CEBPB, EP300, JAK2, PIK3R3, PRKCA, PRKCH |
| Androgen and Estrogen Metabolism | 0.0380 | HSD17B1, HSD17B2, HSD17B8, HSD3B7, METTL7B, STS, SULF2, UGT2B4,AKR1C1, ARSB, HSD17B12, METTL7B, MGMT, SULT2A1 |
| G Beta Gamma Signaling | 0.0468 | ADCY1, DNM2, EGFR, GNAQ, MRAS, PAK1, PRKCE, PRKD1, SHC1,GNAL, GNB2, PRKACB, PRKCA, PRKCH |
| Other | ||
| Cell Cycle: G1/S Checkpoint Regulation | 0.0288 | ABL1, BTRC, CCNE1, CDK4, HDAC11, HDAC5, HDAC6, TGFB1,CCND1, CCNE2, CDK6, CDKN1A, E2F3, GSK3B |
| Nitrogen Metabolism | 0.0117 | CA9, CCBL1, GLS2, HAL, PTPRG, SARDH, TGM4,AMT (includes EG:275), CA13, CA14, CA5A, CCDC92 (includes EG:80212), DMGDH, VNN1 |
| Bile Acid Biosynthesis | 0.0191 | ALDH1B1, ALDH3A2, ALDH3B1, HSD3B7, PTGR1, SOAT2,AKR1C1, ALDH2, ALDH5A1, CYP7A1, LIPA |
Table 4. Differentially expressed genes present in multiple significant pathways.
Genes that were present in at least five significantly affected pathways (Table 3) are shown
| Molecules | # of pathways | Significant pathways |
|---|---|---|
| MRAS | 13 | Prolactin Signaling; Estrogen-Dependent Breast Cancer Signaling; Thrombopoietin Signaling; Oncostatin M Signaling; G Beta Gamma Signaling; Cholecystokinin/Gastrin-mediated Signaling;GNRH Signaling; IL-3 Signaling; NRF2-mediated Oxidative Stress Response; Renin-Angiotensin Signaling; Acute Phase Response Signaling; Phospholipase C Signaling; PPARa/RXRa Activation |
| JUN | 10 | Estrogen-Dependent Breast Cancer Signaling; Prolactin Signaling; Cholecystokinin/Gastrin-mediated Signaling;Thrombopoietin Signaling; IL-3 Signaling; GNRH Signaling; NRF2-mediated Oxidative Stress Response; Renin-Angiotensin Signaling; PPARa/RXRa Activation; Acute Phase Response Signaling |
| PRKCE | 10 | Prolactin Signaling; Thrombopoietin Signaling; NRF2-mediated Oxidative Stress Response; G Beta Gamma Signaling; IL-3 Signaling; Cholecystokinin/Gastrin-mediated Signaling;Fcg Receptor-mediated Phagocytosis in Macrophages and Monocytes; GNRH Signaling; Renin-Angiotensin Signaling; Phospholipase C Signaling |
| PRKD1 | 10 | IL-3 Signaling; Prolactin Signaling; Cholecystokinin/Gastrin-mediated Signaling;Fcg Receptor-mediated Phagocytosis in Macrophages and Monocytes; Thrombopoietin Signaling; G Beta Gamma Signaling; GNRH Signaling; Renin-Angiotensin Signaling; NRF2-mediated Oxidative Stress Response; Phospholipase C Signaling |
| SHC1 | 10 | IL-3 Signaling; Prolactin Signaling; Thrombopoietin Signaling; Oncostatin M Signaling; Cholecystokinin/Gastrin-mediated Signaling;G Beta Gamma Signaling; Renin-Angiotensin Signaling; Acute Phase Response Signaling; PPARa/RXRa Activation; Phospholipase C Signaling |
| ALDH3A2 | 9 | Propanoate Metabolism; Bile Acid Biosynthesis; Fatty Acid Metabolism; Ascorbate and Aldarate Metabolism; Arginine and Proline Metabolism; Pyruvate Metabolism; Glycerolipid Metabolism;PXR/RXR Activation; Glycolysis/Gluconeogenesis |
| ALDH1B1 | 8 | Arginine and Proline Metabolism; Glycolysis/Gluconeogenesis; Ascorbate and Aldarate Metabolism; Propanoate Metabolism; Glycerolipid Metabolism;Bile Acid Biosynthesis; Fatty Acid Metabolism; Pyruvate Metabolism |
| ALDH3B1 | 8 | Bile Acid Biosynthesis; Ascorbate and Aldarate Metabolism; Propanoate Metabolism; Fatty Acid Metabolism; Glycolysis/Gluconeogenesis; Glycerolipid Metabolism;Arginine and Proline Metabolism; Pyruvate Metabolism |
| STAT3 | 7 | Renin-Angiotensin Signaling; Oncostatin M Signaling; Prolactin Signaling; Thrombopoietin Signaling; IL-3 Signaling; T Helper Cell Differentiation; Acute Phase Response Signaling |
| GNAQ | 6 | Renin-Angiotensin Signaling; Phospholipase C Signaling; PPARa/RXRa Activation; GNRH Signaling; G Beta Gamma Signaling; Cholecystokinin/Gastrin-mediated Signaling; |
| ADCY1 | 5 | G Beta Gamma Signaling; GNRH Signaling; Renin-Angiotensin Signaling; Phospholipase C Signaling; PPARa/RXRa Activation |
| C22ORF30 | 5 | Ascorbate and Aldarate Metabolism; Pyruvate Metabolism; Glycine, Serine and Threonine Metabolism; Arginine and Proline Metabolism; Glycerophospholipid Metabolism; |
| EGFR | 5 | Estrogen-Dependent Breast Cancer Signaling; G Beta Gamma Signaling; Cholecystokinin/Gastrin-mediated Signaling;GNRH Signaling; Hepatic Fibrosis/Hepatic Stellate Cell Activation |
| HMOX1 | 5 | Fcg Receptor-mediated Phagocytosis in Macrophages and Monocytes; Glycerophospholipid Metabolism; NRF2-mediated Oxidative Stress Response; Phospholipase C Signaling; Acute Phase Response Signaling; |
| PAK1 | 5 | G Beta Gamma Signaling; IL-3 Signaling; Fcg Receptor-mediated Phagocytosis in Macrophages and Monocytes; GNRH Signaling; Renin-Angiotensin Signaling |
Chronic ethanol treatment affected genes encoding proteins involved in cellular metabolism (Table 3, Supplementary Table 1). Multiple genes involved in the metabolism of arginine, proline and small amino acids (glycine, serine, threonine) were affected. Genes encoding urea cycle enzymes arginase (ARG2) and arginosuccinate lyase (ASL) were changed by −1.17 and −1.15-fold. Many genes related to carbohydrate metabolism, glycolysis and gluconeogenesis decreased in expression upon ethanol treatment. Enzymes involved in fructose metabolism were also affected; liver isozyme 6-phosphofructo-2-kinase/fructose-2,6-biphosphatase 1 (PFKFB1), which catalyzes both the synthesis and degradation of fructose-2,6-biphosphate, increased by 1.41-fold with ethanol exposure. Lipid related pathways, including glycerolipid metabolism, glycerophospholipid metabolism and fatty acid metabolism, were affected. Enzymes involved in glycerophospholipid metabolism were upregulated by ethanol; choline kinase alpha (CHKA) and ethanolamine kinases (ETNK2) were increased in expression by 1.13 and 1.3-fold respectively. Key fatty acid oxidation enzymes carnitine palmitoyltransferase 1A (CPT1A) and acyl-Coenzyme A dehydrogenase (ACADS) were decreased by 50% and 24%, respectively.
Validation of differential gene expression by qRT-PCR
Quantitative real time RT-PCR assays (qRT-PCR; Taqman gene expression assays) were carried out to confirm the differential gene expression observed in the microarray data. Thirteen genes were selected from the key pathways that were affected by chronic ethanol treatment. All thirteen genes tested were confirmed to be altered by ethanol exposure (all p<5×10⁻⁶), with fold changes very similar to that observed in the array data (Figure 2). Even small expression changes in the array data were confirmed by these assays. For example SREBF1 decreased in expression by 15% in the array data and was confirmed to be decreased by 19% by qRT-PCR (Figure 2).
Figure 2. qRT-PCR validation of differential gene expression.

Comparison of the ratio of expression in ethanol treated vs. control cells based upon microarray data and qRT-PCR data. For all genes, the qRT-PCR showed a significant difference between the two conditions, with all p-values ≤ 5 × 10⁻⁶.
Discussion
The effects of extended alcohol exposure on global gene expression were studied in a human hepatoma cell line, HepG2. These cells do not express class I ADH genes or cytochrome P450 2E1, but they do express ADH4 (Tian and Edenberg, 2005), which metabolizes ethanol at the concentration tested (75 mM; the Km for ADH4 is 30 mM) (Edenberg and Bosron, 2010). These cells have been used to study effects of ethanol on individual genes, and showed increases in tumor necrosis factor alpha receptor comparable to that seen in rat hepatoma cells that do express ADH1 (Rodriguez et al., 2004). This model system helped to identify the effects of alcohol on human hepatocyte-like cells in the absence of potential signaling from neighboring cells, and without the complication of multiple cell types in liver.
HepG2 cells were cultured in the presence of 75 mM (0.34%) ethanol for 9 days. Alcoholic beverages range from approximately 4.5% ethanol (900 mM) for beer to 12% ethanol (2 M) for wine to 40% ethanol (7 M) in spirits. Because 80% of alcohol is absorbed in the small intestine and most ingested alcohol is carried directly to the liver via the portal vein, liver is exposed to high concentrations of alcohol. Cultures of HepG2 cells grown for 4 – 5 days in ethanol had fewer viable cells than untreated cultures; we did not observe an excess of dead or non-adherent cells. We think that the reduced number of cells is due to a prolonged lag phase after splitting the culture, an effect we have seen in unpublished experiments on lymphoblastoid cell lines, in which growth rates were measured. In the current data, alcohol affected expression of cell cycle genes, but the net effects on the length of cell cycle were not clear: Cyclin D1 (CCND1), Cyclin E1 (CCNE1) and cyclin-dependent kinase 6 CDK6 increased in expression, while cyclin-dependent kinase 4 (CDK4) decreased.
Chronic exposure to ethanol significantly altered the expression of thousands of genes (Table 1), but most of these differences were small (≤ 20%; Figure 1). Statistical power obtained from the total of eight arrays used for each condition, along with multiple probe sets that target each gene, allowed us to detect these small changes. We validated changes as small as 15% in qRT-PCR studies (Figure 2). Although the importance of any one small change in gene expression may be difficult to assess, and may not be proportional to the change in protein level, we think that the overall pattern of changes in gene expression sheds light on the cellular response. To elucidate the pattern of gene expression caused by chronic ethanol exposure, we analyzed 991 genes that differed at a very stringent false discovery rate (FDR ≤ 3%), including genes with a minimum of 10% change in expression level; a pattern of even small changes in a pathway is an indicator of biological significance.
Chronic ethanol treatment of HepG2 cells increased the expression of positive acute phase proteins (proteins with increased expression in the acute phase response) such as fibrinogens (FGG, FGA), angiotensiongen (AGT), and SERPINs (A3, D1, G1) (Table 3; Supplementary Table 1). The increase in expression of FGG was confirmed by qRT-PCR (Figure 2). Thus chronic alcohol triggers at least part of the acute phase response (Figure 3), a response to infection, inflammation, tissue injury, or malignancy characterized by changes in the expression of many proteins (Gabay and Kushner, 1999). Expression of Interleukin 6 (IL-6), one of the primary mediators of acute phase response in the liver, was not detected above background in our data. However, interleukin 6 signal transducer (IL6ST) and the intracellular signal transducer of IL-6, janus kinase 2 (JAK2), increased in expression by 20% and 43%, respectively. A modest increase in the expression of transcription factor signal transducer and activator of transcription 3 (STAT3) was also observed, consistent with the induction of acute phase response.
Figure 3. Acute phase response pathway.

Acute phase response pathway is shown, with differentially expressed genes (FDR ≤ 15%; difference ≥ 10%) indicated in red (down-regulated) or in green (up-regulated).
Alcohol metabolism generates reactive oxygen species (ROS) and creates a state of oxidative stress in hepatocytes (Bailey et al., 1999). In response to oxidative stress, the transcription factor Nuclear factor-erythroid 2-related factor 2 (Nrf2, encoded by NFE2L2) regulates expression of multiple genes involved in antioxidant defenses (Itoh et al., 1997; McMahon et al., 2001). Increase in the levels of Nrf2 transcript and protein were observed in animal livers and in CYP2E1-expressing HepG2 cells exposed to alcohol (Gong and Cederbaum, 2006). Deletion of Nrf2 in mice was shown to aggravate alcohol-induced liver damage (Lamle et al., 2008). Although we did not observe an increase in the expression of Nrf2 itself, many Nrf2 regulated genes were differentially expressed (Figure 4). This could be due to the activation of the Nrf2 protein instead of an increase in the levels of its expression; under non-stress conditions, kelchlike ECH-associated protein 1 (Keap1) sequesters Nrf2 and targets it for ubiquitination, but oxidative stress leads to Keap1 dissociation and increased functional Nrf2 (Itoh et al., 1999). One of the Nrf2 transcribed genes that was affected by chronic alcohol exposure is the catalytic subunit of the glutamate cysteine ligase (GCLC; 20% increase), which carries out the rate-limiting step of glutathione synthesis. This increase in expression was confirmed by qRT-PCR (Figure 2). The synthesis of glutathione is also regulated by the availability of cysteine. SLC7A11, one of the subunits of amino acid transport system χc− involved in the uptake of cystine, was expressed at higher levels (1.54-fold) after chronic ethanol treatment, which could be an additional response of the cell to maintain cellular GSH levels. Ethanol increased expression of other Nrf2-regulated antioxidant enzymes: glutathione S-transferase alpha 4 (GSTA4), glutathione peroxidase 2 (GPX2), superoxide dismutase 1 (SOD1), thioredoxin reductase 2 (TXNRD2). Multiple genes belonging to the DNAJ/Hsp40 family of chaperone proteins were upregulated with ethanol. DNAJ members stimulate the ATP hydrolysis of Hsp70 proteins, and are thus essential for the activity of Hsp70 proteins. Thus our data show that alcohol exposure generates a multifaceted oxidative stress response in HepG2 cells.
Figure 4. Nrf2-mediated oxidative stress response.

Nrf2-mediated oxidative stress response pathway is shown, with differentially expressed genes (FDR ≤ 15%; difference ≥ 10%) indicated in red (down-regulated) or in green (up-regulated).
Several genes involved in the metabolism of amino acids were downregulated by ethanol. Glycine amidinotransferase (GATM) and guanidinoacetate N-methyltransferase (GAMT), which mediate the conversion of arginine to creatine, were downregulated. Ornithine decarboxylase (ODC), which converts ornithine to putrescine, increased in expression by 15%. An increase in ODC activity was observed from chronic ethanol exposure after partial hepatectomy (Diehl et al., 1988; Poso and Poso, 1980). In contrast, agmatinase (AGMAT), which leads to the synthesis of putrescine from agmatine, decreased in expression by the same magnitude. Betaine-homocysteine methyltransferases (BHMT, BHMT2), which carry out the folate-independent conversion of homocysteine to methionine, were increased in expression (the BHMT data were validated by qRT-PCR; Figure 2). Cystathionine β-synthase (CBS), which catalyzes the trans-sulfuration of homocysteine to cystathione, was downregulated by a modest 12%. This increase in the expression of BHMTs and decrease in CBS expression could be an adaptive response to maintain the levels of essential amino acid methionine in the cells.
Effects of alcohol on the activity of enzymes involved in carbohydrate metabolism have been recognized for many years; alcohol alters NADH/NAD+ ratio and this affects the activity of many enzymes in glycolysis and the citric acid cycle (Badawy, 1977). We saw a decrease in the expression of many genes involved in carbohydrate metabolism, including two key regulatory proteins in the glycolytic pathway, hexokinase (HK2; validated by qRT-PCR, Figure 2) and phosphofructokinase (PFKL). Phosphofructokinase (PFKL), which catalyzes the irreversible conversion of fructose-6-phosphate to fructose-1, 6-bisphosphate in the glycolytic pathway, was decreased by 1.25 fold. Oxoglutarate dehydrogenase (OGDH) and isocitrate dehydrogenase (IDH3B), which carry out regulatory steps in the citric acid cycle and are inhibited by NADH, showed lower expression after chronic ethanol treatment. The cytosolic form of phosphoenol pyruvate carboxykinase (PCK1), which catalyzes an important control point in gluconeogenesis, decreased by 1.35-fold (confirmed by qRT-PCR; Figure 2). Gluconeogenic enzymes pyruvate carboxylase (PC) and phosphoenol puruvate carboxykinase (PCK1) also decreased by 1.22-and 1.35-fold. Glycerol has to be phosphorylated by glycerol kinase (GK) to enter into the gluconeogenic pathway (Walker et al., 1993); expression of GK decreased (−1.33-fold), indicating an additional mechanism by which alcohol inhibits hepatic gluconeogenesis. Decrease in the expression of key regulatory enzymes of glycolysis and gluconeogenesis correlates with the reported decrease in glycolysis and gluconeogensis due to alcohol.
Ethanol had a modest (15% decrease) effect on the expression of serum response regulatory binding factor 1 (SREBF1; confirmed by qRT-PCR, Figure 2). SREBF1 regulates many genes that participate in fatty acid synthesis, including fatty acid synthase. Previous data in H4IIE-C3 cells showed a transient increase (in the first 30 min) in SREBF1, which then dropped to equal the control (You et al., 2002). A study in mice showed an increase up to 6-weeks of exposure (Ji and Kaplowitz, 2003), in contrast to the decrease we observed; this suggests that signaling from other cells could affect expression of SREBF1.
Key genes involved in the fatty acid beta-oxidation pathway were affected by ethanol. With chronic ethanol treatment, acyl-CoA synthetases involved in the activation of fatty acids were differentially expressed. CPT1A which transports activated fatty acyl-coA esters across the mitochondrial inner membrane decreased by 50% (confirmed by qRT-PCR; Figure 2). A deficiency of this protein was shown to decrease the rate of fatty acid beta oxidation (Aoyama et al., 1998). Mitochondrial and peroxisomal enzymes of fatty acid oxidation, Acyl-CoA dehydrogenase, short chain (ACADS) and Acyl-CoA oxidase, palmitoyl, (ACOX1) decreased in expression by at least 20%. Mitochondrial Glycerol-3-phosphate acyltransferase (GPAM), involved in the first step of de novo synthesis of triglycerides and glycerophospholipids, increased by 1.31-fold. Overexpression of Gpam protein in mice was shown to increase serum and liver triglycerides, while decreasing fatty acid β-oxidation and steatosis (Linden et al., 2006). Thus, the decrease in expression of many genes encoding enzymes involved in fatty acid oxidation and an increase in some key genes of triglyceride synthesis that we detected after chronic alcohol exposure could partly explain the development of alcohol induced fatty liver.
Recent studies indicate that ethanol affects epigenetic modifications of histones and DNA (Bonsch et al., 2006; Lee and Shukla, 2007; Park et al., 2005; Shukla and Aroor, 2006). We detected an increase in expression of a set of chromatin modifying enzymes were affected (Supplementary Table 1). A 1.25-fold increase in the expression of DNMT3B, one of the de novo DNA methyl transferases, was validated (1.31-fold) by qRT-PCR (Figure 2). Expression of methyl-CpG binding domain protein 5 (MBD5) was also increased by 43%. The MBD family of proteins binds to methylated CpG regions in the DNA leading to transcriptional repression. Histone deacetylases HDAC5 (Zhang et al., 2002) and HDAC11 (Villagra et al., 2009), which are involved in the negative regulation of transcription, decreased in expression along with microtubule associated HDAC6. Histone acetylase MYST4 increased in expression by 20% where as MYST1 decreased modestly (11%). The decreases in histone deacetylases and increase in a histone acetylase may in part explain the increase the acetylation of histone 3 lysine 9 (H3K9) acetylation observed upon alcohol exposure (Park et al., 2005).
Several previous studies of whole liver used different species and early versions of microarrays, and could query only a limited subset of genes; the total number of genes detected as being expressed in liver in these studies ranged from about 1300 to 4900. The small numbers of genes examined, and the focus on changes of at least 2-fold, limits analyses at the level of pathways. Using the more modern arrays now available, we detected 10,222 genes expressed in these human hepatoma cells, of which 3242 showed significantly altered expression. Deaciuc et al. (2004a) examined changes in the liver of rats fed alcohol by intragastric infusion for 4 weeks. The rat toxicology array they used detected expression of only 2069 genes in the liver, of which 72 showed changes. Deaciuc et al. (2004b) did a similar study in mice, and reported 110 genes altered at least 2-fold. Deaciuc et al. (2004c) studied livers of rats voluntarily drinking alcohol, and report 14 changes of at least 2-fold due to the alcohol alone. Tadik et al (2002) examined livers of rats fed the Leiber-DeCarli diet and found changes in sex hormones and differences in the effects of alcohol on gene expression in male and female rats; this demonstrates that changes outside the liver in the intact animal can alter the effects of ethanol on liver. Our model system isolates the hepatocyte-like cells from such influences. Park et al. (2008) reported 182 genes whose expression was altered at least 2-fold in livers of rats fed ethanol for 8 weeks. The main pathways they found affected were signal transduction, transcription, immune response, and protein/amino acid metabolism. These pathways were also altered in our study, but with the higher resolution gained by testing many more genes, we could more clearly delineate the pathways (Table 3). Yin et al. (2007) studied mice treated with a single oral dose of ethanol and reported changes of 2-fold or more in 28 genes, including genes of fatty acid synthesis; although we detected changes in several pathways of lipid metabolism in our chronic exposure, we did not detect changes in the same genes within the pathways. Seth et al. (2003) used cDNA arrays to examine baboon liver, and detected an excess of upregulated genes. Many of the pathways they report were also found altered in the isolated cells. Despite the limitation of small numbers of genes reported, we compared our results to these studies on whole liver RNA, to identify effects that are endogenous to hepatocyte-like cells in the absence of neighboring cells or hormonal influence. We identified 38 genes that were affected by ethanol in our data and also in liver from whole animals (Supplementary Table 2). Of these, 22 genes had fold changes in the same direction, including those encoding receptors (FGFR1and FGFR2), antioxidant proteins (SOD1, TXN2) and metabolic protein (PCK1, ODC1). Metabolism and fibrosis are the broad functional categories that were affected both in isolated cells and animal studies. Key differences, as expected, were in genes that are associated with non-hepatocyte cells. Hepatic stellate cells (HSC) activation markers like endothelin 1 (EDN1), CD14 molecule (CD14) that were shown to be upregulated in the human liver were unaffected in our data. Similarly, Annexin A2 (ANXA2) that was upregulated in human ALD bile ducts was also unaffected in our data. Other genes associated with hepatic stellate activation such as chemokine (C-C) motif ligand 2 (CCL2), matrix metallopeptidases 2 and 7 (MMP2 and MMP7) were undetected in our system. Alcoholism is a complex genetic disorder and multiple genes have been associated with this disease. In several of these associated genes, polymorphisms in the cis-acting regulatory elements have been shown to affect the expression level of the gene (Edenberg et al., 1999; Pochareddy and Edenberg, 2011). Our data show that long-term ethanol exposure affects expression of several genes previously associated with alcoholism in humans (Table 2) including Insulin-like growth factor 1 receptor (IGF1R), cholinergic receptor, nicotinic, alpha 5 (CHRNA5), and 5-hydroxytryptamine (serotonin) receptor 3B (HTR3B). The fact that alcohol affects expression of these genes in at least one cell type suggests it might affect expression in others; a potential gene x environment interaction between variants in these genes and exposure to alcohol might affect risk.
Examining the global effects of ethanol exposure at the level of RNA rather than protein has advantages and disadvantages. With good experimental design and analysis, microarrays can reliably detect even small differences in gene expression, and patterns of even small changes can point to important physiological responses. However, gene expression is regulated at many stages and changes in mRNA levels may not necessarily correlate with changes in protein levels, nor can they reflect changes in post-translational processing or modification. But it is difficult to measure small changes in protein levels. For some of the genes differentially expressed in our study, similar protein changes have been reported in other studies. The 1.5-fold increase in BHMT RNA levels in our data is similar to a 2-fold increase in the activity and protein levels of BHMT reported in rats fed with Lieber DeCarli ethanol diet (Kharbanda et al., 2007). Reductions of 34–49% in levels of IDH2, ALDH2, ACADS, and ALDOB protein were reported in a proteomics study of rat liver (Klouckova et al., 2006); we found decreases of 12–17% in their mRNA levels. We demonstrated a decrease (−1.41 fold) in hepcidin antimicrobial peptide (HAMP) mRNA and an increase (1.29-fold; Supplementary Table 1) in ferritin light chain (FTL) mRNA. Similar changes in the serum levels of ferritin and hepcidin antimicrobial peptide have been reported in alcoholics (Chick et al., 1987; Ohtake et al., 2007).
In conclusion, data from our study demonstrates that effects of alcohol on isolated, liver-derived cells, leads to changes in the expression of many genes. Some of these changes might in part protect the liver (anti-oxidant response) while others might contribute to pathological changes in the liver such as fibrosis and fatty acid accumulation.
Supplementary Material
Acknowledgments
This work was supported by grant R37AA006460 from the National Institute on Alcohol Abuse and Alcoholism, NIH.
We thank Dr. Jeanette McClintick and Dr. Yunlong Liu for their advice in data analysis. Microarrays were analyzed using the facilities of the Center for Medical Genomics at Indiana University School of Medicine.
References
- Affymetrix. Gene Signal Estimates from Exon Arrays. Affymetrix Inc; 2005. [Google Scholar]
- Aoyama T, Peters JM, Iritani N, Nakajima T, Furihata K, Hashimoto T, Gonzalez FJ. Altered constitutive expression of fatty acid-metabolizing enzymes in mice lacking the peroxisome proliferator-activated receptor alpha (PPARalpha) J Biol Chem. 1998;273:5678–5684. doi: 10.1074/jbc.273.10.5678. [DOI] [PubMed] [Google Scholar]
- Badawy AAB. A Review of the Effects of Alcohol on Carbohydrate Metabolism. Alcohol Alcohol. 1977;12:120–136. [Google Scholar]
- Bailey SM, Pietsch EC, Cunningham CC. Ethanol stimulates the production of reactive oxygen species at mitochondrial complexes I and III. Free Radic Biol Med. 1999;27:891–900. doi: 10.1016/s0891-5849(99)00138-0. [DOI] [PubMed] [Google Scholar]
- Bierut LJ, Agrawal A, Bucholz KK, Doheny KF, Laurie C, Pugh E, Fisher S, Fox L, Howells W, Bertelsen S, et al. A genome-wide association study of alcohol dependence. Proc Natl Acad Sci U S A. 2010;107:5082–5087. doi: 10.1073/pnas.0911109107. [DOI] [PMC free article] [PubMed] [Google Scholar]
- Bonsch D, Lenz B, Fiszer R, Frieling H, Kornhuber J, Bleich S. Lowered DNA methyltransferase (DNMT-3b) mRNA expression is associated with genomic DNA hypermethylation in patients with chronic alcoholism. J Neural Transm. 2006;113:1299–1304. doi: 10.1007/s00702-005-0413-2. [DOI] [PubMed] [Google Scholar]
- Chick J, Pikkarainen J, Plant M. Serum ferritin as a marker of alcohol consumption in working men. Alcohol Alcohol. 1987;22:75–77. [PubMed] [Google Scholar]
- Clark TA, Schweitzer AC, Chen TX, Staples MK, Lu G, Wang H, Williams A, Blume JE. Discovery of tissue-specific exons using comprehensive human exon microarrays. Genome Biol. 2007;8:R64. doi: 10.1186/gb-2007-8-4-r64. [DOI] [PMC free article] [PubMed] [Google Scholar]
- Deaciuc IV, Arteel GE, Peng X, Hill DB, McClain CJ. Gene expression in the liver of rats fed alcohol by means of intragastric infusion. Alcohol. 2004a;33:17–30. doi: 10.1016/j.alcohol.2004.04.001. [DOI] [PubMed] [Google Scholar]
- Deaciuc IV, Doherty DE, Burikhanov R, Lee EY, Stromberg AJ, Peng X, de Villiers WJ. Large-scale gene profiling of the liver in a mouse model of chronic, intragastric ethanol infusion. J Hepatol. 2004b;40:219–227. doi: 10.1016/j.jhep.2003.10.021. [DOI] [PubMed] [Google Scholar]
- Deaciuc IV, Peng X, D’Souza NB, Shedlofsky SI, Burikhanov R, Voskresensky IV, de Villiers WJ. Microarray gene analysis of the liver in a rat model of chronic, voluntary alcohol intake. Alcohol. 2004c;32:113–127. doi: 10.1016/j.alcohol.2003.12.001. [DOI] [PubMed] [Google Scholar]
- Dick DM, Aliev F, Wang JC, Saccone S, Hinrichs A, Bertelsen S, Budde J, Saccone N, Foroud T, Nurnberger J, Jr, et al. A Systematic single nucleotide polymorphism screen to fine-map alcohol dependence genes on chromosome 7 identifies association with a novel susceptibility gene ACN9. Biol Psychiatry. 2008;63:1047–1053. doi: 10.1016/j.biopsych.2007.11.005. [DOI] [PMC free article] [PubMed] [Google Scholar]
- Diehl AM, Chacon M, Wagner P. The effect of chronic ethanol feeding on ornithine decarboxylase activity and liver regeneration. Hepatology. 1988;8:237–242. doi: 10.1002/hep.1840080208. [DOI] [PubMed] [Google Scholar]
- Edenberg HJ, Bosron WF. Alcohol dehydrogenases. Comprehensive Toxicology. 2010;4:111–130. [Google Scholar]
- Edenberg HJ, Jerome RE, Li M. Polymorphism of the human alcohol dehydrogenase 4 (ADH4) promoter affects gene expression. Pharmacogenetics. 1999;9:25–30. doi: 10.1097/00008571-199902000-00004. [DOI] [PubMed] [Google Scholar]
- Edenberg HJ, Koller DL, Xuei X, Wetherill L, McClintick JN, Almasy L, Bierut LJ, Bucholz KK, Goate A, Aliev F, et al. Genome-wide association study of alcohol dependence implicates a region on chromosome 11. Alcohol Clin Exp Res. 2010;34:840–852. doi: 10.1111/j.1530-0277.2010.01156.x. [DOI] [PMC free article] [PubMed] [Google Scholar]
- Edenberg HJ, Xuei X, Chen HJ, Tian H, Wetherill LF, Dick DM, Almasy L, Bierut L, Bucholz KK, Goate A, et al. Association of alcohol dehydrogenase genes with alcohol dependence: a comprehensive analysis. Human Molecular Genetics. 2006;15:1539–1549. doi: 10.1093/hmg/ddl073. [DOI] [PubMed] [Google Scholar]
- Gabay C, Kushner I. Acute-phase proteins and other systemic responses to inflammation. N Engl J Med. 1999;340:448–454. doi: 10.1056/NEJM199902113400607. [DOI] [PubMed] [Google Scholar]
- Gong P, Cederbaum AI. Nrf2 is increased by CYP2E1 in rodent liver and HepG2 cells and protects against oxidative stress caused by CYP2E1. Hepatology. 2006;43:144–153. doi: 10.1002/hep.21004. [DOI] [PubMed] [Google Scholar]
- Hill SY, Shen S, Zezza N, Hoffman EK, Perlin M, Allan W. A genome wide search for alcoholism susceptibility genes. Am J Med Genet B Neuropsychiatr Genet. 2004;128B:102–113. doi: 10.1002/ajmg.b.30013. [DOI] [PMC free article] [PubMed] [Google Scholar]
- Itoh K, Chiba T, Takahashi S, Ishii T, Igarashi K, Katoh Y, Oyake T, Hayashi N, Satoh K, Hatayama I, et al. An Nrf2/small Maf heterodimer mediates the induction of phase II detoxifying enzyme genes through antioxidant response elements. Biochem Biophys Res Commun. 1997;236:313–322. doi: 10.1006/bbrc.1997.6943. [DOI] [PubMed] [Google Scholar]
- Itoh K, Wakabayashi N, Katoh Y, Ishii T, Igarashi K, Engel JD, Yamamoto M. Keap1 represses nuclear activation of antioxidant responsive elements by Nrf2 through binding to the amino-terminal Neh2 domain. Genes Dev. 1999;13:76–86. doi: 10.1101/gad.13.1.76. [DOI] [PMC free article] [PubMed] [Google Scholar]
- Ji C, Kaplowitz N. Betaine decreases hyperhomocysteinemia, endoplasmic reticulum stress, and liver injury in alcohol-fed mice. Gastroenterology. 2003;124:1488–1499. doi: 10.1016/s0016-5085(03)00276-2. [DOI] [PubMed] [Google Scholar]
- Kalsi G, Prescott CA, Kendler KS, Riley BP. Unraveling the molecular mechanisms of alcohol dependence. Trends Genet. 2009;25:49–55. doi: 10.1016/j.tig.2008.10.005. [DOI] [PubMed] [Google Scholar]
- Keshavarzian A, Holmes EW, Patel M, Iber F, Fields JZ, Pethkar S. Leaky gut in alcoholic cirrhosis: a possible mechanism for alcohol-induced liver damage. American Journal of Gastroenterology. 1999;94:200–207. doi: 10.1111/j.1572-0241.1999.00797.x. [DOI] [PubMed] [Google Scholar]
- Kharbanda KK, Mailliard ME, Baldwin CR, Beckenhauer HC, Sorrell MF, Tuma DJ. Betaine attenuates alcoholic steatosis by restoring phosphatidylcholine generation via the phosphatidylethanolamine methyltransferase pathway. J Hepatol. 2007;46:314–321. doi: 10.1016/j.jhep.2006.08.024. [DOI] [PubMed] [Google Scholar]
- Klouckova I, Hrncirova P, Mechref Y, Arnold RJ, Li TK, McBride WJ, Novotny MV. Changes in liver protein abundance in inbred alcohol-preferring rats due to chronic alcohol exposure, as measured through a proteomics approach. Proteomics. 2006;6:3060–3074. doi: 10.1002/pmic.200500725. [DOI] [PubMed] [Google Scholar]
- Lamle J, Marhenke S, Borlak J, von Wasielewski R, Eriksson CJ, Geffers R, Manns MP, Yamamoto M, Vogel A. Nuclear factor-eythroid 2-related factor 2 prevents alcohol-induced fulminant liver injury. Gastroenterology. 2008;134:1159–1168. doi: 10.1053/j.gastro.2008.01.011. [DOI] [PubMed] [Google Scholar]
- Lee YJ, Shukla SD. Histone H3 phosphorylation at serine 10 and serine 28 is mediated by p38 MAPK in rat hepatocytes exposed to ethanol and acetaldehyde. Eur J Pharmacol. 2007;573:29–38. doi: 10.1016/j.ejphar.2007.06.049. [DOI] [PMC free article] [PubMed] [Google Scholar]
- Linden D, William-Olsson L, Ahnmark A, Ekroos K, Hallberg C, Sjogren HP, Becker B, Svensson L, Clapham JC, Oscarsson J, et al. Liver-directed overexpression of mitochondrial glycerol-3-phosphate acyltransferase results in hepatic steatosis, increased triacylglycerol secretion and reduced fatty acid oxidation. FASEB J. 2006;20:434–443. doi: 10.1096/fj.05-4568com. [DOI] [PubMed] [Google Scholar]
- Mann RE, Smart RG, Govoni R. The Epidemiology of Alcoholic Liver Disease. Alcohol Res Health. 2003;23:209–219. [PMC free article] [PubMed] [Google Scholar]
- McClintick JN, Edenberg HJ. Effects of filtering by Present call on analysis of microarray experiments. BMC Bioinformatics. 2006;7:49. doi: 10.1186/1471-2105-7-49. [DOI] [PMC free article] [PubMed] [Google Scholar]
- McMahon M, Itoh K, Yamamoto M, Chanas SA, Henderson CJ, McLellan LI, Wolf CR, Cavin C, Hayes JD. The Cap’n’Collar basic leucine zipper transcription factor Nrf2 (NF-E2 p45-related factor 2) controls both constitutive and inducible expression of intestinal detoxification and glutathione biosynthetic enzymes. Cancer Res. 2001;61:3299–3307. [PubMed] [Google Scholar]
- Mieczkowski J, Tyburczy ME, Dabrowski M, Pokarowski P. Probe set filtering increases correlation between Affymetrix GeneChip and qRT-PCR expression measurements. BMC Bioinformatics. 2010;11:104. doi: 10.1186/1471-2105-11-104. [DOI] [PMC free article] [PubMed] [Google Scholar]
- Niemela O, Parkkila S, Pasanen M, Iimuro Y, Bradford B, Thurman RG. Early alcoholic liver injury: formation of protein adducts with acetaldehyde and lipid peroxidation products, and expression of CYP2E1 and CYP3A. Alcohol Clin Exp Res. 1998;22:2118–2124. doi: 10.1111/j.1530-0277.1998.tb05925.x. [DOI] [PubMed] [Google Scholar]
- Ohtake T, Saito H, Hosoki Y, Inoue M, Miyoshi S, Suzuki Y, Fujimoto Y, Kohgo Y. Hepcidin is down-regulated in alcohol loading. Alcohol Clin Exp Res. 2007;31:S2–8. doi: 10.1111/j.1530-0277.2006.00279.x. [DOI] [PubMed] [Google Scholar]
- Park PH, Lim RW, Shukla SD. Involvement of histone acetyltransferase (HAT) in ethanol-induced acetylation of histone H3 in hepatocytes: potential mechanism for gene expression. Am J Physiol Gastrointest Liver Physiol. 2005;289:G1124–1136. doi: 10.1152/ajpgi.00091.2005. [DOI] [PubMed] [Google Scholar]
- Park SH, Choi MS, Park T. Changes in the hepatic gene expression profile in a rat model of chronic ethanol treatment. Food Chem Toxicol. 2008;46:1378–1388. doi: 10.1016/j.fct.2007.08.029. [DOI] [PubMed] [Google Scholar]
- Pochareddy S, Edenberg HJ. Variation in the ADH1B proximal promoter affects expression. Chem Biol Interact. 2011;191:38–41. doi: 10.1016/j.cbi.2010.12.007. [DOI] [PMC free article] [PubMed] [Google Scholar]
- Poso H, Poso AR. Stabilization of tyrosine aminotransferase and ornithine decarboxylase in regenerating rat liver by ethanol treatment. FEBS letters. 1980;113:211–214. doi: 10.1016/0014-5793(80)80593-x. [DOI] [PubMed] [Google Scholar]
- Reich T, Edenberg HJ, Goate A, Williams JT, Rice JP, Van Eerdewegh P, Foroud T, Hesselbrock V, Schuckit MA, Bucholz K, et al. Genome-wide search for genes affecting the risk for alcohol dependence. Am J Med Genet. 1998;81:207–215. [PubMed] [Google Scholar]
- Rodriguez DA, Moncadaa C, Núñeza MT, Lavanderoc S, Ponnappad BC, Yedy Israel Y. Ethanol increases tumor necrosis factor-alpha receptor-1 (TNF-R1) levels in hepatic, intestinal, and cardiac cells. Alcohol. 2004;33:9–15. doi: 10.1016/j.alcohol.2004.03.001. [DOI] [PubMed] [Google Scholar]
- Seth D, Leo MA, McGuinness PH, Lieber CS, Brennan Y, Williams R, Wang XM, McCaughan GW, Gorrell MD, Haber PS. Gene expression profiling of alcoholic liver disease in the baboon (Papio hamadryas) and human liver. Am J Pathol. 2003;163:2303–2317. doi: 10.1016/S0002-9440(10)63587-0. [DOI] [PMC free article] [PubMed] [Google Scholar]
- Shukla SD, Aroor AR. Epigenetic effects of ethanol on liver and gastrointestinal injury. World J Gastroenterol. 2006;12:5265–5271. doi: 10.3748/wjg.v12.i33.5265. [DOI] [PMC free article] [PubMed] [Google Scholar]
- Siegmund SV, Brenner DA. Molecular pathogenesis of alcohol-induced hepatic fibrosis. Alcohol Clin Exp Res. 2005;29:102S–109S. doi: 10.1097/01.alc.0000189275.97419.58. [DOI] [PubMed] [Google Scholar]
- Tadic SD, Elm MS, Li HS, Van Londen GJ, Subbotin VM, Whitcomb DC, Eagon PK. Sex differences in hepatic gene expression in a rat model of ethanol-induced liver injury. J Appl Physiol. 2002;93:1057–1068. doi: 10.1152/japplphysiol.00568.2001. [DOI] [PubMed] [Google Scholar]
- Thurman RG. II. Alcoholic liver injury involves activation of Kupffer cells by endotoxin. Am J Physiol. 1998;275:G605–611. doi: 10.1152/ajpgi.1998.275.4.G605. [DOI] [PubMed] [Google Scholar]
- Tian H, Edenberg HJ. RSA Abstracts. Alcoholism: Clinical and Experimental Research. 2005;29:6A–172A. [Google Scholar]
- Treutlein J, Cichon S, Ridinger M, Wodarz N, Soyka M, Zill P, Maier W, Moessner R, Gaebel W, Dahmen N, et al. Genome-wide association study of alcohol dependence. Arch Gen Psychiatry. 2009;66:773–784. doi: 10.1001/archgenpsychiatry.2009.83. [DOI] [PMC free article] [PubMed] [Google Scholar]
- Villagra A, Cheng F, Wang HW, Suarez I, Glozak M, Maurin M, Nguyen D, Wright KL, Atadja PW, Bhalla K, et al. The histone deacetylase HDAC11 regulates the expression of interleukin 10 and immune tolerance. Nat Immunol. 2009;10:92–100. doi: 10.1038/ni.1673. [DOI] [PMC free article] [PubMed] [Google Scholar]
- Walker AP, Muscatelli F, Monaco AP. Isolation of the human Xp21 glycerol kinase gene by positional cloning. Hum Mol Genet. 1993;2:107–114. doi: 10.1093/hmg/2.2.107. [DOI] [PubMed] [Google Scholar]
- Wang JC, Grucza R, Cruchaga C, Hinrichs AL, Bertelsen S, Budde JP, Fox L, Goldstein E, Reyes O, Saccone N, et al. Genetic variation in the CHRNA5 gene affects mRNA levels and is associated with risk for alcohol dependence. Mol Psychiatry. 2009;14:501–510. doi: 10.1038/mp.2008.42. [DOI] [PMC free article] [PubMed] [Google Scholar]
- Xing Y, Stoilov P, Kapur K, Han A, Jiang H, Shen S, Black DL, Wong WH. MADS: a new and improved method for analysis of differential alternative splicing by exon-tiling microarrays. RNA. 2008;14:1470–1479. doi: 10.1261/rna.1070208. [DOI] [PMC free article] [PubMed] [Google Scholar]
- Yin HQ, Kim M, Kim JH, Kong G, Kang KS, Kim HL, Yoon BI, Lee MO, Lee BH. Differential gene expression and lipid metabolism in fatty liver induced by acute ethanol treatment in mice. Toxicol Appl Pharmacol. 2007;223:225–233. doi: 10.1016/j.taap.2007.06.018. [DOI] [PubMed] [Google Scholar]
- You M, Fischer M, Deeg MA, Crabb DW. Ethanol induces fatty acid synthesis pathways by activation of sterol regulatory element-binding protein (SREBP) J Biol Chem. 2002;277:29342–29347. doi: 10.1074/jbc.M202411200. [DOI] [PubMed] [Google Scholar]
- Zhang CL, McKinsey TA, Chang S, Antos CL, Hill JA, Olson EN. Class II histone deacetylases act as signal-responsive repressors of cardiac hypertrophy. Cell. 2002;110:479–488. doi: 10.1016/s0092-8674(02)00861-9. [DOI] [PMC free article] [PubMed] [Google Scholar]
Associated Data
This section collects any data citations, data availability statements, or supplementary materials included in this article.