Abstract
Focus cues are incorrect in conventional stereoscopic displays. This causes a dissociation of vergence and accommodation, which leads to visual fatigue and perceptual distortions. Multi-plane displays can minimize these problems by creating nearly correct focus cues. But to create the appearance of continuous depth in a multi-plane display, one needs to use depth-weighted blending: i.e., distribute light intensity between adjacent planes. Akeley et al. [ACM Trans. Graph. 23, 804 (2004)] and Liu and Hua [Opt. Express 18, 11562 (2009)] described rather different rules for depth-weighted blending. We examined the effectiveness of those and other rules using a model of a typical human eye and biologically plausible metrics for image quality. We find that the linear blending rule proposed by Akeley and colleagues [ACM Trans. Graph. 23, 804 (2004)] is the best solution for natural stimuli.
OCIS codes: (330.1400) Vision - binocular and stereopsis, (120.2040) Displays
1. Introduction
When a viewer looks from one point to another in the natural environment, he/she must adjust the eyes’ vergence (the angle between the lines of sight) such that both eyes are directed to the same point. He/she must also accommodate (adjust the eyes’ focal power) to guarantee sharp retinal images. The distances to which the eyes must converge and accommodate are always the same in the natural environment, so it is not surprising that vergence and accommodation responses are neurally coupled [1].
Stereoscopic displays create a fundamental problem for vergence and accommodation. A discrepancy between the two responses occurs because the eyes must converge on the image content (which may be in front of or behind the screen), but must accommodate to the distance of the screen (where the light comes from). The disruption of the natural correlation between vergence and accommodation distance is the vergence-accommodation conflict, and it has several adverse effects. (1) Perceptual distortions occur due to the conflicting disparity and focus information [2–4]. (2) Difficulties occur in simultaneously fusing and focusing a stimulus because the viewer must now adjust vergence and accommodation to different distances [4–8]; if accommodation is accurate, he/she will see the object clearly, but may see double images; if vergence is accurate, the viewer will see one fused object, but it may be blurred. (3) Visual discomfort and fatigue occur as the viewer attempts to adjust vergence and accommodation appropriately [4-5,7–9].
Several modifications to stereo displays have been proposed to minimize or eliminate the conflict [10–17]. One solution, schematized in the left panel of Fig. 1 , is to construct a set of image planes at different accommodation distances and align them appropriately for each eye individually so that the summed intensities from different planes create the desired retinal image. With appropriate alignment of each eye, the resulting multi-plane stereo display can create nearly correct focus cues; specifically, such a display can provide a stimulus to accommodate to the same distance as the vergence stimulus [18] thereby minimizing or eliminating the vergence-accommodation conflict. This has been shown to decrease perceptual distortions, improve visual performance, and reduce visual discomfort [4,9].
Fig. 1.
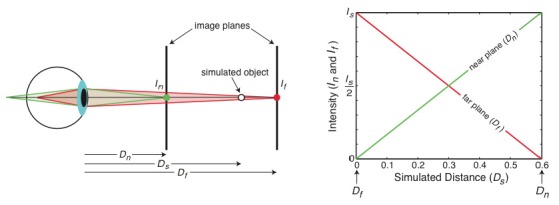
Multi-plane display and depth-weighted blending. Left panel: Parameters of multi-plane display. Two planes at distances in diopters of Dn and Df are used to display images to the eye. To simulate a distance Ds (also in diopters), a depth-weighted blending rule is used to determine the intensities In and If for the near and far image planes, respectively. The image points on those planes are aligned such that they sum on the viewer’s retina to create the desired intensity. The viewer’s eye is focused at some distance (not indicated) that affects the formation of the retinal images from the near and far planes. Right panel: The intensities In and If proscribed by the linear depth-weighted blending rule (Eq. (1) to simulate distance Ds (in diopters). The green and red lines represent respectively the intensities In and If.
An important issue arises in generating images for such multi-plane displays. For all but the very unlikely case that the distance of a point in the simulated scene coincides exactly with the distance of one of the image planes, a rule is required to assign image intensities to the planes. One rule is linear depth-weighted blending in which the image intensity at each focal plane is proportional to the distance in diopters of the point from that plane [6,17]. For an object with simulated intensity Is at dioptric distance Ds, the image intensities In and If at the planes that bracket Ds are:
| (1) |
where Dn and Df are the distances in diopters of the nearer and farther planes. The right panel of Fig. 1 plots the intensities In and If (normalized so their ranges are 0-1) to simulate different distances. With this rule, pixels representing an object at the dioptric midpoint between two focal planes are illuminated at half intensity on each of the two planes. The corresponding pixels on the two planes lie along a line of sight, so they sum in the retinal image to form an approximation of the image that would occur when viewing a real object at that distance. The sum of intensities is constant for all simulated distances (i.e., Is = In + If). The depth-weighted blending algorithm is crucial to simulating continuous 3D scenes without visible discontinuities between focal planes.
The main purpose of this paper is to examine the effectiveness of different blending rules. The choice of blending rule may well depend on what the display designer is trying to optimize. Although the primary application of multi-plane technology will probably be with stereo displays, we only consider monocular viewing in our analyses because the issues at hand concern only the perception of one eye’s image. We consider three criteria: 1) Producing the highest retinal-image contrast at the simulated distance assuming that the eye is focused precisely at that distance; 2) Producing the change in retinal-image contrast with change in accommodation that would best stimulate the eye’s accommodative response; 3) Producing images that look most like images in the real world.
Recently, Liu and Hua [16] asked whether the linear depth-weighted blending rule of Eq. (1) is the optimal blending rule, based on the first criterion above: i.e, optimization of contrast assuming the viewer is accommodated to the simulated distance. Their simulation of human optics and a multi-plane display and their estimation of contrast yielded a non-linear rule that differs significantly from the linear rule [6]. We conducted an analysis similar to theirs and we too observed deviations from the linear rule under some circumstances. But the deviations were never the ones Liu and Hua [16] reported. We went further by investigating how optical aberrations and neural filtering typical of human vision, as well as the statistics of natural images, influence the effectiveness of different blending rules. Our results show that the linear depth-weighted blending rule is an excellent compromise for general viewing situations.
2. The analysis by Liu and Hua (2010)
In their simulation, Liu and Hua [16] presented stimuli on two image planes separated by 0.6 diopters (D) to a model eye. They set the intensity ratio (I0.6 / (I0.6 + I0)) in the two planes from 0 to 1 in small steps. For each ratio, they adjusted the accommodative state of the model eye and calculated the area under the resulting modulation transfer function (MTF); the MTF is of course the retinal-image contrast divided by the incident contrast as a function of spatial frequency. Liu and Hua [16] then found the distance to which the eye would have to accommodate to maximize that area, arguing that this is equivalent to maximizing the contrast of the retinal image. Their eye was the Arizona Model Eye [19,20]. This is a multi-surface model with aberrations typical of a human eye. They did not specify the eye’s monochromatic aberrations, so we do not know its specific parameters. They also incorporated an achromatizing lens in their analysis, which eliminates the contribution of chromatic aberration.
Figure 2 re-plots the results from their Fig. 4, using the parameters of the fitted functions specified in their Table 2. Intensity ratio is plotted on the abscissa and accommodative distance that maximized the area of the MTF on the ordinate. This is the transpose of the axes in their figure. We chose to plot the results this way because it is more conventional to plot the independent variable on the abscissa and the dependent variable on the ordinate.
Fig. 2.
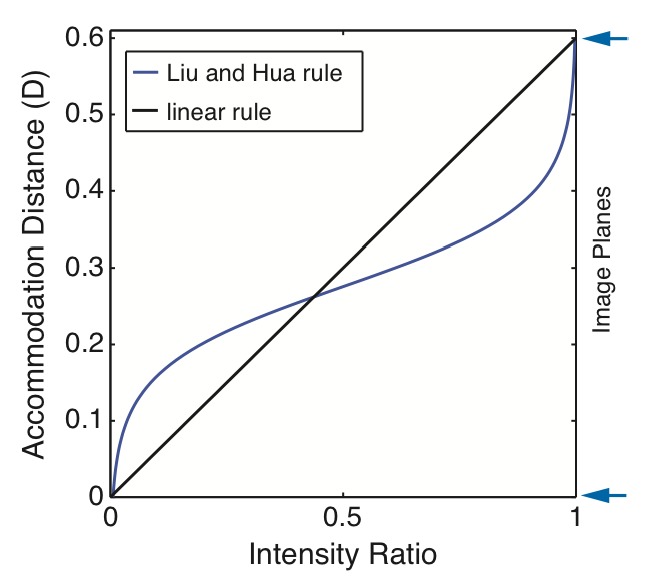
The results of Liu and Hua [16]. The accommodative distance that maximizes the area under the MTF is plotted as a function of the ratio of pixel intensities on two image planes, one at 0D and the other at 0.6D (indicated by arrows on right). The intensity ratio is I0.6 / (I0.6 + I0) where I0.6 and I0 are the intensities at the 0.6D and 0D planes, respectively. The black diagonal line represents the linear weighting rule. The blue curve represents Liu and Hua’s findings from Table 2 in their paper.
We repeated their analysis by first using a diffraction-limited eye with a 4mm pupil. Figure 3 shows how accommodative error affects retinal-image contrast of a monochromatic stimulus (550nm) presented to such an eye. The stimulus was positioned at 0D, and the model eye was defocused by various amounts relative to 0. The figure shows the well-known result that modulation transfer changes more slowly with defocus at low than at high spatial frequencies [6, 21].
Fig. 3.
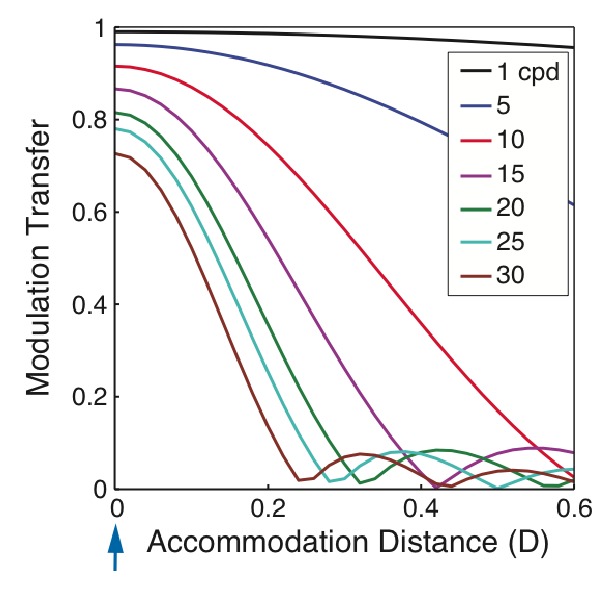
Modulation transfer as a function of accommodative distance for different spatial frequencies. The monochromatic (550nm) stimulus is presented on one plane at 0D. The eye is diffraction limited with a 4mm pupil. Different symbols represent different spatial frequencies. The position of the image plane is indicated by the arrow in the lower left.
If we present depth-weighted stimuli on two planes—one at 0D and another at 0.6D—and the eye accommodates in-between those planes, the resulting MTF is the weighted sum of MTFs from Fig. 3. The weights corresponding to the 0.6D and 0D planes are respectively r and 1-r, so the resulting MTF is:
| (2) |
where f is spatial frequency and M0(f) and M0.6(f) are the MTFs (given where the eye is focused) associated with the 0D and 0.6D planes.
Figure 4 plots the MTFs for two-plane, depth-weighted stimuli for various spatial frequencies and intensity ratios. At high spatial frequency (21 cpd), the greatest retinal contrast always occurs with accommodation at one of the image planes. For example, when the intensity on the 0D plane is greater than the intensity on the other plane, (i.e., the ratio is less than 0.5), contrast is maximized by accommodating to 0D. At low and medium spatial frequencies (4 and 9 cpd), however, the greatest contrast is often obtained with accommodation in-between the planes. For instance, when the intensity ratio is 0.5, accommodating halfway between the planes maximizes contrast; at lower ratios, the best accommodation distance drifts toward 0D.
Fig. 4.
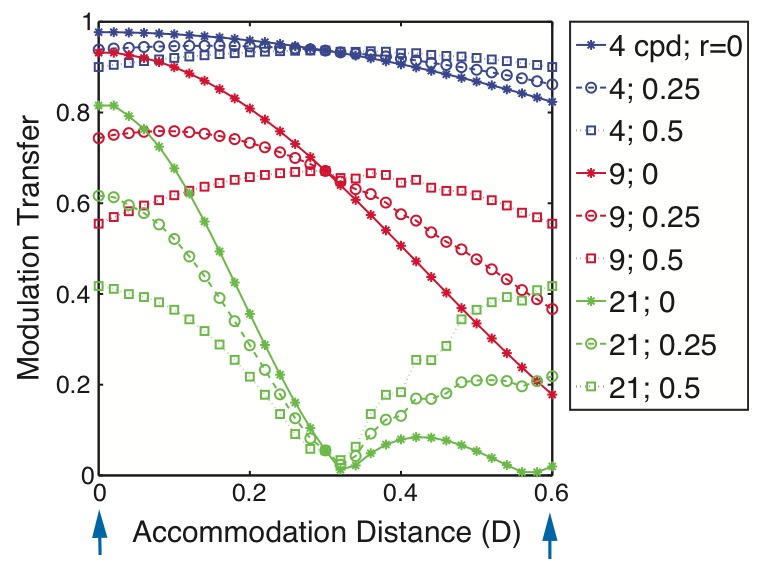
Modulation transfer as a function of accommodation distance for a two-plane display. The model eye is diffraction limited with a 4mm pupil. The stimulus is monochromatic (550nm). The planes are positioned at 0 and 0.6D (indicated by arrows). The intensity ratio and spatial frequency associated with each set of data are given in the legend.
We can use the information used to derive Fig. 4 to do the same analysis for a broadband stimulus. That is, we can find for each intensity ratio the accommodative distance that maximizes retinal-image contrast for a stimulus containing all spatial frequencies. To do this, however, one must define an image-contrast metric. Here we used, as Liu and Hua [16] did, the area under the MTF [16]. The broadband stimulus contained all spatial frequencies from 0 to 30 cpd at equal contrast (i.e., uniform spectrum) as it did in Liu and Hua [16]. We found the accommodative distance for each intensity ratio that yielded the greatest MTF area from 0 to 30 cpd. Figure 5 plots these results for different intensity ratios. For ratios of 0 and 0.25, greater intensity was presented on the 0D plane; MTF area was maximized by accommodating to that plane. For a ratio of 0.5, equal intensities were presented to the 0 and 0.6D planes; MTF area was maximized by accommodating to one or the other plane, not in-between. These results reveal a clear deviation from the linear rule. (It is important to reiterate that in this particular analysis we have followed Liu and Hua’s [16] assumption that the eye will accommodate to the distance that maximizes MTF area.)
Fig. 5.
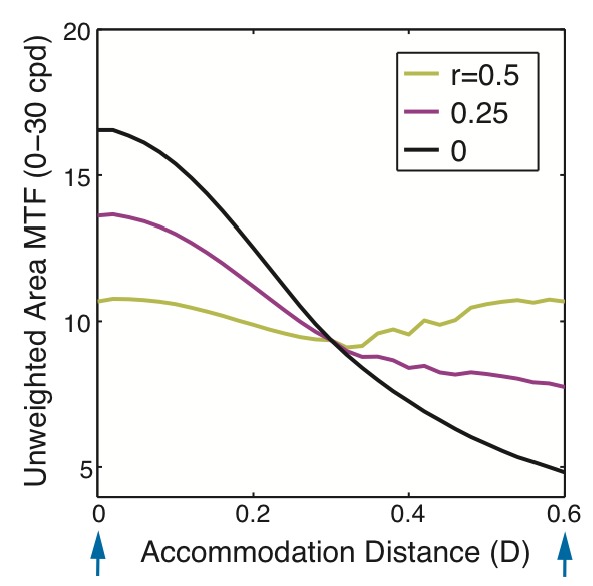
Area MTF as a function of accommodation distance for a two-plane display. The model eye is diffraction limited with a 4mm pupil. The stimulus is monochromatic (550nm) and contains all spatial frequencies at equal contrast from 0 to 30 cpd. The planes are positioned at 0 and 0.6 D (indicated by arrows). MTF area was calculated from 0 to 30cpd for intensity ratios of 0.5, 0.25, and 0.
From the information used to derive Figs. 4 and 5, we can now plot the results in the format of Fig. 2. Figure 6 shows the accommodative distance that maximizes retinal-image contrast for different spatial frequencies as a function of intensity ratio. At low and medium spatial frequencies (4 and 9cpd), the best accommodative distance is approximately a linear function of intensity ratio, consistent with the linear blending rule. However, at high spatial frequency (21cpd) and with the equal-amplitude broadband stimulus (0-30cpd), the best accommodative distance is always near one of the image planes. The optimal rule in those cases is approximately a box function, which is of course quite inconsistent with the linear blending rule. It is important to note, however, that the deviation from linearity is the opposite of what Liu and Hua observed [16] (Fig. 2). We do not have an explanation for why they got the opposite result, but we have tried many combinations of spatial frequencies and aberrated eyes and whenever we observe a deviation from linearity, it is always in the direction shown in Fig. 6.
Fig. 6.
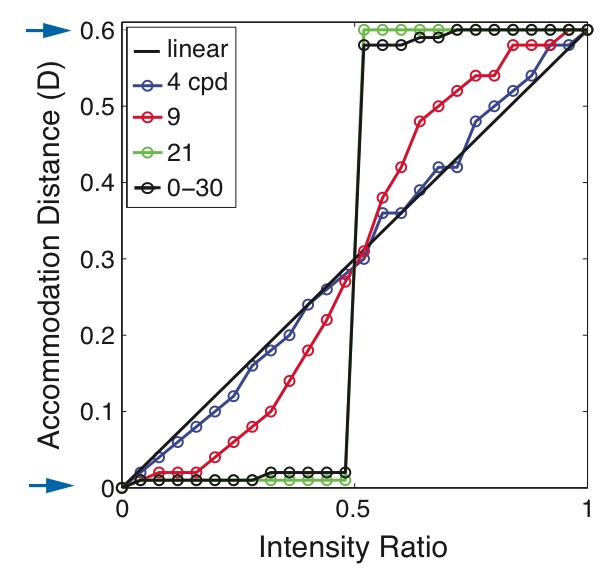
Accommodation distance that maximizes MTF area for each intensity ratio. The model eye is diffraction-limited with a 4mm pupil. The stimulus is monochromatic (550nm). The stimulus consisted of one spatial frequency at 4, 9, or 21cpd, or contained all spatial frequencies at equal contrast from 0 to 30 cpd. The image planes were positioned at 0 and 0.6D as indicated by the arrows.
One can gain an intuition for why best accommodative distance is biased toward an image plane in the following way. Represent modulation transfer as a function of defocus (i.e., the through-focus function in Fig. 3) with a Gaussian. The mean of the Gaussian occurs at the best focus and the standard deviation represents depth of focus. In the two-plane case, we need two Gaussians of equal standard deviation, one centered at the far plane (0D) and the other at the near plane (0.6D). Then in Eq. (2) we replace M0 and M0.6 with Gaussians and compute the weighted sum. When the standard deviations are small relative to the difference in the means (i.e., the depth of focus is small relative to the plane separation), the sum is bimodal with peaks at values near the means of the constituent functions. This occurs at high spatial frequencies where depth of focus is small (Fig. 3), so the sum is bimodal at such frequencies. Consequently, the best accommodative distance at high spatial frequencies is biased toward the more heavily weighted image plane. If the standard deviations of the Gaussians are large relative to the difference in their means (i.e., depth of focus is large relative to the plane separation), as occurs at low spatial frequencies, the weighted sum is unimodal with a peak at a value in-between the means of the constituents. Consequently, the best accommodative distance moves away from the image planes at low frequencies. Any smooth peaked through-focus function—such as the function measured in human eyes—yields this behavior.
We conclude that maximizing the overall MTF for an equal-amplitude broadband stimulus presented to a diffraction-limited eye is achieved by using a rule approximating a box function rather than a linear weighting rule. Said another way, the accommodation distance that maximizes MTF area with such broadband stimuli is generally strongly biased toward the plane with greater intensity. This result is ironically the opposite of the non-linear function reported by Liu and Hua [16]. They found that accommodation should be biased away from the plane with greater intensity, a result that is difficult to reconcile with our findings.
3. Typical optical aberrations, neural filtering, and natural-image statistics
The analysis by Liu and Hua [16], and the one we presented above, concluded that the optimal depth-weighted blending rule for a broadband stimulus is essentially the same as the optimal rule for a high-frequency stimulus. This is not surprising because a significant proportion of the MTF is above 9cpd, the medium spatial frequency we tested. However, psychophysical and physiological studies suggest that high spatial frequencies do not contribute significantly to human perception of blur [22,23] or to accommodative responses [18,24,25]. Thus, Liu and Hua’s [16] and our above analyses probably over-estimated the influence of high spatial frequencies. Given this, we next explored the consequences of making more biologically plausible assumptions about perceived image quality in multi-plane displays. In particular, we incorporated some important properties of human vision and of stimuli in the natural environment.
First, the aberrations of the model eyes used in Liu and Hua [16] and in our above analysis were less severe than those in typical eyes. The monochromatic aberrations in the Liu and Hua [16] eye were not specified. Furthermore, they did not incorporate chromatic aberrations because they included an achromatizing lens in their analysis. Of course, the diffraction-limited eye we used did not include typical monochromatic aberrations. And we used monochromatic light, so there was no image degradation due to chromatic aberration. We incorporated more biologically plausible assumptions about the eye’s optics in the analyses below.
Second, the analyses did not take into account the fact that the visual system has differential neural filtering. In both analyses, all spatial frequencies from 0 to 30cpd were given equal weight even though it is well known that high spatial frequencies are attenuated more in neural processing than are low and medium frequencies [21,27,28,29]. This filtering is summarized by the neural transfer function (NTF), which is the contrast of the effective neural image divided by retinal-image contrast as a function of spatial frequency (i.e., differential attenuation due to optics has been factored out). Figure 7 shows a typical NTF. We incorporated this in the analyses below.
Fig. 7.
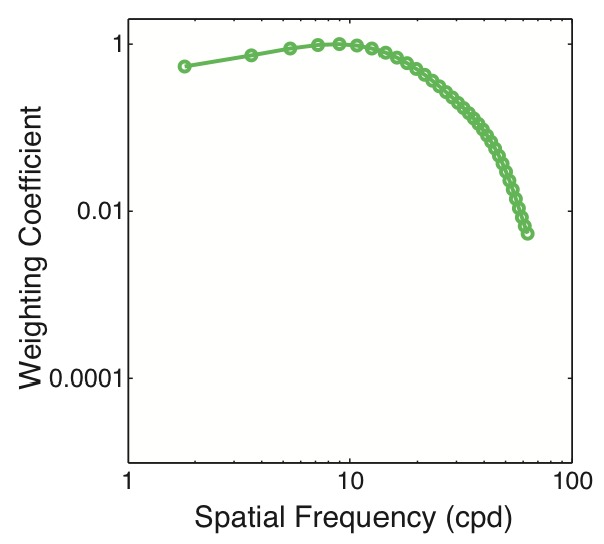
The neural transfer function (NTF). The NTF is the effective contrast of the neural image divided by retinal-image contrast at different spatial frequencies. Adapted from [21].
Third, the analyses did not consider some important properties of natural images. Both analyses used a stimulus of equal contrast from 0 to 30cpd even though the amplitude spectra of natural images are proportional to 1/f (where f is spatial frequency [30,–32]). We therefore used stimuli in the upcoming analyses that are consistent with natural images.
We incorporated these properties of human vision and natural stimuli, and re-examined the effectiveness of different blending rules. Specifically, the broadband stimulus was white and had an amplitude spectrum proportional to 1/f rather than a uniform spectrum. The model eye (Table 1 ) had typical chromatic and higher-order aberrations and therefore had much lower transfer at high spatial frequencies than the Arizona Model Eye [19] and the diffraction-limited eye [33]. The polychromatic MTF was derived from the luminance-weighted integral of monochromatic point-spread functions (PSFs). (Details of the polychromatic model that incorporates monochromatic and chromatic aberrations are described elsewhere [31].) Image quality and best focus for each spatial frequency and for broadband spatial stimuli, were assessed by computing the area under the product of the NTF and polychromatic MTF.
Table 1. Aberration Vector of Model Eye*.
| C3−3 | C3−1 | C3+1 | C3−3 | C4−4 | C4−2 | C40 | C4+2 | C4+4 |
|---|---|---|---|---|---|---|---|---|
| −0.0254 | 0.0556 | 0.0085 | 0.0179 | 0.0109 | −0.0105 | 0.0572 | −0.0037 | −0.0233 |
*The Zernike 3rd- and 4th-order coefficients for our model eye with a 4mm pupil at 555nm. The eye was chosen from the Indiana Aberration Study [26] and is representative of the population for a 5mm pupil [31]. The coefficients, in units of micron rms, were converted to a 4mm pupil for the current study.
The results with this biologically plausible model are shown in Fig. 8 . As before, the optimal depth-weighted blending rule is linear for low and medium spatial frequencies. Importantly, the optimal rule is also approximately linear for the natural broadband stimulus as well. We conclude that the linear rule is close to the optimal rule for presenting natural stimuli in a multi-plane display when the viewer has typical optics and neural filtering.
Fig. 8.
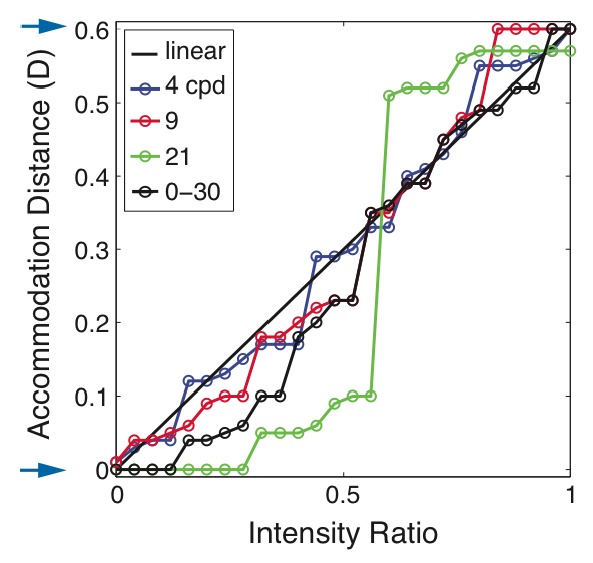
Accommodation distance that maximizes the area under the weighted MTF for each intensity ratio. The model eye is a typical human eye with a 4mm pupil. The stimulus is white. The stimulus consisted of one spatial frequency at 4, 9, or 21cpd, or contained all spatial frequencies from 0 to 30cpd with amplitudes proportional to 1/f. The image planes were positioned at 0 and 0.6D as indicated by the arrows.
4. Stimulus to accommodation
In our analysis so far, we followed Liu and Hua’s [16] assumption that the best depth-weighted blending rule is one that maximizes retinal-image contrast (criterion #1 in the introduction). However, we incorporated more biologically plausible optics, neural filtering, and stimuli. We now use a different criterion: the ability of the multi-plane stimulus to drive the eye’s accommodative response.
Accommodation is driven by contrast gradients: specifically, dC/dD where dC represents change in contrast and dD represents change in the eye’s focal distance [18,34]. If the gradient does not increase smoothly to a peak where the eye’s focal distance corresponds to the simulated distance in the display, it is unlikely that the eye will actually accommodate to the simulated distance. In this section, we examine how the gradient of retinal-image contrast depends on the depth-weighted blending rule.
We presented a white, broadband stimulus with a 1/f amplitude spectrum to the aberrated model eye described in Table 1. We incorporated the NTF of Fig. 7. The upper left panel in Fig. 9 shows the results when such a stimulus is presented in the real world; i.e., when not presented on a display. Different colors represent the results when the stimulus was presented at different distances. As the eye’s accommodation approaches the actual distance of the stimulus, retinal-image contrast increases smoothly to a peak. Maximum contrast occurs when the eye’s accommodative distance matches the simulated distance. This panel thus shows the gradient that normally drives accommodation. Accommodation should be reasonably accurate when the eye is presented such stimuli [18,34]. The other panels in Fig. 9 show the results for the same eye when the same broadband stimulus is presented on the 0 and 0.6D planes. Again different colors represent the results for stimuli presented at different simulated distances. The upper right panel shows the consequences of using the linear depth-weighted blending rule. For each simulated distance, image contrast increases smoothly as the eye’s accommodative distance approaches the simulated distance reaching a peak when the two distances are essentially the same. However, image contrast for the multi-plane stimulus is lower at 0.15, 0.3, and 0.45D than it is with natural viewing. The lower left and right panels show the consequences of using Liu and Hua’s [16] non-linear rule and the box rule, respectively. Again image contrast changes smoothly with changes in accommodation, but the maxima occur near the image planes rather than at the simulated distance. Thus, the linear rule provides a better stimulus to accommodation than the other rules because the maximum contrast occurs closer to the simulated distance with that rule than with Liu and Hua’s [16] and the box rule.
Fig. 9.
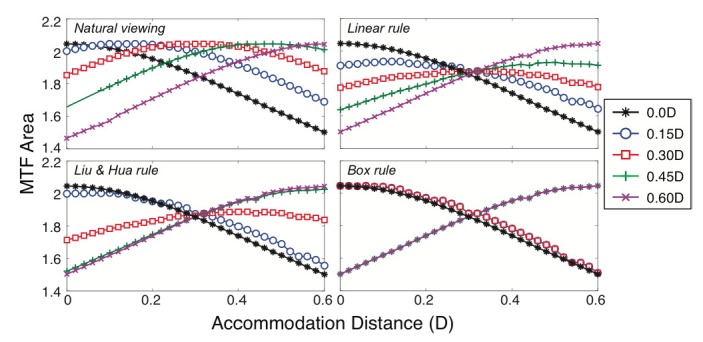
Contrast change as a function of accommodation change for different displays. Each panel plots the distance to which the eye is accommodated on the abscissa and the MTF area on the ordinate. Different colors represent different positions of the stimulus: black for 0D, blue for 0.15D, red for 0.3D, green for 0.45D, and purple for 0.6D. The parameters of the model eye are given in Table 1. Upper left: MTF area (a measure of retinal-image contrast) as a function of accommodation for a white, broadband stimulus with 1/f spectrum presented at five different distances in the real world. The function has been weighted by the NTF of Fig. 7. Upper right: Contrast as a function of accommodation for the same stimulus presented on a multi-plane display with the image planes at 0 and 0.6D and the linear, depth-weighted blending rule. Lower left: Contrast as a function of accommodation for the same stimulus using Liu and Hua’s non-linear blending rule [16]. Lower right: Contrast as a function of accommodation for the same stimulus using a box-function blending rule. The box rule assigned an intensity ratio of 0 for all simulated distances of 0-0.3D and of 1 for all simulated distances of 0.3-0.6D.
5. Appearance
We have concentrated so far on how accommodation affects the retinal-image contrast of a multi-plane stimulus and in turn on how a multi-plane stimulus might affect accommodative responses. We now turn to arguably the most important perceptual aspect of all: What the image looks like. Clearly it is desirable for any display to create retinal images that look like images produced by the real world.
When a real scene contains objects at different distances, the blur associated with the image of each object is directly related to the objects’ distances relative to where the eye is focused. An effective multi-plane display should recreate those relationships. We can quantify the blur with the PSF for different accommdative distances. If we ignore the small changes in aberrations that occur with changes in accommodation, the blur is only a function of the eye parameters and defocus in diopters (i.e., object distance minus accommodative distance). The retinal image of the object is given by the convolution of the object and PSF for the appropriate defocus:
| (3) |
where o is the luminance distribution of the object and p is the PSF, and x and y are horizontal and vertical image coordinates, respectively.
We analyzed image formation when the object is a thin line (a delta function) that is rotated about a vertical axis (and therefore increases in distance from left to right) and presented either as a real stimulus or on a multi-plane display. The nearest and farthest points on the line were at 0.6 and 0D, respectively. The model eye had the parameters provided in Table 1. We then calculated PSFs for each horizontal position on the line. From the PSFs, we computed Visual Strehl ratios [35] as a function of horizontal position on the line. The conventional Strehl ratio is a measure of optical image quality; it is the peak value of the PSF divided by the peak of the PSF for the well-focused, diffraction-limited eye. The Visual Strehl ratio includes differential neural attenuation as a function of spatial frequency (NTF, Fig. 7). Including neural attenuation is important in an assessment of perceptual appearance.
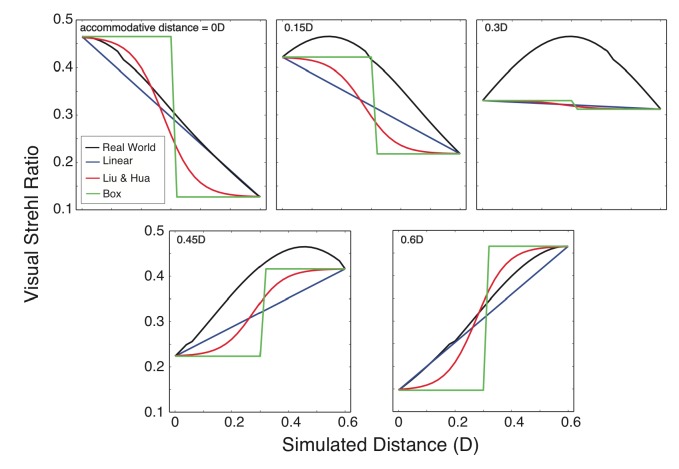
Figure 10 plots Visual Strehl ratio as a function of horizontal position for the four types of displays: the real world, and multi-plane displays with the linear blending rule, Liu and Hua’s rule [16], and a box-function rule. Different panels plot the ratios for different accommodative distances: from left to right, those distances are 0, 0.15, 0.3, 0.45, and 0.6D, where 0.6D corresponds to focusing on the near end of the line and 0D to focusing on the far end. None of the three rules provide a clearly better approximation to the real world. But it is important to note that the box rule and Liu and Hua’s non-linear rule [16] often produce steeper blur gradients (i.e., greater change in blur with position along the line) than the real world and those steep gradients will be quite visible. This is particularly evident when the eye is focused at either end of the line (0 and 0.6D). In those cases, the linear rule produces gradients that are similar to those in the real world. We conclude that the linear rule provides appearance that is as good as or slightly better than the Liu and Hua rule [16] and the box rule. It thus provides a reasonable approximation to the appearance of the real world.
Fig. 10.
Perceived optical quality for a thin white line receding in depth. We calculated Visual Strehl ratios (observed PSF peak divided by PSF peak for well-focused, diffraction-limited eye, where the PSFs have been weighted by the NTF [35]) for different horizontal positions along the line. Black, blue, red, and green symbols represent, respectively, the ratios for a real-world stimulus, a multi-plane stimulus with the linear blending rule, a multi-plane stimulus with Liu and Hua’s non-linear blending rule [16], and a multi-plane stimulus with a box-function rule. The panels show the results when the eye is accommodated to 0D (the far end of the line), 0.15, 0.3, 0.45, and 0.6D (the near end of the line). The parameters of the model eye are given in Table 1.
6. Summary and conclusions
We evaluated the effectiveness of different depth-weighted blending rules in a multi-plane display, including a linear rule described by Akeley and colleagues [4,6] and a non-linear rule described by Liu and Hua [16]. In evaluating effectiveness, we considered three criteria: 1) maximizing retinal-image contrast when the eye accommodates to the simulated distance; 2) providing an appropriate contrast gradient to drive the eye’s accommodative response; 3) appearance. We found some circumstances in which a non-linear rule provided highest retinal contrast, but the deviation from linearity was opposite to the one Liu and Hua [16] reported. When we incorporated typical optical aberrations and neural filtering, and presented natural stimuli, we found that the linear blending rule was clearly the best rule with respect to the first two criteria and was marginally the best with respect to the third criterion. We conclude that the linear rule is overall the best depth-weighted blending rule for multi-plane displays. As such displays become more commonplace, future work should examine how variation in optical aberrations of the eye, the amplitude spectrum of the stimulus, and the separation between the planes affect image quality, in particular the appearance of stimuli at different depths.
Acknowledgments
The study was funded by NIH ( RO1-EY 12851) to MSB. We thank Simon Watt and Ed Swann for comments on an earlier draft, David Hoffman for helpful discussions, and Larry Thibos for the aberration data from a typical subject.
References and links
- 1.Krishnan V. V., Phillips S., Stark L., “Frequency analysis of accommodation, accommodative vergence and disparity vergence,” Vision Res. 13(8), 1545–1554 (1973). 10.1016/0042-6989(73)90013-8 [DOI] [PubMed] [Google Scholar]
- 2.Frisby J. P., Buckley D., Duke P. A., “Evidence for good recovery of lengths of real objects seen with natural stereo viewing,” Perception 25(2), 129–154 (1996). 10.1068/p250129 [DOI] [PubMed] [Google Scholar]
- 3.Watt S. J., Akeley K., Ernst M. O., Banks M. S., “Focus cues affect perceived depth,” J. Vis. 5(10), 834–862 (2005). 10.1167/5.10.7 [DOI] [PMC free article] [PubMed] [Google Scholar]
- 4.Hoffman D. M., Girshick A. R., Akeley K., Banks M. S., “Vergence-accommodation conflicts hinder visual performance and cause visual fatigue,” J. Vis. 8(3), 33–, 1–30. (2008). 10.1167/8.3.33 [DOI] [PMC free article] [PubMed] [Google Scholar]
- 5.Wann J. P., Rushton S., Mon-Williams M., “Natural problems for stereoscopic depth perception in virtual environments,” Vision Res. 35(19), 2731–2736 (1995). 10.1016/0042-6989(95)00018-U [DOI] [PubMed] [Google Scholar]
- 6.Akeley K., Watt S. J., Girshick A. R., Banks M. S., “A stereo display prototype with multiple focal distances,” ACM Trans. Graph. 23(3), 804–813 (2004). 10.1145/1015706.1015804 [DOI] [Google Scholar]
- 7.Emoto M., Niida T., Okano F., “Repeated vergence adaptation causes the decline of visual functions in watching stereoscopic television,” J. Disp. Technol. 1(2), 328–340 (2005). 10.1109/JDT.2005.858938 [DOI] [Google Scholar]
- 8.Lambooij M., IJsselsteijn W., Fortuin M., Heynderickx I., “Visual discomfort and visual fatigue of stereoscopic displays: a review,” J. Imaging Sci. Technol. 53(3), 030201 (2009). 10.2352/J.ImagingSci.Technol.2009.53.3.030201 [DOI] [Google Scholar]
- 9.Shibata T., Kim J., Hoffman D. M., Banks M. S., “The zone of comfort: predicting visual discomfort with stereo displays,” J. Vis. 11(8), 1–29 (2011). 10.1167/11.8.11 [DOI] [PMC free article] [PubMed] [Google Scholar]
- 10.T. A. Nwodoth and S. A. Benton, “Chidi holographic video system,” in SPIE Proceedings on Practical Holography, 3956 (2000). [Google Scholar]
- 11.Favalora G. E., Napoli J., Hall D. M., Dorval R. K., Giovinco M. G., Richmond M. J., et al. , “100 million-voxel volumetric display,” Proc. SPIE 712, 300–312 (2002). 10.1117/12.480930 [DOI] [Google Scholar]
- 12.Schowengerdt B. T., Seibel E. J., “True 3-D scanned voxel displays using single or multiple light sources,” J. Soc. Inf. Disp. 14(2), 135–143 (2006). 10.1889/1.2176115 [DOI] [Google Scholar]
- 13.Suyama S., Date M., Takada H., “Three-dimensional display system with dual frequency liquid crystal varifocal lens,” Jpn. J. Appl. Phys. 39(Part 1, No. 2A), 480–484 (2000). [Google Scholar]
- 14.Sullivan A., “Depth cube solid-state 3D volumetric display,” Proc. SPIE 5291, 279–284 (2004). 10.1117/12.527543 [DOI] [Google Scholar]
- 15.Shibata T., Kawai T., Ohta K., Otsuki M., Miyake N., Yoshihara Y., Iwasaki T., “Stereoscopic 3-D display with optical correction for the reduction of the discrepancy between accommodation and convergence,” J. Soc. Inf. Disp. 13(8), 665–671 (2005). 10.1889/1.2039295 [DOI] [Google Scholar]
- 16.Liu S., Hua H., “A systematic method for designing depth-fused multi-focal plane three-dimensional displays,” Opt. Express 18(11), 11562–11573 (2010), http://www.opticsinfobase.org/abstract.cfm?URI=oe-18-11-11562 10.1364/OE.18.011562 [DOI] [PubMed] [Google Scholar]
- 17.Love G. D., Hoffman D. M., Hands P. J. W., Gao J., Kirby A. K., Banks M. S., “High-speed switchable lens enables the development of a volumetric stereoscopic display,” Opt. Express 17(18), 15716–15725 (2009), http://www.opticsinfobase.org/abstract.cfm?URI=oe-17-18-15716 10.1364/OE.17.015716 [DOI] [PMC free article] [PubMed] [Google Scholar]
- 18.MacKenzie K. J., Hoffman D. M., Watt S. J., “Accommodation to multiple-focal-plane displays: Implications for improving stereoscopic displays and for accommodation control,” J. Vis. 10(8), 1–20 (2010). 10.1167/10.8.22 [DOI] [PubMed] [Google Scholar]
- 19.Greivenkamp J. E., Schwiegerling J., Miller J. M., Mellinger M. D., “Visual acuity modeling using optical ray tracing of schematic eyes,” Am. J. Ophthalmol. 120(2), 227 240 (1995). [DOI] [PubMed] [Google Scholar]
- 20.Chen Y. L., Tan B., Lewis J. W. L., “Simulation of eccentric photorefraction images,” Opt. Express 11(14), 1628–1642 (2003), http://www.opticsinfobase.org/oe/abstract.cfm?URI=oe-11-14-1628 10.1364/OE.11.001628 [DOI] [PubMed] [Google Scholar]
- 21.Green D. G., Campbell F. W., “Effect of focus on the visual response to a sinusoidally modulated spatial stimulus,” J. Opt. Soc. Am. A 55(9), 1154–1157 (1965). 10.1364/JOSA.55.001154 [DOI] [Google Scholar]
- 22.Granger E. M., Cupery K. N., “Optical merit function (SQF), which correlates with subjective image judgments,” Photogr. Sci. Eng. 16, 221–230 (1972). [Google Scholar]
- 23.Georgeson M. A., May K. A., Freeman T. C. A., Hesse G. S., “From filters to features: scale-space analysis of edge and blur coding in human vision,” J. Vis. 7(13), 7–, 1–21. (2007). 10.1167/7.13.7 [DOI] [PubMed] [Google Scholar]
- 24.Owens D. A., “A comparison of accommodative responsiveness and contrast sensitivity for sinusoidal gratings,” Vision Res. 20(2), 159–167 (1980). 10.1016/0042-6989(80)90158-3 [DOI] [PubMed] [Google Scholar]
- 25.Mathews S., Kruger P. B., “Spatiotemporal transfer function of human accommodation,” Vision Res. 34(15), 1965–1980 (1994). 10.1016/0042-6989(94)90026-4 [DOI] [PubMed] [Google Scholar]
- 26.Thibos L. N., Hong X., Bradley A., Cheng X., “Statistical variation of aberration structure and image quality in a normal population of healthy eyes,” J. Opt. Soc. Am. A 19(12), 2329–2348 (2002). 10.1364/JOSAA.19.002329 [DOI] [PubMed] [Google Scholar]
- 27.Williams D. R., “Visibility of interference fringes near the resolution limit,” J. Opt. Soc. Am. A 2(7), 1087–1093 (1985). 10.1364/JOSAA.2.001087 [DOI] [PubMed] [Google Scholar]
- 28.Banks M. S., Geisler W. S., Bennett P. J., “The physical limits of grating visibility,” Vision Res. 27(11), 1915–1924 (1987). 10.1016/0042-6989(87)90057-5 [DOI] [PubMed] [Google Scholar]
- 29.J. H. van Hateren and A. van der Schaaf, “Temporal properties of natural scenes,” Proceedings of the IS&T/SPIE: 265 Human Vision and Electronic Imaging pp.139–143 (1996). [Google Scholar]
- 30.Field D. J., Brady N., “Visual sensitivity, blur and the sources of variability in the amplitude spectra of natural scenes,” Vision Res. 37(23), 3367–3383 (1997). 10.1016/S0042-6989(97)00181-8 [DOI] [PubMed] [Google Scholar]
- 31.Ravikumar S., Thibos L. N., Bradley A., “Calculation of retinal image quality for polychromatic light,” J. Opt. Soc. Am. A 25(10), 2395–2407 (2008). 10.1364/JOSAA.25.002395 [DOI] [PubMed] [Google Scholar]
- 32.Williams D. R., Yoon G. Y., Porter J., Guirao A., Hofer H., Cox I., “Visual benefit of correcting higher order aberrations of the eye visual benefit of correcting higher order aberrations of the eye,” J. Refract. Surg. 16(5), S554–S559 (2000). [DOI] [PubMed] [Google Scholar]
- 33.Yoon G. Y., Williams D. R., “Visual performance after correcting the monochromatic and chromatic aberrations of the eye,” J. Opt. Soc. Am. A 19(2), 266–275 (2002). 10.1364/JOSAA.19.000266 [DOI] [PubMed] [Google Scholar]
- 34.Charman W. N., Tucker J., “Accommodation as a function of object form,” Am. J. Optom. Physiol. Opt. 55(2), 84–92 (1978). [DOI] [PubMed] [Google Scholar]
- 35.Thibos L. N., Hong X., Bradley A., Applegate R. A., “Accuracy and precision of objective refraction from wavefront aberrations,” J. Vis. 4(4), 329–351 (2004). 10.1167/4.4.9 [DOI] [PubMed] [Google Scholar]


