

Abstract
A mechanism-based pharmacokinetic-pharmacodynamic (PK/PD) model was developed for exendin-4 to account for receptor-mediated endocytosis via glucagon-like peptide 1 receptor (GLP-1R) as the primary mechanism for its nonlinear disposition. Time profiles of exendin-4 concentrations after intravenous, subcutaneous, and continuous intravenous infusion doses in rats, intravenous and subcutaneous doses in monkeys, and intravenous infusion and subcutaneous doses in humans were examined. Mean data for glucose and insulin after glucose challenges during exendin-4 treatment in healthy rats were analyzed. The PK model components included receptor binding, subsequent internalization and degradation, nonspecific tissue distribution, and linear first-order elimination from plasma. The absorption rate constant (ka) decreased with increasing doses in all three species. The clearance from the central compartment (CLc) (rats, 3.62 ml/min; monkeys, 2.39 ml · min−1 · kg−1; humans, 1.48 ml · min−1 · kg−1) was similar to reported renal clearances. Selected PK parameters (CLc, Vc, and koff) correlated allometrically with body weight. The equilibrium dissociation constant (KD) was within the reported range in rats (0.74 nM), whereas the value in monkeys (0.12 pM) was much lower than that in humans (1.38 nM). The effects of exendin-4 on the glucose-insulin system were described by a feedback model with a biphasic effect equation driven by free exendin-4 concentrations. Our generalized nonlinear PK/PD model for exendin-4 taking into account of drug binding to GLP-1R well described PK profiles after various routes of administration over a large range of doses in three species along with PD responses in healthy rats. The present model closely reflects underlying mechanisms of disposition and dynamics of exendin-4.
Introduction
Exendin-4 is a 39-amino acid glucagon-like peptide 1 (GLP-1) analog, sharing approximately 53% sequence identity with mammalian GLP-1 (Doyle and Egan, 2007). Exendin-4 binds to pancreatic GLP-1 receptors (GLP-1R) to exhibit antidiabetic actions, including glucose-dependent stimulation of insulin secretion, suppression of glucagon secretion, slowing of gastric emptying, satiety, and in preclinical models, protection of β-cells. In addition to the pancreas, GLP-1Rs are also expressed in various tissues such as brain, lung, and kidneys (Körner et al., 2007).
The disposition of exendin-4 in humans has been reported as linear over the therapeutic dose range from 5 to 10 μg (Cvetković and Plosker, 2007). However, the pharmacokinetics (PK) of exendin-4 was reported as nonlinear in monkeys (Ai et al., 2008). In addition, the Bateman function could not describe the concentration-time profiles over certain ranges of doses in rats with one set of elimination parameter values (Gedulin et al., 2008), suggesting that the PK in rats may also be nonlinear. Furthermore, the simple Bateman function does not well represent the underlying mechanism of exendin-4 disposition, such as receptor binding and internalization. The major route of exendin-4 elimination was suggested to be glomerular filtration with subsequent enzyme degradation (Copley et al., 2006). However, in rats with kidneys surgically removed, exendin-4 slowly disappeared from the system (Parkes et al., 2001a), indicating the existence of nonrenal clearance. Because GLP-1Rs exist in various tissues and after binding to exendin-4, exendin-4-GLP-1R complexes are internalized and targeted for further degradation, we reasoned that receptor-mediated endocytosis and degradation may be responsible for the nonrenal clearance and the observed nonlinear behavior of exendin-4.
A general model for drugs exhibiting target-mediated drug disposition (TMDD) exists (Mager and Jusko, 2001). After administration, drug can be distributed to the peripheral compartment, directly eliminated, or bind to receptors. The drug-receptor complexes can be eliminated or dissociated to free receptors. The TMDD model uses receptor binding and receptor-mediated endocytosis as the primary mechanism of nonlinear drug disposition. We successfully captured the disposition of exendin-4 in diabetic rats using the TMDD model (Gao and Jusko, 2011). However, the PK of exendin-4 in other species has not been assessed using mechanistic modeling.
In general, the in vivo pharmacological effects of exendin-4 have been evaluated either qualitatively or by comparing empirical measures such as the area under the plasma glucose and insulin concentration-time curves. Mechanism-based PK/pharmacodynamic (PK/PD) models can provide improved insights into drug actions. Mager et al. (2004) characterized the effects of exendin-4 on glucose-insulin homeostasis under hyperglycemic clamping with a mechanism-based PD model but used a hypothetical linear PK function.
We sought to carefully analyze exendin-4 disposition and effects using a mechanism-based PK/PD modeling approach in various species. This study characterizes the disposition of exendin-4 after doses of intravenous, subcutaneous, or intravenous infusion in rats, monkeys, and humans using a TMDD PK/PD model to describe the insulinotropic effects of exendin-4.
Materials and Methods
The time profiles of exendin-4 concentrations in rats and humans were obtained from studies conducted by Amylin Pharmaceuticals, Inc. (San Diego, CA). The mean concentrations of exendin-4 in monkeys were captured by computer digitization from a previous publication (Ai et al., 2008). For the model fittings, all concentration data were converted to picomole per liter units, and drug doses were converted to total moles using the molecular weight of exendin-4 of 4186.6.
In the rat PK study, male Sprague-Dawley (SD) rats (350–370 g b.wt., n = 4–7) received exendin-4 via three different routes—intravenous, continuous intravenous infusion, and subcutaneous bolus—at three doses: 0.5, 5, and 50 nmol (bolus injection) and at 0.5, 5, and 50 nmol/h (intravenous infusion). Samples were assayed using a two-site sandwich assay developed at Amylin Pharmaceuticals, Inc. The minimal detectable concentration of exendin-4 was 15 pM.
In another study, male SD rats (80–420 g b.wt., n = 4–8) were infused intravenously using the same volume of saline or exendin-4 at 3, 30, 300, and 3000 pmol · kg−1 · min−1 for 2 h. At 30 min after beginning the infusion, d-glucose (5.7 mmol/kg) was injected intravenously at a rate of 0.5 ml/min over 2 to 3 min. Plasma glucose was determined by immobilized oxidase chemistry on a YSI 2300 Stat Plus (YSI Inc., Yellow Springs, OH), and insulin was determined by radioimmunoassay (Linco Research, St. Charles, MO).
In the monkey PK study (Ai et al., 2008), male rhesus monkeys (4.3 ± 0.7 kg b.wt., n = 3) were given either a single subcutaneous injection of 1, 3, or 10 μg/kg or a single intravenous injection of 3 μg/kg. Serum exendin-4 concentrations were measured using a radioimmunoassay. The linear range of this assay was 25 to 2000 pg/ml, and the limit of quantitation of was 25 pg/ml.
Data from three human studies were included in the current analysis. In study A (Kolterman et al., 2005), eight subjects (88.5 ± 9.4 kg b.wt.) received 0.1, 0.2, 0.3, or 0.4-μg/kg subcutaneous doses of exendin-4. In study B (Kolterman et al., 2005), eight subjects (88.8 ± 12.1 kg b.wt.) received single subcutaneous doses of 0.02, 0.05, or 0.1 μg/kg. In study C (Degn et al., 2004), 11 subjects (21–29 kg/m2 body mass index) received an intravenous infusion of exendin-4 at 0.066 pmol · kg−1 · min−1 (0.276 ng · kg−1 · min−1) for 360 min. Plasma exendin-4 concentrations were measured by Amylin Pharmaceuticals, Inc. using an immunoenzymetric assay.
Pharmacokinetic Model.
For initial data evaluation, mean profiles of exendin-4 for each intravenous dose obtained from rats were used to perform a noncompartmental analysis (NCA) and curve fitting to a biexponential equation (C = C1 · e−λ1 · t + C2 · e−λ2 · t) using WinNonlin 5.0 (Pharsight, Mountain View, CA) to evaluate dose-dependent changes in clearance (CL), steady-state volume of distribution (Vss), and distributional clearance (CLD).
For the next stage, a mechanism-based modeling approach was used for data analysis. The general scheme of the applied PK/PD model is presented in Fig. 1. The free exendin-4 (C) in plasma can bind to GLP-1R (R) with a second-order rate constant (kon) to form drug-receptor complex (RC), distribute to and from tissues (AT) by first-order rates (kpt and ktp), and be directly eliminated (kel). The RC can dissociate at a first-order rate (koff) and be internalized and degraded (kint). The GLP-1R (R) is assumed to remain constant (Rtot). The TMDD PK model can be described by eqs. 1 to 3:
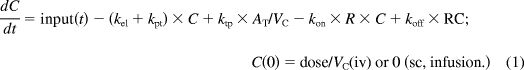 |
where VC represents the volume of the free exendin-4 (central) compartment.
Fig. 1.

Scheme of the target-mediated PK/PD model for exendin-4. Symbols are defined in the text and tables.
The input function for eq. 1 after subcutaneous doses is as follows:
where ka is the first-order absorption rate constant and F is the absolute bioavailability after subcutaneous doses.
Pharmacodynamic Model.
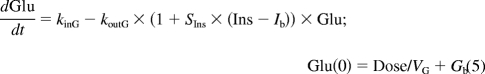
The PD model proposed for insulinotropic effects of exendin-4 is shown in Fig. 1. The basic structure, the feedback model, represents the interregulated interaction between glucose and insulin: glucose (Glu) stimulates insulin secretion with a linear stimulation factor SGlu, and insulin (Ins) stimulates glucose uptake with a linear stimulation factor SIns. The homeostasis of glucose and insulin was described by two indirect response models: koutG and koutI are the first-order output rate constants, and kinG and kinI are the zero-order input rate constants with the relationship of kinG = koutG·Gb and kinI = koutI·Ib, where Gb and Ib are the basal glucose and insulin concentrations.
For initial evaluation, the simple feedback model was fitted to all the paired glucose and insulin profiles. All of the parameter estimates were comparable between dose groups, except for parameter SGlu. The next step was to apply the feedback model to glucose and insulin profiles for all rats, only allowing SGlu to change among the dose groups.
For the next stage, a mechanism-based PK/PD modeling approach was used for data analysis. Drug concentrations were simulated using the TMDD PK model and parameter values from the PK study. The PK driving function enhances glucose-dependent stimulation of insulin secretion by the biphasic Adair function (Sd). Equations 5 to 7 show the feedback model for glucose and insulin concentrations:
 |
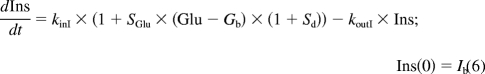 |
where Smax is the maximal stimulation factor of the response and k1 and k2 are constants in the Adair function. The baseline conditions Gb and Ib were fixed as the measured predose values.
Using RC (eq. 8) as the driving function for the effects of exendin-4 was also tested:
All computer fittings and simulations were performed using ADAPT II (Biomedical Simulations Resource, University of Southern California, Los Angeles, CA) with the maximal likelihood method. The variance model was Vi = (σ1+ σ2 × Y)2, where Vi is the variance of the ith data point, σ1 and σ2 are the variance model parameters, and Yi represents the ith model predicted value.
Results
Pharmacokinetics.
The TMDD model has been used to capture exendin-4 disposition in diabetic rats (Gao and Jusko, 2011) and adequately described exendin-4 PK in rats, monkeys, and humans in this report. As shown in the model scheme (Fig. 1), the TMDD model consists of target-binding (kon, koff), internalization and degradation of the receptor complex (kint), nonspecific tissue distribution (AT), and a linear elimination pathway (kel) from Vc.
Rat PK.
The mean exendin-4 concentration-time profiles after various doses in rats are shown in Fig. 2. The PK profiles show biexponential decline with typical characteristics of TMDD where low doses showed rapid decline in early times after intravenous injection and after stopping the intravenous infusion. After intravenous injection, terminal half-lives ranged from 20 to 40 min with increasing doses. The NCA results from the mean profiles of exendin-4 are summarized in Table 1. Slope parameters λ1, λ2, and CL decreased with increasing exendin-4 doses. In general, because of the limited target-binding capacity, drugs exhibiting TMDD show saturable distribution, with a decrease in apparent distribution parameters (CLD and Vss) with increasing doses. However, this trend was observed in CLD but not in Vss for exendin-4 in rats. GLP-1Rs are widely expressed in nonpancreatic tissues, and these receptors may also contribute as binding sites for exendin-4, thus making changes in Vss not evident. In addition, the apparent steady-state concentrations (Css) resulting from continuous infusion were not dose-proportional. After subcutaneous injection, terminal half-lives were 120 to 200 min, indicating involvement of flip-flop kinetics.
Fig. 2.

Exendin-4 concentration versus time profiles after single intravenous (iv) and s.c. doses of 0.5, 5, and 50 nmol and continuous iv infusion at doses of 0.5, 5, and 50 nmol/h in rats. Symbols are mean drug concentrations with error bars representing S.E. (n = 4–7), and solid lines are fitted profiles.
TABLE 1.
Parameters obtained from NCA analysis of concentration-time profiles in rats
Parameters λ1, λ2, CL, Vss, and CLD were calculated from mean profiles after intravenous bolus, and Dose/Css was calculated from mean profiles after continuous intravenous infusion.
| Intravenous Bolus |
Intravenous Infusion |
||||||
|---|---|---|---|---|---|---|---|
| Dose | λ1 | λ2 | CL | Vss | CLD | Dose | Dose/Css |
| nmol | min−1 | min−1 | ml/min | ml | ml/min | nmol/h | ml/min |
| 0.5 | 0.297 | 0.0363 | 4.99 | 44.8 | 1.08 | 0.5 | 7.25 |
| 5 | 0.133 | 0.0240 | 3.40 | 57.3 | 0.751 | 5 | 4.42 |
| 50 | 0.137 | 0.0174 | 3.39 | 68.2 | 0.818 | 50 | 3.17 |
To detect and properly quantify nonlinearities in PK, a wide range of drug doses is required. In humans, disposition of exendin-4 has been described as linear over a narrow dose range, and the nonlinearity might also be hidden by flip-flop kinetics after subcutaneous injection. Straightforward evidence of nonlinear kinetics in rats was the lack of dose-proportionality of NCA parameters and Css resulting from continuous infusion (Table 1).
Early blood sampling is particularly important to capture binding characteristics of drugs with the general TMDD model, and concentrations around the KD value are desired. In the rat study, data were available from 5 min after intravenous bolus dosing and via various administration routes, and observed concentrations ranged widely around the KD value.
All parameters were estimated (Table 2) with reasonable precision (<50% except for koff). The clearance (CLc = kel × Vc) is 3.62 ml/min, which is very close to the reported renal clearance (3.44 ml/min) (Parkes et al., 2001a). The equilibrium dissociation constant KD (= koff/kon = 0.74 nM) is in the range of the reported values for specific binding of exendin-4 and GLP-1 to normal rat tissues (Göke et al., 1993, 1995; Larsen et al., 1997; Satoh et al., 2000). The total receptor concentrations (Rtot) were estimated to be 5.21 nM for SD rats. The internalization rate constant was slightly higher than kel. Bioavailability was estimated as close to 1 and then fixed as 1 in the final model. The absorption rate constant in rats decreased with increasing dose.
TABLE 2.
Parameter estimates obtained from the time profiles of exendin-4 in rats with the TMDD model
| Parameter | Definition | Estimate |
|---|---|---|
| CV% | ||
| kel, min−1 | Elimination rate constant | 0.0839 (10) |
| kpt, min−1 | Intercompartmental rate constant | 0.0282 (15) |
| ktp min−1 | Intercompartmental rate constant | 0.0213 (5) |
| Vc, ml | Central volume of distribution | 43.2 (12) |
| kon, nM−1 · min−1 | Second-order binding constant | 0.0207 (42) |
| koff, min−1 | First-order dissociation constant | 0.0153 (206) |
| kint, min−1 | Internalization rate constant | 0.0966 (38) |
| ka1, min−1 | Absorption rate constant at 0.5 nmol | 0.00820 (9) |
| ka2, min−1 | Absorption rate constant at 5 nmol | 0.00579 (11) |
| ka3, min−1 | Absorption constant at 50 nmol | 0.00273 (11) |
| F | Bioavailability | 1 (fixed) |
| Rtot, nmol/l | Total receptor concentration | 5.21 (5) |
Monkey PK.
The fitted profiles of exendin-4 in monkeys after various intravenous and subcutaneous doses are presented in Fig. 3, and parameter estimates are listed in Table 3. The model well described monkey PK profiles and yielded parameter estimates with reasonable CV%, except for parameters related to the drug-receptor complex (kon, koff, and kint). The value of CLc was 2.39 ml · kg−1 · min−1, within the range of glomerular filtration rate (GFR) in healthy monkeys (2.2–3.6 ml · kg−1 · min−1) (Altaian and Dittmer, 1974). The KD value in monkeys was 0.12 pM, which is 5000-fold lower than that estimated in rats. The internalization rate constant in monkeys was 15 times lower than kel. Bioavailability was around 70%, and the absorption rate constant decreased with dose, as observed in rats.
Fig. 3.

Exendin-4 concentration versus time profiles after single intravenous (iv) and s.c. doses of 1, 3, and 10 μg/kg in monkeys. Symbols are mean drug concentrations with error bars representing S.E. (n = 3), and solid lines are fitted profiles.
TABLE 3.
Parameter estimates of exendin-4 in monkeys and man based on the TMDD model
| Parameter | Definition | Monkeys | Humans |
|---|---|---|---|
| CV% | |||
| kel, min−1 | Elimination rate constant | 0.0346 (10) | 0.013 (198) |
| kpt, min−1 | Intercompartmental rate constant | 0.0143 (17) | 0.0685 (262) |
| ktp, min−1 | Intercompartmental rate constant | 0.00593 (17) | 0.0846 (168) |
| Vc, ml/kg | Central volume of distribution | 69.3 (12) | 111 (168) |
| kon, pM−1 · min−1 | Second-order binding constant | 0.272 (607) | 0.000411 (351) |
| koff, min−1 | First-order dissociation constant | 0.0326 (2990) | 0.566 (399) |
| kint, min−1 | Internalization rate constant | 0.00211 (179) | 0.00342 (587) |
| ka, min−1 | Absorption rate constant for various dose groups | 0.0244–0.0142 (10–14) | 0.00550–0.0148 (14–17) |
| F | Bioavailability | 0.688 (8) | 1 (fixed) |
| Rtot, pM | Total receptor concentration | 60.6 (33) | 1240 (fixed) |
Human PK.
The model-predicted time profiles of exendin-4 in three human studies are shown in Fig. 4, and parameter estimates are listed in Table 3. The TMDD model adequately described the PK profiles from the three studies but was unable to estimate total receptor content (Rtot); thus, this parameter was fixed as a computer generalized value of 1.24 nM. This value is 3.2-fold lower than the Rtot estimate in rats, which agrees with one observation where rat receptor density in lung and thyroid gland was 2- to 5.5-fold that of human receptor density (Körner et al., 2007). Because concentrations only after subcutaneous doses and one continuous intravenous infusion dose were available, we were not surprised that parameters were estimated with generally high CV%, especially for kon, koff, and kint. The CLc was 1.48 ml · min−1 · kg−1, almost identical to the GFR in healthy subjects (125 ml/min in a 70-kg human). Bioavailability was fixed at 1, and the absorption rate constants were lower at higher doses, as was also found in other species. A population modeling approach with more extensive data would improve these parameter estimates.
Fig. 4.

Exendin-4 concentration versus time profiles after single subcutaneous doses (top, study A; middle, study B) and iv infusion (bottom, study C) in humans. Symbols are mean drug concentrations with error bars representing S.E (n = 7–8), and solid lines are fitted profiles.
Pharmacodynamics.
Increases of glucose and insulin after glucose challenge during continuous infusion of exendin-4 in rats are shown in Fig. 5. Because no drug concentrations were measured in this study, the drug PK profiles (Fig. 6, top) were simulated according to the TMDD model and parameter values. Exendin-4 almost (>80%) reached steady state after 30 min of infusion, at which time glucose was injected.
Fig. 5.

Time profiles of glucose (left) and insulin (right) concentrations in rats during saline (A) or drug [3 (B), 30 (C), 300 (D), and 3000 (E) pmol · kg−1 · min−1] infusions with glucose bolus challenge at 30 min. Symbols are mean concentrations with error bars representing S.E. (n = 4–8), and solid lines are fitted profiles.
Fig. 6.

Simulated exendin-4 concentration profiles at various infusion rates in the PD study (top) and the relationship between SGlu estimates and exendin-4 concentration at 30 min after the start of drug infusions (bottom).
The next step was to evaluate the appropriateness of the feedback model describing the glucose and insulin physiological system in rats. The model reasonably characterized the glucose and insulin profiles, and all parameters, except SGlu, had similar values between control and other dose groups. Therefore, the feedback model well represents the glucose-insulin system in rats. The initial analysis also showed that drug treatment affected only SGlu, the stimulation factor of glucose on insulin production, which was in agreement with the mechanism of action of exendin-4 on beta cells. Thus, in the next step of modeling, all rats shared the same set of parameters, but SGlu was allowed to change. As shown in Fig. 6, bottom, the estimated SGlu values first increased and then decreased with drug concentrations at the time of glucose challenge (C30min). The Adair function (Adair, 1923) was able to characterize the bell-shaped relationship between SGlu and C30min, and Fig. 6, top, depicts the fitted curve with this function.
The drug-RC was also tested as the driving force for PD. The model fitted the concentration profiles well but failed to generate precise parameters (ADAPT II was not able to provide CV% for parameter estimates). In addition, AIC values also favored C as the driving force. On the other hand, the PD study design did not contain enough information to differentiate the driving force of the PD effect, because both C and RC reached apparent steady states by the time of glucose injection. In addition, in a rat study conducted in our laboratory, maximal insulin stimulation occurred before maximal RC, indicating that the PD effect was better driven by C (Gao and Jusko, 2011).
In the final PK/PD model, the plasma concentrations (C) were used to stimulate insulin release (eq. 7). As shown in Fig. 5, the present integrated PK/PD model adequately characterized glucose and insulin. Parameters controlling glucose and insulin metabolism were estimated with good precision (<80%) and were comparable with literature values. The kout values for glucose and insulin were 0.046 and 0.483 min−1, corresponding to half-lives of 15 and 1.5 min, respectively. The estimated Smax was 4.67, and k1 and k2 were 0.826 nM and 0.0153 nM−1, respectively.
Discussion
Exendin-4, a potent GLP-1R agonist, exhibits insulinotropic effects in a variety of animal models and humans. This study, to our knowledge, is the first instance of applying a mechanistic model to quantify the disposition of exendin-4 in various species and the dynamics of exendin-4 in healthy rats. The general TMDD model delineating receptor-mediated drug disposition was proposed to characterize the nonlinear kinetic behavior across species. The likely mechanism of action was integrated into an existing model of the glucose-insulin system, thereby facilitating the simultaneous analysis of glucose and insulin responses to glucose challenge and drug effects.
Pharmacokinetics.
The binding of exendin-4 to GLP-1R can be saturated at high ligand doses, which contributes to the saturable clearance of exendin-4, although this has not been experimentally quantified. We reported that exendin-4 followed TMDD kinetics in Goto-Kakizaki (GK) diabetic rats (Gao and Jusko, 2011). In general, the parameter estimates were similar between SD rats (in the current report) and GK rats. Comparisons of the two rat strains were described previously (Gao and Jusko, 2011).
The primary elimination route of exendin-4 has been proposed as glomerular filtration, and kel physiologically represents renal elimination (Copley et al., 2006). The linear CLc in rats, monkeys, and humans was very close to reported renal clearances or GFR in healthy species. In rats, the relative contribution of CLc to the total clearance was approximately 73% at the lowest dose and nearly 100% at the highest doses. The Vc in the three species was larger than plasma (serum in monkeys) volume. Simple allometry was assessed for various parameters. Figure 7 shows the correlation between selected PK parameters (CLc, Vc, and koff) and body weights. The allometric exponents for CLc and koff are close to 0.75, and that for Vc is close to 1, similar to typical theoretical values. As was observed for type I interferon PK (Kagan et al., 2010), other PK parameters did not show a meaningful trend with body weight.
Fig. 7.

The relationship of estimated values of ka versus dose (A) and selected PK parameters [CLc (B), Vc (C), and koff (D)] versus body weight in rats, monkeys, and humans.
The GLP-1R undergoes endocytosis, and in the presence of agonist, the receptor cycles between the plasma membrane and endosomal compartment. The internalization of rat GLP-1R was examined in cell lines, with kon as 0.082 l/min−1 · nM−1 and koff as 0.015 and 0.21 min−1 (Widmann et al., 1995). Our estimated kon was approximately 4 times lower than these measured values, and koff was identical to the lower value, which resulted in a KD value (0.74 nM) comparable to that reported previously (Göke et al., 1995; Larsen et al., 1997; Satoh et al., 2000). The internalization half-life was 7 min (0.693/kint) longer than the reported 2 to 3 min. The discrepancy could be due to the difference between in vivo and in vitro experiments. According to the authors, parts of the receptors continuously recycle back to the cell surface with a half-life of 15 min, without involvement of newly synthesized protein in a significant manner. This process was also handled in the model by using a fixed total receptor concentration (Rtot) without a production and degradation process. However, the fraction of recycled GLP-1R was not considered in the current model. The average expression level of the receptors was 14.8 pM/g (5.206 nM/350 g) tissue assuming receptors were evenly distributed throughout the tissues. Göke et al. (1995) reported the binding sites of exendin-4 on the posterior lobe of rat pituitary as 7.8 pM/g tissue, similar to our estimates, especially considering that other tissues (e.g., islets, intestine) may have higher GLP-1R density (Körner et al., 2007).
Different values of KD for exendin-4 in animals and humans have been reported depending on whether a single class or two binding sites were assumed and the cell lines tested. Our estimated human KD (1.38 nM) was higher than the reported value of 0.82 nM for GLP-1 binding to human pituitary membranes (Satoh et al., 2000). The rat and human GLP-1R exhibit 95% amino acid homology and are 90% identical (Doyle and Egan, 2007), and the KD value in rats is 53% of the values in humans. The KD in monkeys was 0.01% of the other two species and was close to the lower KD of exendin-4 binding to the rat posterior lobe (Göke et al., 1995). Nevertheless, kon and koff in monkeys and humans are not precisely estimated.
Pharmacodynamics.
The PD component of the model reflects the stimulation of insulin secretion by exendin-4. Exendin-4 has to distribute to pancreas and bind to GLP-1R to stimulate insulin release. However, pancreatic GLP-1R is mostly expressed on the surface of the beta cells facing the endothelium (Tornehave et al., 2008), and distribution would be quite fast; therefore, a biophase between plasma and pancreas is unnecessary.
One can argue that exendin-4 stimulates insulin secretion by binding to pancreatic GLP-1R and then initiating receptor-mediated signaling pathways. However, in the final PK/PD model, the plasma concentration (C), rather than drug-RC, was found to work better as the driving force for exendin-4 insulinotropic effects. Mathematically, if the effect is driven by C (eq. 7), the transduction between receptor binding and effect is assumed as linear. If the effect is initiated by RC (eq. 8), the transduction between receptor binding and the effect is implied as nonlinear.
Direct evidence supporting eq. 7 over eq. 8 came from our observations in GK rats (Gao and Jusko, 2011). After an intravenous bolus of exendin-4, insulin peaked before the maximal concentrations of RC. Moreover, because pancreatic GLP-1Rs are mostly expressed on the surface of the beta cells (Tornehave et al., 2008), exendin-4 can bind to the receptor quite fast and directly stimulate insulin release. Furthermore, binding in other tissues besides pancreas might account for a large portion of drug-receptor complexes.
The basic structure of the PD model represents the feedback mechanism between glucose and insulin. This model uses the most simplistic mechanism and functions adequately in various situations. In general, the final estimated parameters controlling glucose and insulin regulation (Table 4) are in accordance with literature values (Jin and Jusko, 2009).
TABLE 4.
Parameter estimates obtained from the glucose and insulin profiles after intravenous glucose challenge during saline or exendin-4 infusions in rats using the TMDD PK/PD model
| Parameter | Definition | Estimate |
|---|---|---|
| CV% | ||
| koutG, 1/min | Glucose elimination rate constant | 0.046 (9) |
| koutI, 1/min | Insulin elimination rate constant | 0.483 (50) |
| SIns, nM−1 | Stimulation factor of insulin on glucose disposal | 0.157 (46) |
| SGlu, mM−1 | Stimulation factor of glucose on insulin secretion | 0.0684 (20) |
| Vg, l/kg | Glucose apparent volume of distribution | 0.208 (5) |
| Smax | Maximal response factor | 4.67 (30) |
| k1, nM | First receptor binding constant | 0.826 (71) |
| k2, nM−1 | Second receptor binding constant | 0.0153 (69) |
The likely mechanism of action of exendin-4 was integrated into the feedback model using Sd as shown in eq. 7. The stimulation of exendin-4 on insulin secretion is glucose-dependent (Doyle and Egan, 2007). Only when glucose concentrations are higher than a certain threshold is the insulinotropic effect evident. This phenomenon was also observed in the rat study: glucose and insulin concentrations did not change during the first 30 min of exendin-4 infusion. This dependence was modeled as the difference of glucose over basal concentrations. When glucose is not higher than basal values, the effect is shut off. The dose-response relationship of exendin-4 both in vitro (Parkes et al., 2001b) and in vivo was reported as a bell-shaped curve. Consistent with the initial PD analysis, SGlu increased with dose until 300 pmol · kg−1 · min−1 and then dropped to a lower value at 3000 pmol · kg−1 · min−1. The exact reason for this bell-shaped dose-response relationship is not clear, but the Adair function adequately captured the relationship between SGlu and plasma concentrations at 30 min (Fig. 6, top). Subsequently, the Adair function was directly incorporated into the feedback model to form the PK/PD model. According to the simulations (Fig. 8), maximal insulin secretion with this experimental design would be reached at an infusion rate of 120 pmol · kg−1 · min−1.
Fig. 8.

Simulated insulin responses (picomoles) after glucose challenge with various exendin-4 infusion rates according to the PK/PD model.
Because the Adair function was originally proposed to characterize multiple binding sites on a single receptor, there might be a possibility that a second exendin-4 molecule can bind to the exendin-4-GLP-1R complex, probably when the complex is recycled back to the cell surface. It may be feasible to express the pancreatic GLP-1R as some portion of the total receptor pool and the insulinotropic effect proportional to 1:1 drug-receptor complex. To be more mechanistic, the 1:1 complex can be internalized or dissociated to free receptor with the first dissociation rate constant (k1) or interact with another exendin-4 molecule with the second dissociation rate constant (k2).
Other mathematical functions might also describe the bell-shaped dose-response relationship, such as a hypothetical antagonist effect generated by exendin-4. However, physiologically, this is not detected in rats, and mathematically, more parameters in the model would lead to over-parameterization. Therefore, the simple Adair function is reasonable for modeling the insulinotropic effects of exendin-4.
In conclusion, a mechanistic TMDD PK/PD model was developed that provides quantitative insights into the in vivo PK properties of exendin-4 in various species and the in vivo PD properties in healthy rats. Plasma clearance and volume of distribution followed simple allometric scaling principles across species. The integrated PK/PD model was exemplified using data from healthy rats and well described glucose and insulin response profiles. This model may prove useful in future animal and clinical studies of exendin-4 and other GLP-1 derivatives.
Acknowledgments
We thank Brenda Cirincione for reviewing this manuscript. Rat and human data were provided by Amylin Pharmaceuticals, Inc.
This work was supported by the National Institutes of Health National Institute of General Medical Sciences [Grant GM57980].
Article, publication date, and citation information can be found at http://dmd.aspetjournals.org.
- GLP-1
- glucagon-like peptide 1
- GLP-1R
- GLP-1 receptor
- PK
- pharmacokinetics
- TMDD
- target-mediated drug disposition
- PD
- pharmacodynamics
- SD
- Sprague-Dawley
- NCA
- noncompartmental analysis
- GFR
- glomerular filtration rate
- GK
- Goto-Kakizaki
- RC
- receptor complex
- AIC
- Akaike's information criterion.
Authorship Contributions
Participated in research design: Gao and Jusko.
Conducted experiments: Gao.
Performed data analysis: Gao.
Wrote or contributed to the writing of the manuscript: Gao and Jusko.
References
- Adair GS. (1923) On the Donnan Equilibrium and the Equation of Gibbs. Science 58:13. [DOI] [PubMed] [Google Scholar]
- Ai G, Chen Z, Shan C, Che J, Hou Y, Cheng Y. (2008) Single- and multiple-dose pharmacokinetics of exendin-4 in rhesus monkeys. Int J Pharm 353:56–64 [DOI] [PubMed] [Google Scholar]
- Altaian PL, Dittmer DS. (1974) Renal function test: vertebrates, in Biology Data Book, 2nd ed, vol 3, pp 562–572, Federation of the American Societies for Experimental Biology, Bethesda [Google Scholar]
- Copley K, McCowen K, Hiles R, Nielsen LL, Young A, Parkes DG. (2006) Investigation of exenatide elimination and its in vivo and in vitro degradation. Curr Drug Metab 7:367–374 [DOI] [PubMed] [Google Scholar]
- Cvetković RS, Plosker GL. (2007) Exenatide: a review of its use in patients with type 2 diabetes mellitus (as an adjunct to metformin and/or a sulfonylurea). Drugs 67:935–954 [DOI] [PubMed] [Google Scholar]
- Degn KB, Brock B, Juhl CB, Djurhuus CB, Grubert J, Kim D, Han J, Taylor K, Fineman M, Schmitz O. (2004) Effect of intravenous infusion of exenatide (synthetic exendin-4) on glucose-dependent insulin secretion and counterregulation during hypoglycemia. Diabetes 53:2397–2403 [DOI] [PubMed] [Google Scholar]
- Doyle ME, Egan JM. (2007) Mechanisms of action of glucagon-like peptide 1 in the pancreas. Pharmacol Ther 113:546–593 [DOI] [PMC free article] [PubMed] [Google Scholar]
- Gao W, Jusko WJ. (2011) Pharmacokinetic and pharmacodynamic modeling of exendin-4 in type 2 diabetic Goto-Kakizaki rats. J Pharmacol Exp Ther 336:881–890 [DOI] [PMC free article] [PubMed] [Google Scholar]
- Gedulin BR, Smith PA, Jodka CM, Chen K, Bhavsar S, Nielsen LL, Parkes DG, Young AA. (2008) Pharmacokinetics and pharmacodynamics of exenatide following alternate routes of administration. Int J Pharm 356:231–238 [DOI] [PubMed] [Google Scholar]
- Göke R, Fehmann HC, Linn T, Schmidt H, Krause M, Eng J, Göke B. (1993) Exendin-4 is a high potency agonist and truncated exendin-(9–39)-amide an antagonist at the glucagon-like peptide 1-(7–36)-amide receptor of insulin-secreting beta-cells. J Biol Chem 268:19650–19655 [PubMed] [Google Scholar]
- Göke R, Larsen PJ, Mikkelsen JD, Sheikh SP. (1995) Identification of specific binding sites for glucagon-like peptide-1 on the posterior lobe of the rat pituitary. Neuroendocrinology 62:130–134 [DOI] [PubMed] [Google Scholar]
- Jin JY, Jusko WJ. (2009) Pharmacodynamics of glucose regulation by methylprednisolone. II. Normal rats. Biopharm Drug Dispos 30:35–48 [DOI] [PMC free article] [PubMed] [Google Scholar]
- Kagan L, Abraham AK, Harrold JM, Mager DE. (2010) Interspecies scaling of receptor-mediated pharmacokinetics and pharmacodynamics of type I interferons. Pharm Res 27:920–932 [DOI] [PMC free article] [PubMed] [Google Scholar]
- Kolterman OG, Kim DD, Shen L, Ruggles JA, Nielsen LL, Fineman MS, Baron AD. (2005) Pharmacokinetics, pharmacodynamics, and safety of exenatide in patients with type 2 diabetes mellitus. Am J Health Syst Pharm 62:173–181 [DOI] [PubMed] [Google Scholar]
- Körner M, Stöckli M, Waser B, Reubi JC. (2007) GLP-1 receptor expression in human tumors and human normal tissues: potential for in vivo targeting. J Nucl Med 48:736–743 [DOI] [PubMed] [Google Scholar]
- Larsen PJ, Tang-Christensen M, Holst JJ, Orskov C. (1997) Distribution of glucagon-like peptide-1 and other preproglucagon-derived peptides in the rat hypothalamus and brainstem. Neuroscience 77:257–270 [DOI] [PubMed] [Google Scholar]
- Mager DE, Abernethy DR, Egan JM, Elahi D. (2004) Exendin-4 pharmacodynamics: insights from the hyperglycemic clamp technique. J Pharmacol Exp Ther 311:830–835 [DOI] [PMC free article] [PubMed] [Google Scholar]
- Mager DE, Jusko WJ. (2001) General pharmacokinetic model for drugs exhibiting target-mediated drug disposition. J Pharmacokinet Pharmacodyn 28:507–532 [DOI] [PubMed] [Google Scholar]
- Parkes D, Jodka C, Smith P, Nayak S, Rinehart L, Gingerich R, Chen K, Young A. (2001a) Pharmacokinetic actions of exendin-4 in the rat: comparison with glucagon-like peptide-1. Drug Dev Res 53:260–267 [Google Scholar]
- Parkes DG, Pittner R, Jodka C, Smith P, Young A. (2001b) Insulinotropic actions of exendin-4 and glucagon-like peptide-1 in vivo and in vitro. Metabolism 50:583–589 [DOI] [PubMed] [Google Scholar]
- Satoh F, Beak SA, Small CJ, Falzon M, Ghatei MA, Bloom SR, Smith DM. (2000) Characterization of human and rat glucagon-like peptide-1 receptors in the neurointermediate lobe: lack of coupling to either stimulation or inhibition of adenylyl cyclase. Endocrinology 141:1301–1309 [DOI] [PubMed] [Google Scholar]
- Tornehave D, Kristensen P, Rømer J, Knudsen LB, Heller RS. (2008) Expression of the GLP-1 receptor in mouse, rat, and human pancreas. J Histochem Cytochem 56:841–851 [DOI] [PMC free article] [PubMed] [Google Scholar]
- Widmann C, Dolci W, Thorens B. (1995) Agonist-induced internalization and recycling of the glucagon-like peptide-1 receptor in transfected fibroblasts and in insulinomas. Biochem J 310 (Pt 1):203–214 [DOI] [PMC free article] [PubMed] [Google Scholar]