Abstract
(−)Pantoprazole [(−)PAN] accumulated in rat milk stereoselectively, and this accumulation was attributed to rat Abcg2 (rAbcg2). In contrast, flux experiments at 25 μM showed that (+)pantoprazole [(+)PAN] was preferentially transported by rAbcg2. The purpose of the current study was to comprehensively evaluate the transport of PAN isomers in empty-Madin-Darby canine kidney II (MDCKII) and MDCKII cells expressing the human/rat (ABCG2/rAbcg2) isoforms at concentrations ranging from 3 to 200 μM. The apical-to-basolateral and basolateral-to-apical directional flux and the asymmetry efflux ratios were virtually identical for both isomers in empty (mock transfected)-MDCKII monolayers but were concentration dependent for both isomers in ABCG2 (human/rat)-MDCKII. Kinetic analysis using predicted cellular concentrations showed that (−)PAN had an 8-fold lower KM compared with (+)PAN for both rAbcg2 (0.25 versus 1.85 μM) and ABCG2 (0.6 versus 5.32 μM). (+)PAN had a 3-fold higher TMax compared with the (−)PAN for both rAbcg2 (7.86 versus 2.49 nmol/h · cm2) and ABCG2 (10.2 versus 3.29 nmol/h · cm2). Effective ABCG2 surface-area permeability of (−)PAN was 9920 and 5480 (μl/h)/cm2 for rAbcg2 and ABCG2, respectively, compared with the (+)PAN isomer (4250 and 1920 μl/h · cm2, respectively). These results indicate a stereoselective interaction of PAN with similar kinetic parameters for both human and rat ABCG2. (−)PAN is a better substrate than (+)PAN for ABCG2/rAbcg2 and provide a rationale for the preferential accumulation of (−)PAN into rat milk.
Introduction
Efflux transporters, such as ABCB1, ABCC2, and ABCG2, are localized in numerous tissues throughout the body and play important roles in drug absorption, distribution, metabolism, and excretion (Giacomini et al., 2010). These transporters can be major determinants of the pharmacokinetic, efficacy and safety profiles of drugs. Flux across a polarized cell monolayer, such as Caco-2 or Madin-Darby canine kidney II (MDCKII) cell line overexpressing transporters have become one of the more popular in vitro methods to characterize substrate-transporter interactions (Balimane et al., 2004; Balimane and Chong, 2005). However, a mechanistic understanding and quantitative description of transport or inhibition data from Transwell plates remains limited (Kalvass and Pollack, 2007; Sun and Pang, 2008).
ABCG2 is expressed on the apical surface of lactating mammary epithelial cells (Jonker et al., 2005) and facilitates the accumulation of substrate drugs in milk, including nitrofurantoin, cimetidine, topotecan, acyclovir, dietary carcinogens, ranitidine, and ciprofloxicin (Oo et al., 1995, 2001; McNamara et al., 1996; Gerk et al., 2001; Jonker et al., 2005; Merino et al., 2005, 2006; van Herwaarden et al., 2007; Vlaming et al., 2009). Although diffusion plays a major role in drug appearance in milk, ABCG2 clearly contributes to the accumulation of its substrates in milk. Pantoprazole (PAN) is an ABCG2 substrate, and yet, one clinical report indicated that it has a very low milk-to-serum (M/S) ratio (Plante et al., 2004). There is no clear rationale for such a low ratio for a good ABCG2 substrate.
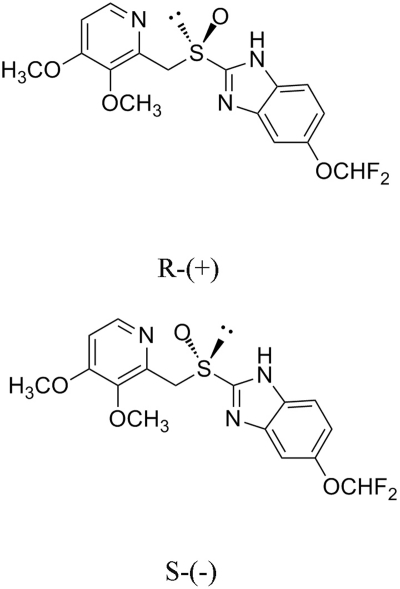
PAN is marketed as a racemic mixture (Fig. 1), and differences in the overall disposition of the two isomers have been reported both in man (Tanaka et al., 2001) and in rats (Xie et al., 2005). In a companion article (Wang and McNamara, 2012), the disposition of PAN isomers in rat milk was explored and revealed a clear stereoselective difference associated with rat (rAbcg2). Milk-to-serum ratio of (−)PAN was 2.5-fold greater than that of (+)PAN, and the M/S of (−)PAN was affected to a greater degree by the administration of GF120918 [N-(4-[2-(1,2,3,4-tetrahydro-6,7-dimethoxy-2-isoquinolinyl)ethyl]-phenyl)-9,10-dihydro-5-methoxy-9-oxo-4-acridine carboxamide] than the M/S of (+)PAN. In contrast, in vitro experiments suggested that the rate of (+)PAN flux across a rAbcg2-MDCKII monolayer was greater than (−)PAN at a donor concentration of 25 μM, which is lower than the previously reported Km estimated using Transwell flux experiments (Breedveld et al., 2004). The main purpose of this article is to fully explore this apparent contradiction by characterizing the transport of PAN isomers in monolayers consisting of rAbcg2 and human ABCG2 overexpressing MDCKII cells. The first objective was to describe differences in the interaction between PAN isomers and rAbcg2/ABCG2. The second objective was to examine any interspecies difference between rAbcg2 and ABCG2. In analysis of these data, a functional model was developed to quantify kinetic parameters for flux experiments involving an apical efflux pump.
Fig. 1.
The structure of PAN isomers.
Materials and Methods
Chemicals and Materials.
PAN (pantoprazole) mixture (50:50) was purchased from Wyeth Pharmaceuticals Inc. (Princeton, NJ), and the isomers of PAN were a gift from Altana Pharma AG (Konstanz, Germany). Cell culture mediums were obtained from Invitrogen (Carlsbad, CA). All of the organic solvents [high-performance liquid chromatography (HPLC) grade] were purchased from Thermo Fisher Scientific (Waltham, MA), and all other chemicals were obtained from Sigma-Aldrich (St. Louis, MO) unless specified.
Overexpressing rAbcg2/ABCG2 in MDCK-II cell lines were used in the transport studies. The establishment of rat Abcg2 or empty vector (pcDNA3.1) alone in MDCKII was described previously (Wang et al., 2008). Human ABCG2 or empty vector (pcDNA3.1) alone in MDCKII was previously established in our laboratory. In brief, the pcDNA3.1 plasmid construct alone (empty vector) and the pcDNA3.1 plasmid containing wild-type ABCG2 were prepared for transfection. MDCKII cell transfection was performed at 50% confluence with the lipid-based FuGENE 6 transfection reagent at a 3:1 ratio per manufacturer's protocol. Transfected cells were then selected through the addition of 800 μg/ml G418 (Geneticin) to the parent cell line medium [minimal essential medium containing l-glutamine (GlutaMAX), 5% fetal bovine serum, 100 U/ml penicillin, and 100 μg/ml streptomycin]. Further selection and functional studies were performed by flow cytometry. The expression and localization of ABCG2 were confirmed by Western blot and confocal microscopy.
PAN Isomers Transport in Rat Abcg2 or Human ABCG2 in MDCKII Cells.
In brief, rat/human ABCG2 or empty vector in MDCKII cells were seeded on microporous membrane filters (3.0-μm pore size, 24-mm diameter; Transwell 3414; Corning Life Sciences, Lowell, MA) at a density of 1.0 × 10⁶ cells/well. Cells were grown for 4 days to achieve transepithelial electrical resistance >200 Ω · cm2, and medium was replaced every other day. Before the experiment, the medium at both the apical and basolateral side of the monolayer was replaced with 2 ml of Opti-MEM I medium (Invitrogen) without serum, and either apical or basolateral side was loaded with a 3, 10, 30, 50, and 200 μM concentration of individual PAN isomers and 0.2 μCi/ml [3H]mannitol (PerkinElmer Life and Analytical Sciences, Waltham, MA). Cells were incubated at 37°C in 5% CO2. Aliquots (50 μl) were collected to assess the paracellular flux of [3H]mannitol into the opposite compartment; layers restricted mannitol transport to <1% of the total radioactivity per hour. For PAN isomer transport, 140-μl aliquots were taken at 0.5 and 1 h. Samples were stored at −80°C until the time of analysis by HPLC assay.
PAN Assay.
Concentrations of PAN were assayed by HPLC (system) using a Luna RP18 125 × 4.0-mm column (Phenomenex, Torrance, CA), elution with 40% acetonitrile/60% 10 mM potassium phosphate buffer, pH 7.2, at 0.5 ml/min, and UV absorption at 290 nm. Aliquots of PAN in Opti-MEM I medium were directly injected onto the HPLC. The standard curve range was from 7.8 to 2000 ng/ml. All of the standard curves showed an intraday and interday variability of <10% and r2 > 0.999.
Apparent Permeability.
The observed permeability [PObs, (μl/h)/cm2] of PAN isomers or paracellular marker was determined by calculating its initial transfer rate (ΔX/Δt, picomoles per hour) across the cell layer and dividing by the surface area (A, cm2) of the Transwell plate and the initial concentration (C0, picomoles per milliliter) in the donor chamber (eq. 1). PAN isomers transport data in rat Abcg2 or human ABCG2 were expressed as mean ± S.D.
Theoretical and Mathematical Analysis.
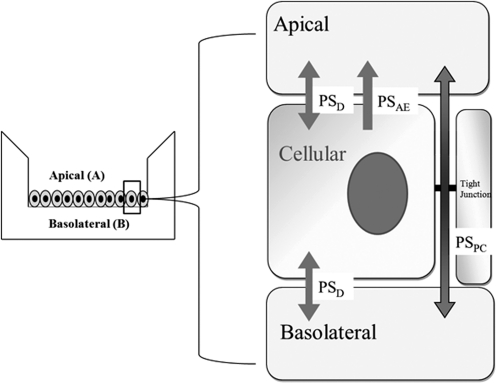
Assuming the substrate does not interact with endogenous transporters, passive diffusion permeability (PSD) is the same across both basolateral and apical membranes; no cellular metabolism and rapid intracellular diffusion; a three-compartment kinetic model of transcellular flux across a monolayer system (ABCG2-MDCKII) is established in Fig. 2. In brief, the driving force for drug efflux from basolateral-to-apical side includes PSD across both basolateral and apical membranes, paracellular transport (PSPC) between cells, and active transport efflux on apical side (PSAE) associated with the transporter. The model assumes that 1) the substrate does not interact with any endogenous transporters, 2) PSD is the same across both membranes, and 3) there is rapid intracellular diffusion and no cellular metabolism. Substrate flux rates in three compartments can be described by the following set of differential equations (eqs. 2–4).
where XB, XA, and XC are the mass of drug in the basolateral, apical, and cellular compartment; CC, CB, and CA are the concentration of drug in the cellular, basolateral, and apical compartment, respectively; PSAE, PSD, and PSPC are the permeability-surface area products for active apical efflux, passive diffusion, and paracellular pathways, respectively.
Fig. 2.
Theoretical model of PAN flux across rAbcg2/ABCG2-MDCKII cell monolayer in a Transwell system.
Equations 2 and 3 can be further refined to describe the initial permeability-surface area product from basolateral-to-apical (B-to-A) (PSObs,B→A) or apical-to-basolateral (A-to-B) (PSObs,A→B)
 |
 |
Paracellular permeability of mannitol was used as a surrogate for PAN PSPC. PSD was estimated from the PAN flux in parent MDCKII (PSAE = 0) by rearranging eq. 5 or 6 as follows:
PSAE was estimated from B-to-A or A-to-B PAN flux in rAbcg2/ABCG2-MDCKII rearranging eq. 5 or 6 to yield eq. 8 or 9, respectively.
Initial transfer flux of from B-to-A (assuming CA = 0) can be rewritten (eq. 10) to estimate CC.
where PSAE is approximated as in eqs. 8 and 9. Asymmetry efflux ratios (ERα) is defined as the ratio of the initial rate of B-to-A flux divided by the initial rate of A-to-B (eq. 11).
 |
Kinetic Parameter Estimation.
The saturation transport kinetics of a drug efflux by rAbcg2 or ABCG2 at the apical surface can be modeled by eq. 12, where Tmax is the maximum transport rate and KM is the Michaelis constant. The PSObs, PSD, and PSPC of each PAN isomer were estimated experimentally and used to estimate PSAE (eqs. 8 and 9). The intracellular concentrations (CC) were estimated by eq. 10. Nonlinear regression using Prism 5.04 (GraphPad Software, Inc., San Diego, CA) was used to estimate KM and Tmax.
An effective apical efflux permeability (PSAE,Eff), observed when CC ≪ KM (similar to intrinsic clearance), would be defined as follows (eq. 13).
Statistical Analysis.
A multivariate analysis (SPSS, Chicago, IL; and IBM, White Plains, NY) was performed to assess the influence of concentration, direction, and isomer on PSObs. A sum-of-squares F-test of kinetic parameters (TMax and KM) was performed using Prism 5.04.
Results
Pantoprazole Isomers Transported in rAbcg2 or ABCG2.
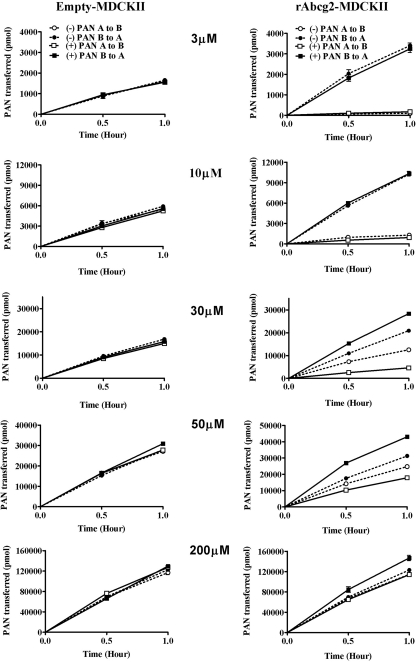
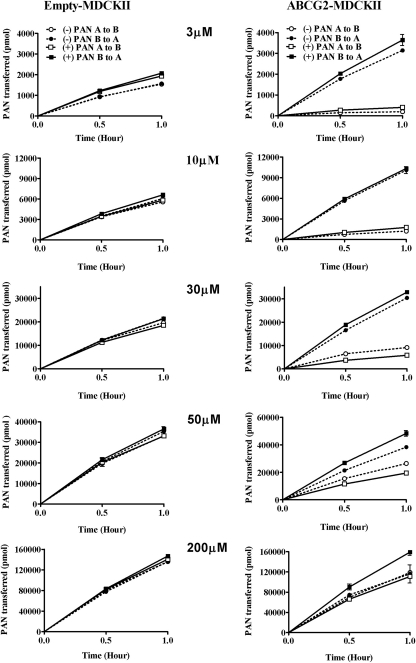
The overall flux of PAN isomers was evaluated for both rAbcg2 and ABCG2 to assess stereoselectivity and species differences. The expression level and functional viability of stably expressing rat Abcg2 (Wang et al., 2008) and human ABCG2 (Empey et al., 2006) cDNA or vector alone in MDCKII cell lines have been established previously. The mass transport of PAN isomers was studied in empty-MDCKII and rAbcg2-MDCKII cells as shown in Fig. 3. For both of the PAN isomers in empty-MDCKII monolayers, PSObs was slightly higher in the B-to-A direction and increasing with concentration (P > 0.05). In contrast, the transport of PAN isomers exhibited a strong directional flux in rAbcg2-MDCKII cell line. There were marked differences between the PAN isomers transport at 30 and 50 μM for both directions. At lower (3 and 10 μM) concentrations, the difference between the isomers became negligible. At the highest donor concentration (200 μM), the flux of both isomers was equivalent to that observed in the empty-MDCKII cells. Parallel results were observed in empty-MDCKII and human ABCG2-MDCKII cell line transport study (Fig. 4). The directional transport of the two isomers confirmed that PAN is a substrate for both rAbcg2 and ABCG2.
Fig. 3.
Mean (±S.D., n = 3) PAN isomer transport in pcDNA3.1-MDCKII (left) or rAbcg2-MDCKII cells (right) at initial donor PAN concentrations of 3, 10, 30, 50, and 200 μM. The isomers were studied individually. Squares, (+)PAN; circles, (−)PAN; closed symbols, basolateral-to-apical flux; and open symbols, apical-to-basolateral flux.
Fig. 4.
Mean (±S.D., n = 3) PAN isomer transport in pcDNA3.1-MDCKII (left) or human ABCG2-MDCKII cells (right) at initial donor PAN concentrations of 3, 10, 30, 50, and 200 μM. The isomers were studied individually. Squares, (+)PAN; circles, (−)PAN; closed symbols, basolateral-to-apical flux; and open symbols, apical-to-basolateral flux.
Permeability Parameters and Asymmetry Efflux Ratios.
To ascribe specific membrane properties to individual isomers, the apparent permeability parameters (PSobs, PSD, and PSPC) and ERα (Tables 1 and 2) were obtained for both rAbcg2 and ABCG2. Assuming that the transport permeability of mannitol is similar to PAN isomer transport across PSPC, values were small and consistent across studies [range, 0.51–3.54 (μl/h)/cm2]. PSPC values were somewhat lower for ABCG2-MDCKII compared with empty-MDCKII. By use of PSobs for PAN transport in empty-MDCKII, PSD was estimated from eq. 7 at different concentrations and for both directions (Tables 1 and 2). The mean (±S.D.) PSD values were 244 (±18) and 287 (±16) (μl/h)/cm2 for the rat and human mock transfections, respectively.
TABLE 1.
The observed ERα, permeability parameters (PSPC) of mannitol, and permeability parameters (PSobs and PSD) of PAN isomers transport in empty and rAbcg2-MDCKII as a function of PAN donor concentration
PS units are expressed as (μl/h)/cm2.
| Cell Line | Substrate/Isomer | Parameter | 3 μM | 10 μM | 30 μM | 50 μM | 200 μM | Mean | S.D. |
|---|---|---|---|---|---|---|---|---|---|
| Empty-MDCKII | (−)PAN | PSobs A→B | 118 | 123 | 116 | 121 | 130 | 121 | 5 |
| PSobs B→A | 120 | 130 | 123 | 126 | 135 | 127 | 6 | ||
| ERα | 1.02 | 1.06 | 1.07 | 1.04 | 1.04 | 1.05 | 0.02 | ||
| (+)PAN | PSobs A→B | 116 | 114 | 110 | 123 | 142 | 121 | 13 | |
| PSobs B→A | 117 | 121 | 116 | 135 | 140 | 126 | 11 | ||
| ERα | 1.01 | 1.07 | 1.06 | 1.09 | 0.98 | 1.04 | 0.05 | ||
| (−)/(+)PAN | PSD | 231 | 242 | 226 | 251 | 271 | 244 | 18 | |
| Mannitol | PSpc | 2.3 | 1.14 | 3.54 | 0.72 | 1.39 | 1.82 | 1.12 | |
| rAbcg2-MDCKII | (−)PAN | PSobs A→B | 7.4 | 30.1 | 92.5 | 109 | 127 | N.A. | N.A. |
| PSobs B→A | 253 | 224 | 151 | 137 | 136 | N.A. | N.A. | ||
| ERα | 34 | 7.44 | 1.63 | 1.26 | 1.07 | N.A. | N.A. | ||
| (+)PAN | PSobs A→B | 12.8 | 20.9 | 33.5 | 79.1 | 126 | N.A. | N.A. | |
| PSobs B→A | 238 | 229 | 206 | 194 | 162 | N.A. | N.A. | ||
| ERα | 18.7 | 11 | 6.16 | 2.46 | 1.29 | N.A. | N.A. | ||
| Mannitol | PSPC | 0.51 | 0.88 | 3.44 | 0.72 | 1.59 | 1.43 | 1.2 |
N.A., not applicable.
TABLE 2.
The observed ERα, permeability parameters (PSPC) of mannitol and permeability parameters (PSobs and PSD) of PAN isomers transport in empty and ABCG2-MDCKII as a function of PAN donor concentration
PS units are expressed as (μl/h)/cm2.
| Cell Line | Substrate/Isomer | Parameter | 3 μM | 10 μM | 30 μM | 50 μM | 200 μM | Mean | S.D. |
|---|---|---|---|---|---|---|---|---|---|
| Empty-MDCKII | (−)PAN | PSobs A→B | 126 | 143 | 140 | 137 | 152 | 140 | 9 |
| PSobs B→A | 128 | 155 | 150 | 146 | 151 | 146 | 11 | ||
| ERα | 1.01 | 1.08 | 1.08 | 1.06 | 0.99 | 1.04 | 0.04 | ||
| (+)PAN | PSobs A→B | 140 | 140 | 137 | 136 | 159 | 142 | 10 | |
| PSobs B→A | 149 | 157 | 156 | 149 | 166 | 155 | 7 | ||
| ERα | 1.06 | 1.13 | 1.14 | 1.09 | 1.04 | 1.09 | 0.04 | ||
| (−)/(+)PAN | PSD | 267 | 291 | 289 | 277 | 309 | 287 | 16 | |
| Mannitol | PSpc | 2.3 | 3.29 | 1.22 | 3.44 | 2.29 | 2.51 | 0.9 | |
| rAbcg2-MDCKII | (−)PAN | PSobs A→B | 16.9 | 31.6 | 67.6 | 109 | 132 | N.A. | N.A. |
| PSobs B→A | 254 | 255 | 211 | 156 | 132 | N.A. | N.A. | ||
| ERα | 15 | 8.06 | 3.12 | 1.44 | 1 | N.A. | N.A. | ||
| (+)PAN | PSobs A→B | 30 | 42.2 | 43.6 | 79.6 | 126 | N.A. | N.A. | |
| PSobs B→A | 258 | 246 | 240 | 195 | 179 | N.A. | N.A. | ||
| ERα | 8.61 | 5.81 | 5.5 | 2.45 | 1.42 | N.A. | N.A. | ||
| Mannitol | PSPC | 1 | 1.03 | 0.76 | 0.78 | 0.71 | 0.86 | 0.15 |
N.A., not applicable.
PSobs of PAN isomers in empty-MDCKII cell lines were similar for both directions at different concentrations resulting in ERα values approximating unity for all of the experiments. By contrast, the PSobs values of both PAN isomers in the transfected cell lines were markedly different with respect to direction, favoring strong basolateral-to-apical directional flux at the lower PAN concentration. The apparent flux were similar for the two isomers but with important differences. At the lowest PAN concentration, the ERα of (−)PAN was nearly double that of (+)PAN for both Abcg2-MDCKII (Table 1) and ABCG2-MDCKII (Table 2). As donor concentration increased, PAN flux decreased for the basolateral-to-apical direction and increased for the apical-to-basolateral direction in Abcg2/ABCG2-MDCKII (Tables 1 and 2). As a result, the ERα for both PAN isomers in both rat and human ABCG2-transfected cell lines decreased with increasing donor concentration until a value approaching unity was achieved (Tables 1 and 2).
Cellular Concentration Profile.
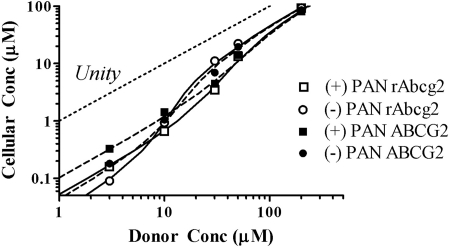
Recognizing that the driving force of transport of an apical efflux transporter (i.e., Abcg2/ABCG2) is cellular and not donor concentration, simulated cellular concentrations of PAN isomers corresponding to donor concentrations (Fig. 5) were estimated using eq. 10 and based on initial estimates of permeability parameters PSobs, PSD, and PSPC (Tables 1 and 2) of PAN isomers and apparent PSAE values (eqs. 8 and 9). At a low donor concentration (3 μM), cellular concentrations were estimated to be 3.2% of donor concentration for (−)PAN and 5.6% for (+)PAN for rAbcg2 and 5.5% for (−)PAN and 11% for (+)PAN for ABCG2. At a high donor concentration (above 50 μM), cellular concentration was predicted to approach half of the donor concentration (Fig. 5).
Fig. 5.
Predicted cellular concentration of PAN (eq. 10) relative to donor concentration based on PSD and PSPC described in Tables 1 and 2 and approximated values of PSAE (eqs. 8 and 9) were used. Squares, (+)PAN; circles, (−)PAN; open symbols, rAbcg2-MDCKII; closed symbols, ABCG2-MDCKII. The line of identity is provided as a reference.
Kinetic Parameters KM and Tmax for Rat Abcg2 and Human ABCG2.
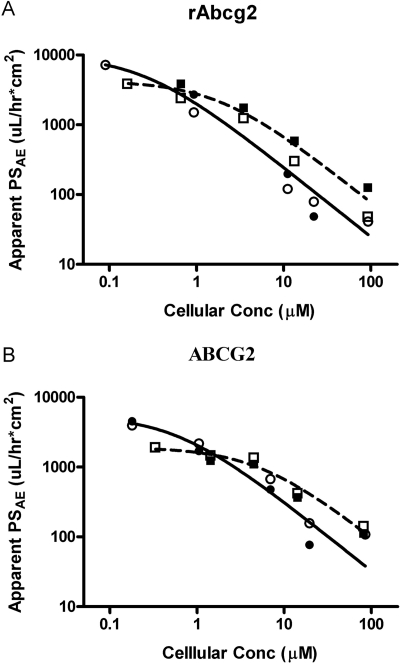
To ascribe specific kinetic parameters for ABCG2/rAbcg2 for the individual isomers, the profile of apparent PSAE (both directions) as a function of estimated cellular PAN concentration (Fig. 5) was analyzed as in Fig. 6. These estimates of PSAE become less accurate as PSObs approaches its boundaries (very high or low donor concentrations). Kinetic parameters for the interaction of each isomer with Abcg2 and ABCG2 are shown in Table 3. The (−)isomer of PAN has an 8-fold lower KM compared with the (+)PAN for both rAbcg2 (0.25 versus 1.85 μM, P < 0.01) and ABCG2 (0.6 versus 5.32 μM, P < 0.01), indicating a higher affinity of rAbcg2/ABCG2 for the (−)isomer. The (+)isomer of PAN has a roughly 3-fold higher TMax compared with the (−)PAN for both rAbcg2 (7.86 versus 2.49 nmol/h · cm2, P < 0.01) and ABCG2 (10.2 versus 3.29 nmol/h · cm2, P < 0.01). rAbcg2 had a lower KM (a higher affinity) for the PAN isomers compared with human ABCG2 but comparable TMax values. The overall permeability associated with rAbcg2 and ABCG2 (PSAE, effective transport clearance at low PAN concentrations) was calculated as the ratio of TMax over KM. PSAE was twice that for the (−)PAN [9920 and 5480 (μl/h)/cm2 for rAbcg2 and ABCG2, respectively] compared with the (+)PAN (4250 and 1920 μl/h · cm2 for rAbcg2 and ABCG2, respectively).
Fig. 6.
PSAE (eq. 12) as a function of simulated cellular PAN concentration (eq. 10). A, rAbcg2. B, human ABCG2-MDCKII cell monolayer. Squares indicate (+)PAN; circles, (−)PAN; open symbols, basolateral-to-apical PSAE; and closed symbols, apical-to-basolateral PSAE. The initial estimates of PSAE (eqs. 8 and 9) were used to generate cellular concentration (eq. 10), and these concentrations were used in the final estimation process. Both axes were log-transformed for easier visualization; fitting was performed using untransformed pooled data from both directional PSAE. The solid and dashed lines are the fitted results for the (−)PAN and (+)PAN isomers, respectively.
TABLE 3.
The fitted mean (±S.E. from nonlinear fitting) kinetic parameters (Km and Tmax) in both rAbcg2 and ABCG2
Overall permeability associated with rAbcg2/ABCG2 was calculated as the ratio of TMax over KM.
| Isoform | Parameters | (−)PAN | (+)PAN |
|---|---|---|---|
| Mean (±S.E.) | |||
| rAbcg2 | TMax, nmol/h · cm2 | 2.49 ± 0.41 | 7.86 ± 2.20 |
| KM, μM | 0.25 ± 0.06 | 1.85 ± 0.66 | |
| r2 | 0.983 | 0.933 | |
| PSAE,Eff, (μ/h)/cm2 | 9960 | 4250 | |
| ABCG2 | TMax, nmol/h · cm2 | 3.29 ± 0.48 | 10.2 ± 2.43 |
| KM, μM | 0.59 ± 0.12 | 5.32 ± 1.62 | |
| r2 | 0.984 | 0.932 | |
| PSAE,Eff, (μ/h)/cm2 | 5480 | 1920 | |
Modeling Overall Permeability.
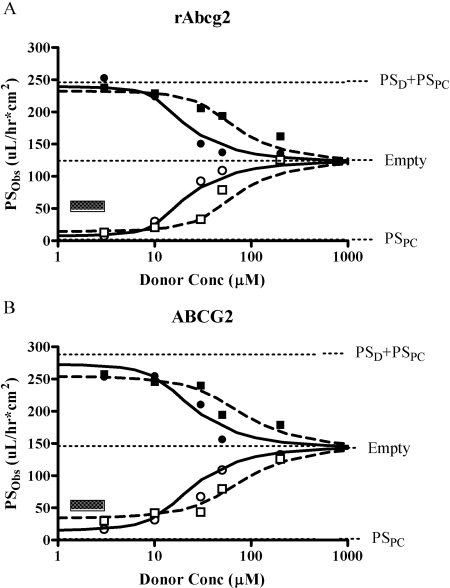
To assess the validity of the deconvolution process, the overall PSObs was modeled as a function of donor concentration (Fig. 7) by using the PSD values from the empty-MDCKII (Tables 1 and 2) as well as PSPC from the transfected cell lines (Tables 1 and 2) and the ABCG2-related kinetic parameters (Table 3). The comprehensive relationships (eqs. 5 and 6) were effective in modeling PAN flux in both directions of (−)PAN (r2 = 0.979) and (+)PAN (r2 = 0.988) in ABCG2-MDCKII and (−)PAN (r2 = 0.985) and (+)PAN (r2 = 0.986) in rAbcg2-MDCKII.
Fig. 7.
PSobs as a function of PAN donor concentration. A, rAbcg2. B, human ABCG2-MDCKII cell monolayer. Squares, (+)PAN; circles, (−)PAN; closed symbols, basolateral-to-apical flux; and open symbols, apical-to-basolateral flux. The simulation line represents eqs. 5 and 6 for basolateral-to-apical and apical-to-basolateral flux, respectively. Fitted parameters TMAX and KM (Table 3) were used to generate cellular concentration (eq. 10) and simulation of overall PSobs together with PSD and PSPC as described in Tables 1 and 2. Model limits for basolateral-to-apical (PSD + PSPC), apical-to-basolateral (PSPC), and empty cell line flux are presented for reference points. The small square box presents the range of PAN concentration in serum in rat or pharmacological concentration in human, respectively.
Discussion
Our laboratory and others have demonstrated the importance of ABCG2 in drug accumulation in milk. In a companion article (Wang and McNamara, 2012), we examine the transfer of PAN into rat milk that clearly demonstrated ABCG2-associated accumulation of (−)PAN in milk; however, initial in vitro result showed that (+)PAN had greater transport than (−)PAN in Abcg2-MDCKII cell line at 25 μM. In current study, the flux of individual PAN isomers was examined at concentrations from 3 to 200 μM to more rigorously characterize the stereoselectivity of ABCG2.
PAN isomers have identical physiochemical properties; hence, diffusion properties of PAN isomers should be indistinguishable. The PSD of PAN isomers transport in empty MDCKII cell line (parent cell line) at five different concentrations was virtually identical (Tables 1 and 2). There was essentially no directional transport difference observed, indicating limited interaction of PAN isomers with endogenous transporters in the parent MDCKII cell line. Consistent with the literature (Breedveld et al., 2004), both PAN isomers are substrates for rAbcg2/ABCG2. Moreover, both isomers display a concentration dependent flux profile in both human and rat ABCG2-MDCKII cell line (Figs. 3 and 4). The stereoselective interaction of PAN with rAbcg2/ABCG2 was clear at 30 and 50 μM but not evident at lower or higher concentrations.
The model (Fig. 2) provides a clear context for the interpretation of the isomer flux. At low concentrations, permeability across the apical membrane is so rapid (PSAE is so large relative to PSD) that the rate-limiting steps for PAN flux are associated with PSD across the basolateral membrane and paracellular flux (PSPC). Under these concentrations, overall flux becomes independent of rAbcg2/ABCG2 associated PSAE. As rAbcg2/ABCG2 transport becomes saturated at higher concentrations (PSAE is decreased), the contribution of diffusion across the apical membrane to overall flux approaches transport across empty-MDCKII. Only at the intermediate donor concentrations (Figs. 3 and 4) does the contribution and stereoselectivity of rAbcg2/ABCG2 to PAN transport become evident as measured by overall flux. Often flux studies, including those examining stereoisomer differences, are carried out at low substrate concentrations in high expressing clones to optimize the opportunity for detecting a response. Under such conditions, it is unlikely that stereoselective interactions would be reported since diffusion (i.e., across the opposite membrane or paracellular) is rate limiting and dominates the overall flux.
Taken together, the flux data from empty and rAbcg2/ABCG2-MDCKII cell lines were consistent with the three compartment kinetic model shown in Fig. 2. The model comprises apparent permeability because of passive diffusion on either apical or basolateral side (PSD), paracellular permeability through tight junction between cells (PSPC), and ABCG2-mediated active transport permeability on the apical side (PSAE). To analyze the data, several critical assumptions were made.
First, mannitol was assumed to be an adequate marker for PAN PSPC. This assumption was particularly critical in establishing the limits of apical-to-basolateral flux at low PAN concentrations. Under low substrate concentrations in high expressing clones, good substrates can have PSAE values that are very large (e.g., PSAE > 10 · PSD as is the case for PAN). In practical terms, most of the substrate that enters the cell from the apical side is fluxed back out to the donor compartment, and more of the drug reaching the basolateral side is associated with PSPC.
The second assumption was related to the estimation of cellular concentration. Ideally, intracellular unbound concentrations should be measured; however, this is technically very challenging. Relating kinetic parameters VMax and KM to donor concentrations was problematic. Initial attempts to fit flux to permutations of the Michaelis-Menten equation as a function of donor concentration resulted in fits that did not mimic the observed data. Fitting flux to donor concentrations suggested an apparent cooperative interaction (i.e., Hill coefficient) with the transporter (Pan et al., 2007). The driving force for an apical efflux transporter, such as rAbcg2/ABCG2, is cellular and not donor concentration. The apparent cooperativity reflected the fact that there is relatively more cellular drug concentration as donor concentration increases because of saturation of the efflux transporter (Fig. 5). Intracellular concentrations were not measured in the current study but were predicted by the model (Fig. 2) using the apparent PSAE as well as estimates of PSD and PSPC.
These intracellular concentrations were then used to estimate kinetic parameters. The estimated KM values ranged from 0.25 to 5.3 μM, whereas the donor concentrations around the donor concentration necessary to achieve these concentrations (Fig. 7) were in the 20 to 100 μM range. The (−)PAN had a KM value that was 8-fold lower of the (+)isomer, indicating that (−)PAN had an 8-fold higher affinity for ABCG2 as well as rAbcg2. The capacity (TMax) was 70% lower for (−)PAN for ABCG2 and rAbcg2. For typical therapeutic dosing, serum unbound concentrations are likely to be below 0.1 μM; hence, cellular concentrations would also be expected to be well below the KM. The PSAE,Eff (listed in Table 3) would be more than 2-fold greater for (−)PAN compared with the (+)isomer. Therefore, (−)PAN is predicted to be a better substrate for rAbcg2/ABCG2 than (+)PAN. In the companion article (Wang and McNamara, 2012), the M/S for (−)PAN in rats was 1.36 and decreased markedly in response to GF120918 (an inhibitor of rAbcg2/ABCG2) compared with 0.54 for (+)PAN. Hence, the stereoselective effect of PAN with rAbcg2 in vitro manifested itself in a measureable in vivo difference in disposition, i.e., accumulation in rat milk.
Isolating the various parameters (PSD, PSPC, TMax, and KM) allowed the overall PSObs to be successfully modeled (Fig. 7). PAN flux in the B-to-A direction at a low PAN concentration was very rapid across the apical membrane, and overall flux was limited by the rate of diffusional flux across the basolateral membrane plus diffusion via the paracellular pathway. PAN flux in the A-to-B direction was limited largely to paracellular diffusion because the counter flux associated with PSAE was so efficient that virtually none of the drug which entered the cell from the apical surface fluxed to the basolateral compartment through the cell itself.
The current in vitro flux data for PAN isomers would suggest that the stereoselectivity in rat milk accumulation (Wang and McNamara, 2012) would also hold for human exposure as well because ABCG2 was 2-fold difference in PSAE,Eff for PAN isomers (Table 3). The one case report did not examine individual isomers (Plante et al., 2004). The current work did not provide insights into the observed clinical report of a low M/S for pantoprazole (Plante et al., 2004).
In conclusion, there was stereoselective transport of PAN isomers in monolayers of both rAbcg2 and human ABCG2 expressed in MDCKII cell line with the (−)isomer possessing a greater affinity. A mechanism based model was used to quantify differences in kinetic parameters between the two isomers, which were not evident by examining flux at any single concentration. The unique characteristic of PAN isomers interaction with ABCG2 provided ideal experimental evidence to model drug transport across a cell monolayer. These kinetic parameters also provided insights to the extent of differences that arise for in vivo studies. The current work also provided insights into the species difference in ABCG2 transport.
This work was supported in part by the National Institutes of Health National Center for Research Resources [KL2-RR024154].
Article, publication date, and citation information can be found at http://dmd.aspetjournals.org.
- MDCKII
- Madin-Darby canine kidney II
- ABCG2/Abcg2
- ATP binding cassette transporter family G member 2
- rAbcg2
- rat Abcg2
- PAN
- pantoprazole
- M/S
- milk to serum
- GF120918
- N-(4-[2-(1,2,3,4-tetrahydro-6,7-dimethoxy-2-isoquinolinyl)ethyl]-phenyl)-9,10-dihydro-5-methoxy-9-oxo-4-acridine carboxamide
- HPLC
- high-performance liquid chromatography
- PObs
- observed permeability
- PSD
- permeability-surface area for passive diffusion
- PSPC
- permeability-surface area of paracellular transport
- PSAE
- permeability-surface area of active efflux mediated by ABCG2 on apical side
- ERα
- asymmetry efflux ratios
- PSAE,Eff
- effective apical efflux permeability
- B-to-A
- basolateral-to-apical
- A-to-B
- apical-to-basolateral.
Authorship Contributions
Participated in research design: Wang and McNamara.
Conducted experiments: Wang.
Contributed new reagents or analytic tools: Wang.
Performed data analysis: Wang and McNamara.
Wrote or contributed to the writing of the manuscript: Wang, Leggas, Empey, and McNamara.
References
- Balimane PV, Chong S. (2005) A combined cell based approach to identify P-glycoprotein substrates and inhibitors in a single assay. Int J Pharm 301:80–88 [DOI] [PubMed] [Google Scholar]
- Balimane PV, Patel K, Marino A, Chong S. (2004) Utility of 96 well Caco-2 cell system for increased throughput of P-gp screening in drug discovery. Eur J Pharm Biopharm 58:99–105 [DOI] [PubMed] [Google Scholar]
- Breedveld P, Zelcer N, Pluim D, Sönmezer O, Tibben MM, Beijnen JH, Schinkel AH, van Tellingen O, Borst P, Schellens JH. (2004) Mechanism of the pharmacokinetic interaction between methotrexate and benzimidazoles: potential role for breast cancer resistance protein in clinical drug-drug interactions. Cancer Res 64:5804–5811 [DOI] [PubMed] [Google Scholar]
- Empey PE, Leggas M, McNamara PJ. (2006) PhIP transport in ABCG2 stably transfected MDCKII cells. American Association of Pharmaceutical Scientists Meeting; 2006 Nov 1; San Antonio, TX AAPS PharmSci 8(S2), Abstract W5320 [Google Scholar]
- Gerk PM, Kuhn RJ, Desai NS, McNamara PJ. (2001) Active transport of nitrofurantoin into human milk. Pharmacotherapy 21:669–675 [DOI] [PubMed] [Google Scholar]
- Giacomini KM, Huang SM, Tweedie DJ, Benet LZ, Brouwer KL, Chu X, Dahlin A, Evers R, Fischer V, Hillgren KM, et al. (2010) Membrane transporters in drug development. Nat Rev Drug Discov 9:215–236 [DOI] [PMC free article] [PubMed] [Google Scholar]
- Jonker JW, Merino G, Musters S, van Herwaarden AE, Bolscher E, Wagenaar E, Mesman E, Dale TC, Schinkel AH. (2005) The breast cancer resistance protein BCRP (ABCG2) concentrates drugs and carcinogenic xenotoxins into milk. Nat Med 11:127–129 [DOI] [PubMed] [Google Scholar]
- Kalvass JC, Pollack GM. (2007) Kinetic considerations for the quantitative assessment of efflux activity and inhibition: implications for understanding and predicting the effects of efflux inhibition. Pharm Res 24:265–276 [DOI] [PubMed] [Google Scholar]
- McNamara PJ, Meece JA, Paxton E. (1996) Active transport of cimetidine and ranitidine into the milk of Sprague Dawley rats. J Pharmacol Exp Ther 277:1615–1621 [PubMed] [Google Scholar]
- Merino G, Alvarez AI, Pulido MM, Molina AJ, Schinkel AH, Prieto JG. (2006) Breast cancer resistance protein (BCRP/ABCG2) transports fluoroquinolone antibiotics and affects their oral availability, pharmacokinetics, and milk secretion. Drug Metab Dispos 34:690–695 [DOI] [PubMed] [Google Scholar]
- Merino G, Jonker JW, Wagenaar E, Pulido MM, Molina AJ, Alvarez AI, Schinkel AH. (2005) Transport of anthelmintic benzimidazole drugs by breast cancer resistance protein (BCRP/ABCG2). Drug Metab Dispos 33:614–618 [DOI] [PubMed] [Google Scholar]
- Oo CY, Kuhn RJ, Desai N, McNamara PJ. (1995) Active transport of cimetidine into human milk. Clin Pharmacol Ther 58:548–555 [DOI] [PubMed] [Google Scholar]
- Oo CY, Paxton EW, McNamara PJ. (2001) Active transport of nitrofurantoin into rat milk. Adv Exp Med Biol 501:547–552 [DOI] [PubMed] [Google Scholar]
- Pan G, Giri N, Elmquist WF. (2007) Abcg2/Bcrp1 mediates the polarized transport of antiretroviral nucleosides abacavir and zidovudine. Drug Metab Dispos 35:1165–1173 [DOI] [PubMed] [Google Scholar]
- Plante L, Ferron GM, Unruh M, Mayer PR. (2004) Excretion of pantoprazole in human breast. J Reprod Med 49:825–827 [PubMed] [Google Scholar]
- Sun H, Pang KS. (2008) Permeability, transport, and metabolism of solutes in Caco-2 cell monolayers: a theoretical study. Drug Metab Dispos 36:102–123 [DOI] [PubMed] [Google Scholar]
- Tanaka M, Ohkubo T, Otani K, Suzuki A, Kaneko S, Sugawara K, Ryokawa Y, Ishizaki T. (2001) Stereoselective pharmacokinetics of pantoprazole, a proton pump inhibitor, in extensive and poor metabolizers of S-mephenytoin. Clin Pharmacol Ther 69:108–113 [DOI] [PubMed] [Google Scholar]
- van Herwaarden AE, Wagenaar E, Merino G, Jonker JW, Rosing H, Beijnen JH, Schinkel AH. (2007) Multidrug transporter ABCG2/breast cancer resistance protein secretes riboflavin (vitamin B2) into milk. Mol Cell Biol 27:1247–1253 [DOI] [PMC free article] [PubMed] [Google Scholar]
- Vlaming ML, Lagas JS, Schinkel AH. (2009) Physiological and pharmacological roles of ABCG2 (BCRP): recent findings in Abcg2 knockout mice. Adv Drug Deliv Rev 61:14–25 [DOI] [PubMed] [Google Scholar]
- Wang L, Leggas M, Goswami M, Empey PE, McNamara PJ. (2008) N-(4-[2-(1,2,3,4-Tetrahydro-6,7-dimethoxy-2-isoquinolinyl)ethyl]-phenyl)-9,10-dihydro-5-methoxy-9-oxo-4-acridine carboxamide (GF120918) as a chemical ATP-binding cassette transporter family G member 2 (Abcg2) knockout model to study nitrofurantoin transfer into milk. Drug Metab Dispos 36:2591–2596 [DOI] [PMC free article] [PubMed] [Google Scholar]
- Wang L, McNamara PJ. (2012) Stereoselective Interaction of Pantoprazole with ABCG2. I. Drug accumulation in rat milk. Drug Metab Dispos 40:1018–1023 [DOI] [PubMed] [Google Scholar]
- Xie Z, Zhang Y, Xu H, Zhong D. (2005) Pharmacokinetic differences between pantoprazole enantiomers in rats. Pharm Res 22:1678–1684 [DOI] [PubMed] [Google Scholar]


