

Abstract
Cediranib is an orally active tyrosine kinase inhibitor that targets the vascular endothelial growth factor receptor family. Because of its potent antiangiogenic and antitumor activities, cediranib has been evaluated for therapy in glioma, a primary brain tumor. This study investigated the influence of two important efflux transporters at the blood-brain barrier, P-glycoprotein (P-gp) and breast cancer resistance protein (Bcrp), on the delivery of cediranib to the central nervous system. In vitro studies indicated that cediranib is a dual substrate for both P-gp and Bcrp. It is noteworthy that in spite of the in vitro data the in vivo mouse disposition studies conclusively showed that P-gp was the dominant transporter restricting the brain distribution of cediranib. The brain-to-plasma partitioning (AUCbrain/AUCplasma, where AUC is area under the curve) and the steady-state brain-to-plasma concentration ratio of cediranib were approximately 20-fold higher in Mdr1a/b(−/−) and Mdr1a/b(−/−)Bcrp1(−/−) mice compared with wild-type and Bcrp1(−/−) mice. Moreover, there was no significant difference in brain distribution of cediranib between wild-type and Bcrp1(−/−) mice and between Mdr1a/b(−/−) and Mdr1a/b(−/−)Bcrp1(−/−) mice. These results show that, unlike other tyrosine kinase inhibitors that are dual substrates for P-gp and Bcrp, Bcrp does not restrict the distribution of cediranib across the blood-brain barrier. We also show that inhibition of P-gp using specific or nonspecific inhibitors resulted in significantly enhanced delivery of cediranib to the brain. Concurrent administration of cediranib with chemical modulators of efflux transporters can be used as a strategy to enhance delivery and thus efficacy of cediranib in the brain. These findings are clinically relevant to the efficacy of cediranib chemotherapy in glioma.
Introduction
Delivery of drugs through the blood-brain barrier (BBB) is one of the fundamental challenges in treating diseases of the central nervous system (CNS). The BBB is an anatomical barrier because of the presence of endothelial tight junctions and a functional barrier because of the expression of active drug efflux transporters. Together, these two aspects restrict the passage of most small and large molecules into the brain, making the barrier effectively impermeable to many compounds that target diseases of the CNS. The ATP-binding cassette (ABC) transporters P-glycoprotein (P-gp; ABCB1), and breast cancer resistance protein (Bcrp; ABCG2) are two important efflux transporters that work together at the BBB, limiting the transport of several therapeutic agents into the brain (Agarwal et al., 2011a). It has been shown that there are overlapping substrate specificities for these two efflux pumps, and a number of drugs, including many anticancer tyrosine kinase inhibitors (TKIs), are reported to be dual substrates for both P-gp and Bcrp (Dai et al., 2003; de Cries et al., 2007; Chen et al., 2009; Polli et al., 2009; Agarwal et al., 2010, 2011; Tang et al., 2012). Furthermore, it has been reported that P-gp is dominant in restricting the brain penetration of many dual P-gp/Bcrp substrates with Bcrp being the less dominant transporter (Lee et al., 2005; Zhao et al., 2009; Agarwal et al., 2011). Together, these two transporters work as a team of gatekeepers that keep substrate drugs out of the brain.
Cediranib [4-[(4-fluoro-2-methyl-1H-indol-5-yl)oxy]-6-methoxy-7-[3-(pyrrolidin-1-yl)propoxy]quinazoline; also known as AZD2171 and Recentin (AstraZeneca, Wilmington, DE)] is a potent and orally active inhibitor of the vascular endothelial growth factor (VEGF) family of receptors (VEGFR-1, VEGFR-2, and VEGFR-3) (Batchelor et al., 2007). The role of VEGFRs as primary mediators of angiogenesis is well established in many tumors of the CNS, especially glioblastoma multiforme (GBM) (Huang et al., 2005). In gliomas, angiogenesis is driven mainly by VEGF-A-mediated signaling via VEGFR-2, which leads to the proliferation, migration, and survival of tumor endothelium and abnormal microvascular permeability (Carmeliet and Jain, 2000). VEGFR-2 is commonly overexpressed in tumor endothelial cells in gliomas (Hormigo et al., 2011; Sikkema et al., 2011). Therefore, tumor vasculature has been investigated as a potential target for disrupting tumor-associated angiogenesis by inhibition of VEGF signaling (Demeule et al., 2004). Cediranib has been evaluated in several clinical trials for the treatment of various tumors either alone or in combination with standard or experimental therapeutics, including recurrent GBM (Batchelor et al., 2010), non–small-cell lung cancer (Ramalingam et al., 2010), colorectal cancer (Satoh et al., 2011), and others. Preclinical studies in glioblastoma mouse models have shown that cediranib is effective in reducing tumor blood vessel formation and normalizing the aberrant glioma vasculature, leading to an improvement in progression-free survival. However, it is thought that this survival benefit may be caused by the alleviation of edema rather than a true antitumor effect (Kamoun et al., 2009). This was confirmed in a recently concluded phase II clinical study that reported that cediranib significantly decreased tumor vessel permeability and diameter, as well as induced other vascular changes that led to edema alleviation, but did not reduce tumor growth (Batchelor et al., 2010).
As mentioned earlier, the delivery of drugs across the BBB into the brain to their intracerebral targets is a requirement for efficacy of these drugs. Restricted delivery of chemotherapeutic agents across the BBB can significantly hamper their efficacy against brain tumors. Cediranib has a broad structural similarity with other TKIs, such as gefitinib, erlotinib, and lapatinib, which are avid substrates for P-gp/Bcrp (Polli et al., 2009; Agarwal et al., 2010; Kodaira et al., 2010). We therefore hypothesized that cediranib may also be a substrate for either P-gp or Bcrp or both. If this is true, the interaction of cediranib with these active efflux transporters present at the BBB could limit its brain distribution and result in reduced efficacy against brain tumors such as GBM. In a recent review, we discussed how efficacy of molecularly targeted agents in GBM can be limited by several factors that affect drug delivery to the target tumor cells in tumors such as glioma (Agarwal et al., 2011). Glioma is a very invasive disease, and glioma cells infiltrate normal brain areas centimeters away from the tumor core and remain shielded behind an intact BBB (Kuratsu et al., 1989; Silbergeld and Chicoine, 1997; Lucio-Eterovic et al., 2009). Even though blood vessels in or near the tumor core may show poor barrier function, it may still be difficult for cediranib to achieve therapeutic concentrations in other regions of the brain endothelium, especially in areas that harbor the invasive tumor cells, thereby leading to its ineffectiveness in targeting the infiltrative tumor growth. Limited delivery of cediranib to its target sites in the invasive glioma cells may be one of the reasons for its clinical ineffectiveness seen in GBM. There are no published reports investigating the distribution of cediranib to the CNS. Likewise, the interaction of cediranib with drug efflux transporters has not been characterized. In the current study, we investigated whether cediranib is a substrate for the efflux pumps, P-gp and Bcrp, and whether this restricts delivery of cediranib across an intact BBB.
Materials and Methods
Chemicals and Reagents
Cediranib and tyrphostin [AG1478; 4-(3-chloroanilino)-6,7-dimethoxyquinazoline] were purchased from Selleck Chemicals LLC (Houston, TX) and LC Laboratories (Woburn, MA), respectively. [3H]vinblastine (18.2 Ci/mmol; purity 97.4%) was purchased from Moravek Biochemicals (Brea, CA), and [3H]prazosin (70 Ci/mmol; purity 97%) was purchased from PerkinElmer Life and Analytical Sciences (Waltham, MA). Elacridar [GF120918; N-(4-[2-(6,7-dimethoxy-3,4-dihydro-1H-isoquinolin-2-yl)ethyl]-5-methoxy-9-oxo-10H-acridine-4-carboxamide] was purchased from Toronto Research Chemicals, Inc. (North York, ON, Canada). Ko143 [(3S,6S,12aS)-1,2,3,4,6,7,12,12a-octahydro-9-methoxy-6-(2-methylpropyl)-1,4-dioxopyrazino[1′,2′:1,6]pyrido[3,4-b]indole-3-propanoic acid 1,1-dimethylethyl ester] was generously provided by Dr. Alfred Schinkel (The Netherlands Cancer Institute, Amsterdam, The Netherlands), and zosuquidar [LY335979; (R)-4-((1aR,6R,10bS)-1,2-difluoro-1,1a,6,10b-tetrahydrodibenzo-(a,e)cyclopropa(c)cycloheptan-6-yl)-α-((5-quinoloyloxy) methyl)-1-piperazine ethanol, trihydrochloride] was a gift from Eli Lilly & Co. (Indianapolis, IN). All other reagents and chemicals were purchased from Sigma (St. Louis, MO).
In Vitro Studies
Cell Lines.
In vitro studies were conducted in epithelial Madin-Darby canine kidney (MDCKII) cells that expressed either human P-gp (MDCKII-MDR1 cell line) or murine Bcrp (MDCKII-Bcrp1 cell line). These cells were generously provided by Drs. Piet Borst and Alfred H. Schinkel (The Netherlands Cancer Institute). Cells were cultured in Dulbecco's modified Eagle's medium containing 10% fetal bovine serum (Sigma), penicillin (100 U/ml), streptomycin (100 μg/ml), and amphotericin B (250 ng/ml) (all Sigma) and maintained at 37°C with 5% CO2 under humidifying conditions.
Intracellular Accumulation.
For the intracellular accumulation studies, cells were grown in 12-well polystyrene plates (Thermo Fisher Scientific, Waltham, MA) that were seeded at a density of 2 × 10⁵ cells/well. Growth medium was changed on alternate days until the cells formed confluent monolayers. On the day of the experiment cells were equilibrated for 30 min with 1 ml of growth medium with or without transporter inhibitors. After the preincubation step, the experiment was initiated by addition of 1 ml of cediranib working solution (1 μM), and the plates were incubated in an orbital shaker maintained at 37°C. The experiment was terminated after a 3-h accumulation period by aspirating the drug solution from the wells and washing the cells twice with 1 ml of ice-cold phosphate-buffered saline. Cells were then solubilized by addition of 0.5 ml of M-PER mammalian protein extraction reagent (Thermo Fisher Scientific) to each well, and the protein concentration in the solubilized cell fractions was determined by the bicinchoninic acid protein assay (Thermo Fisher Scientific). Cediranib concentration associated with a 100-μl sample was determined by high-performance liquid chromatography (HPLC) coupled with tandem mass spectrometry (MS/MS). The intracellular uptake of cediranib was expressed as a percentage of accumulated cediranib (nanogram per microgram of protein) measured in the transfected cells compared with that in wild-type cells. For inhibition studies, the cells were treated with the dual P-gp/Bcrp inhibitor GF120918 (5 μM) and the selective inhibitors LY335979 (1 μM) for P-gp or Ko143 (200 nM) for Bcrp during both the preincubation and accumulation periods. The stock solutions for all of the inhibitors used were prepared in dimethyl sulfoxide and diluted by using cell growth medium to obtain working concentrations. The final concentration of DMSO in the working solutions was always less than 0.5%. [3H]vinblastine and [3H]prazosin were included in the accumulation studies as positive controls for P-gp and Bcrp, respectively. Radioactivity (dpm) associated with a 150-μl sample was determined by liquid scintillation counting (LS-6500; Beckman Coulter, Fullerton, CA). The radioactivity in the cell fractions was normalized by the respective protein concentrations, and drug accumulation in the cells was expressed as a percentage of accumulated radioactivity (dpm per microgram of protein) in the transfected cells compared with the wild-type control cells.
Directional Flux Assays.
Transepithelial transport of cediranib was assessed by using MDCKII wild-type, MDR1-transfected, and Bcrp1-transfected cells. Transport assays were performed in six-well Transwells (Corning Glassworks, Corning, NY). The cells were seeded at a density of 2 × 10⁵ cells/well until they formed confluent polarized monolayers. The experiment was conducted by applying a 900 ng/ml solution of cediranib (in complete growth medium) to the donor compartment. The receiver compartment was then sampled (200-μl aliquot) at 0, 2, and 3 h after addition of cediranib to the donor side and immediately replaced with fresh growth medium. Transport of cediranib was assessed in two directions: apical-to-basolateral (A-to-B) and basolateral-to-apical (B-to-A). The amount of cediranib transported over time was determined by measuring cediranib concentrations in the samples by HPLC-MS/MS. The apparent permeability (Papp) of cediranib was calculated by the following equation:
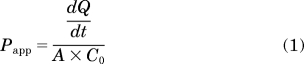 |
where dQ/dt is the rate of mass transport (determined from the slope of the amount transported versus time plot), A is the apparent surface area of the cell monolayer (4.67 cm2), and C0 is the initial donor concentration. The efflux ratio, defined as the ratio of Papp in the B-to-A direction to the Papp in the A-to-B direction, was used to estimate the magnitude of transporter-mediated efflux.
P-gp and Bcrp Inhibition Assays.
The ability of cediranib to inhibit P-gp and Bcrp was evaluated by examining the intracellular accumulation of prototypical probe substrates, [3H]vinblastine for P-gp and [3H]prazosin for Bcrp in presence of varying concentrations of cediranib ranging from 0 to 40 μM. The accumulation was carried out for 2 h as described earlier, and the amount of accumulated radioactivity associated with the probe substrates (dpm per microgram protein) was measured and plotted versus cediranib concentration.
In Vivo Studies
Animals.
In vivo studies were conducted in wild-type, Mdr1a/b(−/−) (P-gp knockout), Bcrp1(−/−) (Bcrp knockout), and Mdr1a/b(−/−)Bcrp1(−/−) (triple knockout) mice of a FVB genetic background from Taconic Farms (Germantown, NY). All animals, 8 to 10 weeks old, were maintained under temperature-controlled conditions with a 12-h light/dark cycle and unlimited access to food and water. Mice were handled according to the guidelines set by the National Institutes of Health (Institute of Laboratory Animal Resources, 1996) and approved by the Institutional Animal Care and Use Committee of the University of Minnesota.
Plasma and Brain Pharmacokinetics after Intravenous or Oral Administration.
Wild-type and Mdr1a/b(−/−)Bcrp1(−/−) mice were administered a 5 mg/kg dose of cediranib (1.0% w/v Tween 80) by oral gavage. Mice were euthanized by using a CO2 chamber at the desired time points for up to 24 h postdose (n = 4 at each time point), and blood and brain were harvested.
For intravenous administration of cediranib, the dosing solution was prepared on the day of the experiment by dissolving cediranib in a vehicle containing DMSO, propylene glycol, and saline (5:3:2 v/v/v) to yield a final concentration of 2 mg/ml. Wild-type, Mdr1a/b(−/−), Bcrp1(−/−), and Mdr1a/b(−/−)Bcrp1(−/−) mice received an intravenous dose of 4 mg/kg cediranib by tail vein injection. Blood and brain were sampled at different time points up to 24 h postdose, n = 4 at each time point. Plasma was isolated from blood cells by centrifugation at 3500 rpm for 10 min at 4°C. Brains were rinsed with ice-cold saline to remove extraneous blood and flash-frozen in liquid nitrogen. Plasma and brain specimens were stored at −80°C until analysis by HPLC-MS/MS. At the time of analysis, brain tissues were homogenized in three volumes of ice-cold 5% (w/v) bovine serum albumin in phosphate-buffered saline solution. Because the brain vascular space in mice is 1.4% of the whole brain volume (Dai et al., 2003), brain concentration was corrected for the residual drug in the brain vasculature by the following equation: Cbr, corrected = Cbr, measured − 0.014 × Cpl, where Cbr, corrected is the true cediranib concentration in the brain, Cbr, measured is the measured cediranib concentration in the brain, and Cpl is the plasma concentration of cediranib.
Noncompartmental pharmacokinetic analyses using Phoenix WinNonlin 6.1 (Pharsight, Mountain View, CA) were carried out to estimate the pharmacokinetic parameters. The AUC was calculated by using the trapezoidal rule. The maximum drug concentration (Cmax) and the time to reach peak concentration (Tmax) were determined from the observed data.
Steady-State Brain Distribution of Cediranib.
The partition coefficient of cediranib in brain was determined by measuring concentrations in brain and plasma at steady state in wild-type, Mdr1a/b(−/−), Bcrp1(−/−), and Mdr1a/b(−/−)Bcrp1(−/−) mice. Cediranib was administered as a constant rate intraperitoneal infusion of 50 μg/h by using Alzet osmotic minipumps (Durect Corporation, Cupertino, CA). A 50 mg/ml solution of cediranib in DMSO was filled in the minipumps (model 1003D), and the pumps were surgically inserted into the peritoneal cavity of anesthetized mice (100 mg/kg ketamine, 10 mg/kg xylazine), and the animals were allowed to recover for 1 h on a heated pad. The animals were euthanized 72 h postsurgery, and brain and blood were collected as described earlier. Plasma and brain specimens were stored at −80°C until analysis by HPLC-MS/MS. The pumps operated at a constant flow rate of 1 μl/h, resulting in an intraperitoneal infusion rate of 50 μg/h.
The apparent plasma clearance (CLapp) after infusion to steady state was calculated as follows:
where R0 is the constant rate of infusion (ng/h), and Css is the steady-state plasma concentration (ng/ml).
Influence of P-gp and Bcrp Inhibitors on Brain Distribution of Cediranib.
The influence of pharmacological inhibition of P-gp and Bcrp on brain distribution of cediranib was examined by concurrent administration of selective and nonselective inhibitors along with cediranib. Wild-type mice received an intravenous dose of blank vehicle (control), 25 mg/kg LY335979, 10 mg/kg Ko143, or 10 mg/kg GF120918 30 min before a 5 mg/kg oral dose of cediranib. Brain and plasma were collected at 90 min after the cediranib dose. Likewise, brain distribution of cediranib was determined in a separate group of wild-type, Mdr1a/b(−/−), Bcrp1(−/−), and Mdr1a/b(−/−)Bcrp1(−/−) mice that were dosed orally with 5 mg/kg cediranib. The effect of pharmacological inhibition was compared with genetic deletion of transporter genes at the same time point.
Quantitative Analysis of Cediranib by Liquid Chromatography-Tandem Mass Spectrometry.
Quantitation of cediranib in cell lysate, cell culture media, mouse plasma, and mouse brain homogenate was conducted by HPLC-MS/MS (Wang et al., 2011). In brief, frozen samples were thawed in a water bath at ambient temperature before drug extraction. Brain tissues were homogenized with a tissue homogenizer (Power Gen 125; Thermo Fisher Scientific) in three volumes of ice-cold 5% (w/v) bovine serum albumin in phosphate-buffered saline solution. A 50-μl aliquot of plasma and a 100-μl aliquot of brain homogenate samples were dispensed into disposable borosilicate glass culture tubes (13 mm × 100 mm) containing AG1478 (used as internal standard; 400 ng/ml in 10 μl of methanol) and vigorously mixed on a vortex mixer. Mouse plasma and brain homogenate samples were extracted by using liquid-liquid extraction with acetonitrile as organic phase. The supernatant was separated by centrifugation and dried under nitrogen. Samples were then reconstituted in a 75-μl mobile phase and transferred to autosampler vials for injection. A volume of 10 μl was injected at 10°C by using a temperature-controlled autosampling device. HPLC analysis was performed using an Agilent model 1200 separation system (Agilent Technologies, Santa Clara, CA). Separation was achieved on a ZORBAX Eclipse XDB-C18 RRHT threaded column (4.6 × 50 mm, 1.8 μm; Agilent Technologies). The HPLC system was interfaced to a TSQ Quantum 1.5 triple quadrupole mass spectrometer (Thermo Fisher Scientific) equipped with an electrospray ionization source. Column temperature was set to 30°C. The mobile phase was composed of 10 mM ammonium acetate containing 0.1% formic acid and acetonitrile (62:38 v/v). The flow rate was maintained at 0.25 ml/min, and the chromatographic run time was 9 min. The samples were analyzed by using an electrospray probe in the positive ionization mode operating at an ion spray voltage of 4000 V for both cediranib and the internal standard. Selected reaction monitoring was used for mass spectrometric quantitation. Data acquisition and analysis were controlled by the Xcalibur version 2.0.7 data system (Thermo Fisher Scientific). The collision gas was argon (1.5 mTorr), and the collision energy was set at 17 V for cediranib and 16 V for AG1478. The transitions monitored were m/z 451.7 → 112.2 for cediranib and m/z 317 → 301 for the internal standard. The assay was validated for a 2.5 to 2500 ng/ml concentration range for plasma and a 1 to 2000 ng/ml range for brain homogenate.
Statistical Analysis
The two sample t test was used for statistical testing of two groups by using SigmaStat, version 3.1 (Systat Software, Inc., San Jose, CA). Significance was declared at p < 0.05. Multiple groups were compared by one-way analysis of variance with the Holm-Sidak post hoc test at a significance level of p < 0.05.
Results
In Vitro Studies
Intracellular Accumulation of Cediranib in MDCKII Cells.
Intracellular accumulation of cediranib in MDCKII wild-type and MDR1- or Bcrp1-transfected cells was examined. [3H]vinblastine and [3H]prazosin, prototypical substrates for P-gp and Bcrp, respectively, were included as positive controls. As seen in Fig. 1A, accumulation of the P-gp substrate vinblastine was significantly reduced in the MDR1-transfected cells compared with wild-type control (∼24% of wild type). Likewise, cediranib accumulation in the MDR1-transfected cells was significantly lower compared with the wild-type cells (44% of wild type; p<0.05). Cediranib accumulation in the MDR1-transfected cells increased upon treatment with the P-gp-specific inhibitor LY335979 and the P-gp/Bcrp dual inhibitor GF120918 (Fig. 1A), such that it was not significantly different from the accumulation in wild-type cells. This suggested that P-gp is involved in efflux of cediranib from the cells. In the Bcrp1-transfected cells, there was significantly lower accumulation of the Bcrp substrate prazosin compared with wild-type control (∼44% of wild type; p < 0.05; Fig. 1B). Likewise, cediranib accumulation in the Bcrp1-transfected cells was statistically lower than that in wild-type cells (∼68% of wild type; p < 0.05). The efflux activity of Bcrp was abolished upon treatment with the Bcrp-selective inhibitor Ko143 and the P-gp/Bcrp dual inhibitor GF120918 (Fig. 1B), which suggests that Bcrp also limits intracellular accumulation of cediranib.
Fig. 1.

Intracellular accumulation of cediranib in MDCKII cells. A, accumulation in wild-type and MDR1-transfected cells. Accumulation of the cediranib in the MDR1-transfected cells (gray bars) was significantly lower than that in the wild-type cells (black bars). B, accumulation in wild-type and Bcrp1-transfected cells. Accumulation of cediranib in the Bcrp1-transfected cells (gray bars) was significantly lower than that in the wild-type cells (black bars). Use of the P-gp selective inhibitor LY335979, Bcrp-selective inhibitor Ko143, and the dual inhibitor GF120918 abolished the difference in accumulation between the wild-type and transfected cells. Results are presented as mean ± S.D. (n = 4 per group). *, p < 0.05.
Directional Permeability of Cediranib across MDCKII Cells.
Transcellular transport of cediranib was determined in MDCKII wild-type and MDR1- or Bcrp1-transfected cells. In the MDR1-transfected cells, the rate of cediranib transport was significantly increased in the B-to-A direction compared with that in the A-to-B direction (Fig. 2A; p < 0.05). The apparent permeability of cediranib in the B-to-A direction was 2-fold greater than the A-to-B permeability in the MDR1-transfected cells (Table 1). The P-gp inhibitor LY339579 effectively inhibited P-gp mediated efflux of cediranib in the MDR1-transfected cells, such that the B-to-A permeability of cediranib was significantly reduced in LY335979-treated cells compared with untreated cells (Table 1). Directional flux experiments in the Bcrp1-transfected cells showed increased directionality in the flux of cediranib (Fig. 2B), with the apparent permeability in the B-to-A direction being 4-fold greater than the A-to-B permeability (Table 2). The Bcrp inhibitor Ko143 reversed the Bcrp-mediated efflux transport such that the B-to-A permeability of cediranib was significantly reduced in Ko143-treated cells compared with untreated cells (Table 2). These in vitro studies suggest that cediranib is a substrate of both P-gp and Bcrp and is efficiently transported by both transporters.
Fig. 2.

Directional transport of cediranib across MDCKII cell monolayers. A, cediranib transported across wild-type (▵, A-to-B transport; ▴, B-to-A transport) and MDR1-transfected (○, A-to-B transport; ●, B-to-A transport) cells. B, cediranib transported across wild-type (▵, A-to-B transport; ▴, B-to-A transport) and Bcrp1-transfected (○, A-to-B transport; ●, B-to-A transport) cells. Cediranib transport was significantly increased in the B-A direction in both the MDR1- and Bcrp1-transfected cells, indicating P-gp- and Bcrp-mediated efflux. Results are expressed as mean ± S.D. (n = 3–4). *, p < 0.05.
TABLE 1.
Apparent permeability (Papp) of cediranib across wild-type and MDR1-transfected MDCKII cell monolayers
Results are expressed as mean ± S.D. (n = 3–4).
| Wild Type |
MDR1 Transfected |
|||
|---|---|---|---|---|
| A-to-B | B-to-A | A-to-B | B-to-A | |
| ×10−4cm/s | ||||
| Treatment control | 1.94 ± 0.10 | 2.24 ± 0.15 | 2.43 ± 0.07 | 5.0 ± 0.22* |
| 1 μM LY335979 | 1.17 ± 0.18† | |||
P < 0.05 compared with A-B.
P < 0.05 compared with B-A control.
TABLE 2.
Apparent permeability (Papp) of cediranib across wild-type and Bcrp1-transfected MDCKII cell monolayers
Results are expressed as mean ± S.D. (n = 3–4).
| Wild Type |
Bcrp1 Transfected |
|||
|---|---|---|---|---|
| A-to-B | B-to-A | A-to-B | B-to-A | |
| ×10−4cm/s | ||||
| Treatment control | 1.25 ± 0.13 | 1.22 ± 0.11 | 0.93 ± 0.02 | 3.59 ± 0.03* |
| 200 nM Ko143 | 1.28 ± 0.13† | |||
P < 0.05 compared with A-B.
Not significantly different compared with B-A control.
Inhibition of P-gp and Bcrp by Cediranib.
Figure 3 shows the effect of cediranib on the accumulation of [3H]vinblastine, a prototypical P-gp substrate, in MDR1-transfected cells and [3H]prazosin, a prototypical Bcrp substrate, in Bcrp1-transfected cells. Increasing concentrations of cediranib enhanced the intracellular accumulation of vinblastine in the MDR1-transfected cells. Cytotoxicity associated with cediranib restricted the maximum usable cediranib dose to 40 μM. Therefore, we were not able to estimate the IC50 of cediranib for inhibition of P-gp. However, these results clearly show that cediranib inhibits the P-gp-mediated transport of vinblastine. It is noteworthy that cediranib treatment did not increase prazosin accumulation in the Bcrp1-transfected cells, indicating that cediranib does not inhibit Bcrp-mediated efflux, even though it is a substrate for Bcrp.
Fig. 3.

Inhibition of P-gp and Bcrp by cediranib. Accumulation of [3H]vinblastine in MDR1-transfected cells and [3H]prazosin in Bcrp1- transfected cells in the presence of increasing concentrations of cediranib ranging from 0 to 40 μM is shown. Results are presented as mean ± S.D. (n = 4 per group; n = 2 for 40 μM cediranib point).
In Vivo Studies
Cediranib Brain and Plasma Pharmacokinetics.
Because cediranib is administered orally, cediranib pharmacokinetics in plasma and brain were first examined after oral administration in wild-type and Mdr1a/b(−/−)Bcrp1(−/−) mice. Cediranib brain concentrations in the wild-type mice were significantly lower than the plasma concentrations (p < 0.05; Fig. 4A), indicating restricted transport of cediranib across the BBB. In comparison, in the Mdr1a/b(−/−)Bcrp1(−/−) mice, brain concentrations were up to 7-fold higher than plasma concentrations (p < 0.05; Fig. 4B), showing the influence of P-gp and Bcrp on cediranib transport to the brain. There was no significant difference in plasma AUC(0–20 h) between the two genotypes (Table 3), suggesting that P-gp and Bcrp do not influence the absorption or systemic elimination of cediranib at these doses. The AUC in brain was 26-fold greater in the Mdr1a/b(−/−)Bcrp1(−/−) mice compared with the wild type.
Fig. 4.

Cediranib brain and plasma distribution after oral administration. A, cediranib concentrations in brain and plasma in wild-type mice after an oral dose of 5 mg/kg. Brain concentrations were significantly lower than the plasma concentrations, suggesting limited delivery of cediranib across the BBB. Results are expressed as mean ± S.D. (n = 4). *, p < 0.05. B, cediranib concentrations in brain and plasma in Mdr1a/b(−/−)Bcrp1(−/−) mice. Brain concentrations were significantly greater than plasma concentrations, indicating that the absence of P-gp and Bcrp removes the restriction to cediranib brain delivery. Results are expressed as mean ± S.D. (n = 4). *, p < 0.05.
TABLE 3.
Plasma and brain pharmacokinetic parameters determined by noncompartmental analysis after the administration of a single oral dose of cediranib in wild-type mice and Mdr1a/b(−/−) Bcrp1(−/−) mice
Results are expressed as mean ± S.D. (n = 4).
| Parameter | FVB (Wild Type) | Mdr1a/b(−/−)Bcrp1(−/−) |
|---|---|---|
| Tmax, h | 4 | 9 |
| Cmax, ng/ml | 510 | 313 |
| AUCplasma (0-last), h · μg/ml) | 3.9 ± 0.43 | 4.50 ± 0.36 |
| AUCbrain (0-last), h · μg/ml) | 0.85 ± 0.08 | 22.5 ± 0.79 |
| AUCbrain/AUCplasma | 0.21 | 5.02 |
To further investigate whether the limited brain penetration of cediranib is mediated by P-gp or Bcrp or both, brain and plasma pharmacokinetics of cediranib were studied after intravenous injection into wild-type, Mdr1a/b(−/−), Bcrp1(−/−), and Mdr1a/b(−/−)Bcrp1(−/−) mice (Fig. 5). There was no significant difference in the plasma concentrations of cediranib between the four genotypes. The AUC in plasma was 9.2 ± 0.36, 8.4 ± 0.38, 7.6 ± 0.24, and 8.3 ± 0.4 μg · h/ml in the wild-type, Bcrp1(−/−), Mdr1a/b(−/−), and Mdr1a/b(−/−)Bcrp1(−/−) mice, respectively (Table 4). Brain cediranib concentrations were significantly lower than the plasma concentrations, resulting in a ratio of the AUC in brain to AUC in plasma of approximately 0.2 in the wild-type and Bcrp1(−/−) mice (p < 0.05). However, cediranib brain concentrations increased significantly in the Mdr1a/b(−/−) and Mdr1a/b(−/−)Bcrp1(−/−) mice (p < 0.05), such that the AUC ratio was approximately 6 in these two genotypes. This dramatic 30-fold increase in brain distribution of cediranib in the Mdr1a/b(−/−) and Mdr1a/b(−/−)Bcrp1(−/−) mice is indicative of the impact of P-gp on its efflux at the BBB. It is noteworthy that the absence of Bcrp in the Bcrp1(−/−) mice did not result in any significant enhancement in the brain distribution of cediranib. Moreover, there was no significant difference in the brain exposure of cediranib between the Mdr1a/b(−/−) and Mdr1a/b(−/−)Bcrp1(−/−) mice. These in vivo findings, that Bcrp does not influence the delivery of cediranib across the BBB, were unexpected because the in vitro experiments had suggested that cediranib is a substrate for both P-gp and Bcrp. Moreover, these results show that cediranib brain distribution in vivo is limited mainly by P-gp-mediated efflux at the BBB and Bcrp may play a minor role in limiting cediranib distribution to the brain.
Fig. 5.

A to D, cediranib brain and plasma distribution after intravenous administration of a single bolus dose of cediranib in wild-type (A), Bcrp1(−/−) (B), Mdr1a/b(−/−) (C), and Mdr1a/b(−/−)Bcrp1(−/−) (D) mice. Results are expressed as mean ± S.D. (n = 4). *, p < 0.05. E, brain-to-plasma ratio of cediranib in wild-type, Bcrp1(−/−), Mdr1a/b(−/−), and Mdr1a/b(−/−)Bcrp1(−/−) mice. Results are expressed as mean ± S.D. (n = 4).
TABLE 4.
Plasma and brain pharmacokinetic parameters determined by noncompartmental analysis after the administration of a single intravenous bolus dose of cediranib in wild-type, Mdr1a/b(−/−), Bcrp1(−/−), and Mdr1a/b(−/−)Bcrp1(−/−) mice
Results are expressed as mean ± S.D. n = 4.
| Parameter | FVB (Wild Type) | Bcrp1(−/−) Mdr1a/b(−/−) | Mdr1a/b(−/−) | Mdr1a/b(−/−)Bcrp1(−/−) |
|---|---|---|---|---|
| AUCplasma (0-last), h · μg/ml | 9.2 ± 0.36 | 8.40 ± 0.38 | 7.64 ± 0.24 | 8.30 ± 0.40 |
| AUCbrain (0-last), h · μg/ml | 2.45 ± 0.16 | 1.94 ± 0.11 | 48.1 ± 0.80 | 51.1 ± 1.91 |
| AUCbrain/AUCplasma | 0.26 | 0.23 | 6.31 | 6.15 |
Effect of P-gp and Bcrp on Steady-State Brain and Plasma Pharmacokinetics of Cediranib.
The role of P-gp and Bcrp in transporting cediranib out of the brain was also investigated by determining the steady-state brain distribution of cediranib in wild-type, Bcrp1(−/−), Mdr1a/b(−/−), and Mdr1a/b(−/−)Bcrp1(−/−) mice. The brain-to-plasma concentration ratio at steady state (Css,brain/Css,plasma) was compared across the four genotypes (Table 5) after a continuous intraperitoneal infusion for 72 h. This duration of infusion was considered to be sufficient for reaching steady state in both brain and plasma because the half-life of cediranib was determined to be ∼1.8 to 3 h in plasma and ∼3 to 7 h in brain (Table 4). There was no significant difference in steady-state plasma concentration (Css,plasma) or the apparent plasma clearance (CLapp) between the four genotypes, confirming our earlier results that P-gp and Bcrp do not influence the total body clearance of cediranib (Table 5). However, steady-state brain concentrations (Css,brain) of cediranib were pronouncedly enhanced in the Mdr1a/b(−/−) and Mdr1a/b(−/−) Bcrp1(−/−) mice compared with that in wild-type and Bcrp1(−/−) mice. The steady-state brain-to-plasma ratio was ∼21-fold higher in the Mdr1a/b(−/−) and ∼25-fold higher in the Mdr1a/b(−/−)Bcrp1(−/−) mice compared with wild type (p < 0.05). These results are consistent with the AUC ratios seen in both the oral and intravenous pharmacokinetics studies and again confirm the predominant impact of P-gp in limiting brain distribution of cediranib.
TABLE 5.
Steady-state plasma and brain concentrations of cediranib in wild-type, Mdr1a/b(−/−), Bcrp1(−/−), and Mdr1a/b(−/−)Bcrp1(−/−) mice after a continuous intraperitoneal infusion of cediranib at a constant rate of 2 mg/h/kg
Results are expressed as mean ± S.D. (n = 4). Kp ratio is the ratio of steady-state brain-to-plasma concentration ratio in knockout mice to the steady-state brain-to-plasma concentration ratio in wild-type mice.
| Genotype | Apparent Plasma Clearance | Plasma Css | Brain Css | Brain-to-Plasma Ratio | Kp Ratio |
|---|---|---|---|---|---|
| ml/h | μg/ml | μg/g | |||
| FVB (wild type) | 39.9 ± 9.6 | 262 ± 63 | 65 ± 27 | 0.252 ± 0.094 | |
| Bcrp1(−/−) | 44.6 ± 12.3 | 237 ± 67 | 65 ± 22 | 0.274 ± 0.013 | 1.1 |
| Mdr1a/b(−/−) | 44.9 ± 16.5 | 243 ± 72 | 1264 ± 452*† | 5.24 ± 1.10*† | 21 |
| Mdr1a/b(−/−)Bcrp1(−/−) | 41.4 ± 14.5 | 276 ± 128 | 1696 ± 750*† | 6.30 ± 1.23*† | 25 |
P < 0.05 compared with wild type.
P < 0.05 compared with Bcrp1(−/−).
Influence of P-gp and Bcrp Inhibitors on Brain Distribution of Cediranib.
There are generally two in vivo approaches to quantify the magnitude of transporter-mediated drug exclusion from the CNS: one is through the use of transporter-deficient animal models, and the other is through cotreatment of pharmacological modulators of transporter function. Results from the transporter-deficient animal models showed that the brain-to-plasma concentration ratios at 90 min after an oral cediranib dose were 0.14 ± 0.05, 0.16 ± 0.03, 2.20 ± 0.36, and 2.32 ± 0.20 in wild-type, Bcrp1(−/−), Mdr1a/b(−/−), and Mdr1a/b(−/−)Bcrp1(−/−) mice, respectively (Fig. 6A). Concurrent administration of the selective P-gp inhibitors LY335979 and the dual P-gp/Bcrp inhibitor GF120918 resulted in an significant enhancement in brain-to-plasma concentration ratios of cediranib to 2.35 ± 0.89 and 3.15 ± 1.92, respectively (p < 0.05) compared with the vehicle control (0.18 ± 0.02; Fig. 6B). However, similar to what we saw in the Bcrp1(−/−) mice, pretreatment of the Bcrp-specific inhibitor Ko143 had no significant effect on the brain distribution of cediranib in the wild-type mice, with the brain-to-plasma ratio being 0.17 ± 0.07. The pharmacological inhibition recapitulates our findings in the genetic knockouts and confirms that P-gp is the main efflux transporter that limits the brain distribution of cediranib. Coadministration of the pharmacological inhibitors for the two transporter proteins, especially for P-gp, may have the potential to enhance the brain delivery of cediranib.
Fig. 6.

A, brain-to-plasma concentration ratios at 90 min after oral dose of 5 mg/kg cediranib in wild-type, Bcrp1(−/−), Mdr1a/b(−/−), and Mdr1a/b(−/−)Bcrp1(−/−) mice. Results are expressed as mean ± S.D. (n = 4). *, p < 0.05 compared with wild type. †, p < 0.05 compared with Bcrp1(−/−). B, brain-to-plasma concentration ratios at 90 min after oral dose of 5 mg/kg cediranib into the wild-type mice pretreated with 10 mg/kg of the Bcrp inhibitor Ko143, 25 mg/kg of the P-gp inhibitor LY335979, and 10 mg/kg of the dual inhibitor GF120918. Results are expressed as mean ± S.D. (n = 4). *, p < 0.05 compared with vehicle control. †, p < 0.05 compared with Ko143.
Discussion
Cediranib is a potent inhibitor of the VEGFR family and other regulators of tumor growth and angiogenesis such as platelet-derived growth factor receptor and c-KIT that are frequently deregulated in glioblastoma vasculature (Batchelor et al., 2007). Furthermore, cediranib inhibits tumor cell migration and invasion by inhibiting the VEGF/VEGFR autocrine signaling pathways (Morelli et al., 2009). The VEGFR blockade by cediranib may also lead to tumor cell apoptosis (Kamoun et al., 2009). All of these factors made cediranib an attractive option for therapy of brain tumors such as GBM (Batchelor et al., 2007, 2010). However, the antitumor efficacy with cediranib therapy has not been clinically proven (Gerstner et al., 2010). Even though early clinical trials showed promising results in GBM, where cediranib significantly decreased permeability of tumor vasculature, reduced vessel diameter, and led to the alleviation of edema, studies confirmed that there was no reduction in tumor growth. This clinical failure of cediranib can be attributed to the pathological infiltrative characteristics of GBM as well as the inability of cediranib to reach its target. Glioma is a very infiltrative brain tumor with tumor cells spreading to areas centimeters away from the primary tumor core. These invasive cells may reside in areas that are protected by an intact BBB and thus remain shielded from anticancer therapeutics. We hypothesize that the restricted delivery of cediranib to its target sites (brain tumor endothelial cells and invasive glioma cells) in the brain might be one of possible reasons for its failure in GBM therapy. Therefore, the aim of the current study was to investigate the delivery of cediranib across the BBB into the brain. We examined the interaction of cediranib with two dominant active efflux transporters at the BBB, P-gp and Bcrp, and have shown that delivery of cediranib into the brain is limited mainly by P-gp-mediated efflux at the BBB.
In vitro accumulation and directional transport studies showed that cediranib is a substrate for both P-gp and Bcrp. Inhibition of P-gp and Bcrp increased the restricted intracellular accumulation of cediranib in the transporter-overexpressing cell lines to levels similar to that in the wild-type cells (Fig. 1). It is noteworthy that cediranib inhibited P-gp mediated efflux but not Bcrp (Fig. 3). These findings are clinically relevant because inhibition of P-gp by cediranib may alter tissue pharmacokinetics of concurrently administered drugs that are substrates for P-gp. The finding that cediranib is transported by Bcrp, but does not inhibit the Bcrp-mediated efflux transport of substrates, like prazosin, is similar to the behavior of another TKI, sorafinib, as reported by Agarwal et al. (2011b). It is possible that cediranib, similar to sorafenib, might be transported by Bcrp by binding to a site that is different from the prazosin binding site. Giri et al. (2008) first postulated the presence of multiple binding sites on Bcrp. This finding further provides credence to this hypothesis and warrants further research in this area.
The in vitro studies suggested that cediranib is a substrate for both P-gp and Bcrp. We therefore studied the brain distribution of cediranib in FVB mice to examine the effect of these transporters on its transport across the BBB. Cediranib concentrations in brain were compared among the wild-type, Mdr1a/b(−/−), Bcrp1(−/−), and Mdr1a/b(−/−)Bcrp1(−/−) mice. Upon oral administration in wild-type mice, cediranib brain concentrations were on average 5-fold lower than plasma concentrations, indicating the limited partitioning of cediranib into the brain (Fig. 4A). Absence of P-gp and Bcrp at the BBB dramatically enhanced cediranib brain partitioning such that concentrations in brain were ∼4-fold greater than that in plasma (Fig. 4B). This confirmed that cediranib was effluxed at the BBB by P-gp and/or Bcrp. Tween 80 (1%; w/v) was used as dosing vehicle for oral administration. Because all strains were dosed with the same vehicle, comparisons based on the same dosing formulation are reasonable. To understand the impact of influence individual transporter (P-gp or Bcrp) on cediranib brain penetration, brain partitioning was determined after intravenous dosing in the four mouse genotypes. In the wild-type and Bcrp1(−/−) mice, the AUC in brain was ∼4-fold lower than the AUC in plasma (Table 4). Similar brain partitioning in these two mouse genotypes indicated that Bcrp does not restrict the delivery of cediranib across the BBB. Cediranib AUC in the brain in the Mdr1a/b(−/−) and Mdr1a/b(−/−)Bcrp1(−/−) mice was ∼20-fold higher than that in wild-type and Bcrp1(−/−) mice (Fig. 5; Table 4). There was no significant difference in brain partitioning of cediranib between the Mdr1a/b(−/−) and Mdr1a/b(−/−)Bcrp1(−/−) mice. The finding that that there was no additional increase in brain partitioning of cediranib in the Mdr1a/b(−/−)Bcrp1(−/−) mice shows that P-gp-mediated efflux at the BBB predominantly restricts brain delivery of cediranib and Bcrp does not play a significant role in limiting the CNS distribution of cediranib. This is in contrast to the in vitro studies that indicated cediranib was a substrate for both P-gp and Bcrp.
To date, there are several published studies that report a possible cooperation of P-gp and Bcrp in restricting the delivery of TKIs across the BBB. This has been shown for imatinib (Breedveld et al., 2005), dasatinib (Chen et al., 2009), gefitinib (Agarwal et al., 2010), lapatinib (Polli et al., 2009), erlotinib (Kodaira et al., 2010), and sunitinib (Tang et al., 2012). Most of these studies reported a greater than proportional increase in brain distribution when both P-gp and Bcrp are absent in the Mdr1a/b(−/−)Bcrp1(−/−) mice. Many of these studies also suggested that P-gp was the dominant transporter at the BBB in limiting the brain uptake of substrate drugs. Cediranib is different from other TKIs in that the in vivo studies suggest that P-gp and Bcrp do not have a combined effect on its brain distribution. There is no difference between the brain distribution between the Mdr1a/b(−/−) and Mdr1a/b(−/−)Bcrp1(−/−) mice and between the wild-type and Bcrp1(−/−) mice, suggesting that Bcrp does not efflux cediranib at the BBB. We had hypothesized in our previous studies that a higher expression of P-gp compared with Bcrp may be the reason behind the subdued effect of Bcrp-mediated efflux at the BBB (Agarwal et al., 2011b). Kamiie et al. (2008) showed that there is 5-fold lower expression of Bcrp protein at the murine BBB than P-gp. This may in part explain the lack of Bcrp-mediated efflux of cediranib at the BBB.
The finding that inhibition of P-gp enhanced brain penetration of cediranib (Fig. 6B) has significant clinical implications. Concurrent use of the P-gp-specific inhibitor LY335979 or the dual inhibitor GF120918 was able to increase brain distribution of cediranib to levels similar to those seen in the knockouts (Fig. 6A). This indicates that chemical modulation of efflux transporters, mainly P-gp, can be used as a promising therapeutic strategy to enhance cediranib distribution to the brain. This might improve the clinical efficacy of cediranib for the treatment of brain tumors.
Glioblastoma multiforme is one of the most formidable challenges faced by the neuro-oncology community. The ability of glioma cells to migrate and promote angiogenesis makes treatment of GBM challenging and demands further investigation of novel therapies that target these processes, such as cediranib. The constraint to deliver drugs across the blood-brain barrier has prevented easy application of potent, peripherally active drugs against this tumor. Cediranib, like many other TKIs, is effluxed by P-gp at the BBB. This is a critical finding that can influence the delivery and thus efficacy of cediranib in the brain tumor.
In conclusion, we have shown that cediranib is a substrate of active efflux transporters P-gp and Bcrp in vitro but only P-gp plays a critical role in limiting brain delivery of cediranib. Efficacy of cediranib against glioma may depend on the ability of cediranib to achieve therapeutic concentrations in brain tumor endothelial cells and the invasive glioma cells. This study shows that use of potent inhibitors for P-gp such as GF120918 may enhance delivery of cediranib to the brain.
Acknowledgments
We thank Jim Fisher (Clinical Pharmacology Analytical Services, University of Minnesota) for help in the development of the cediranib LC-MS/MS assay.
This work was supported in part by the National Institutes of Health National Cancer Institute [Grant CA138437] and the Children's Cancer Research Fund at the University of Minnesota (to W.F.E.). Financial support for T.W. was provided by a Ronald J. Sawchuk Fellowship in Pharmacokinetics from the Department of Pharmaceutics, University of Minnesota. Financial support for S.A. was provided by a doctoral dissertation fellowship from the University of Minnesota.
Article, publication date, and citation information can be found at http://jpet.aspetjournals.org.
- BBB
- blood-brain barrier
- CNS
- central nervous system
- ABC
- ATP-binding cassette
- FVB
- friend leukemia virus strain B
- P-gp
- P-glycoprotein
- Bcrp
- breast cancer resistance protein
- TKI
- tyrosine kinase inhibitor
- VEGF
- vascular endothelial growth factor
- VEGFR
- VEGF receptor
- AZD2171 (cediranib)
- 4-[(4-fluoro-2-methyl-1H-indol-5-yl)oxy]-6-methoxy-7-[3-(pyrrolidin-1-yl)propoxy]quinazoline
- LY335979 (zosuquidar)
- (R)-4-((1aR,6R,10bS)-1,2-difluoro-1,1a,6,10btetrahydrodibenzo-(a,e)cyclopropa(c)cycloheptan-6-yl)-α-((5-quinoloyloxy)methyl)-1-piperazine ethanol, trihydrochloride
- Ko143
- (3S,6S,12aS)-1,2,3,4,6,7,12,12a-octahydro-9-methoxy-6-(2-methylpropyl)-1,4-dioxopyrazino[1′,2′:1,6]pyrido[3,4-b]indole-3-propanoic acid 1,1-dimethylethyl ester
- GF120918 (elacridar)
- N-(4-[2-(6,7-dimethoxy-3,4-dihydro-1H-isoquinolin-2-yl)ethyl]-5-methoxy-9-oxo-10H-acridine-4-carboxamide
- HPLC
- high-performance liquid chromatography
- MS/MS
- tandem mass spectrometry
- AG1478 (tyrphostin)
- 4-(3-chloroanilino)-6,7-dimethoxyquinazoline
- DMSO
- dimethyl sulfoxide
- AUC
- area under the curve
- B
- basolateral
- A
- apical
- GBM
- glioblastoma multiforme
- MDCK
- Madin-Darby canine kidney.
Authorship Contributions
Participated in research design: Wang and Elmquist.
Conducted experiments: Wang and Agarwal.
Contributed new reagents or analytic tools: Wang.
Performed data analysis: Wang and Elmquist.
Wrote or contributed to the writing of the manuscript: Wang, Agarwal, and Elmquist.
References
- Agarwal S, Sane R, Gallardo JL, Ohlfest JR, Elmquist WF. (2010) Distribution of gefitinib to the brain is limited by P-glycoprotein (ABCB1) and breast cancer resistance protein (ABCG2)-mediated active efflux. J Pharmacol Exp Ther 334:147–155 [DOI] [PMC free article] [PubMed] [Google Scholar]
- Agarwal S, Sane R, Oberoi R, Ohlfest JR, Elmquist WF. (2011a) Delivery of molecularly targeted therapy to malignant glioma, a disease of the whole brain. Expert Rev Mol Med 13:e17. [DOI] [PMC free article] [PubMed] [Google Scholar]
- Agarwal S, Sane R, Ohlfest JR, Elmquist WF. (2011b) The role of the breast cancer resistance protein (ABCG2) in the distribution of sorafenib to the brain. J Pharmacol Exp Ther 336:223–233 [DOI] [PMC free article] [PubMed] [Google Scholar]
- Batchelor TT, Duda DG, di Tomaso E, Ancukiewicz M, Plotkin SR, Gerstner E, Eichler AF, Drappatz J, Hochberg FH, Benner T, et al. (2010) Phase II study of cediranib, an oral pan-vascular endothelial growth factor receptor tyrosine kinase inhibitor, in patients with recurrent glioblastoma. J Clin Oncol 28:2817–2823 [DOI] [PMC free article] [PubMed] [Google Scholar]
- Batchelor TT, Sorensen AG, di Tomaso E, Zhang WT, Duda DG, Cohen KS, Kozak KR, Cahill DP, Chen PJ, Zhu M, et al. (2007) AZD2171, a pan-VEGF receptor tyrosine kinase inhibitor, normalizes tumor vasculature and alleviates edema in glioblastoma patients. Cancer Cell 11:83–95 [DOI] [PMC free article] [PubMed] [Google Scholar]
- Breedveld P, Pluim D, Cipriani G, Wielinga P, van Tellingen O, Schinkel AH, Schellens JH. (2005) The effect of Bcrp1 (Abcg2) on the in vivo pharmacokinetics and brain penetration of imatinib mesylate (Gleevec): implications for the use of breast cancer resistance protein and P-glycoprotein inhibitors to enable the brain penetration of imatinib in patients. Cancer Res 65:2577–2582 [DOI] [PubMed] [Google Scholar]
- Carmeliet P, Jain RK. (2000) Angiogenesis in cancer and other diseases. Nature 407:249–257 [DOI] [PubMed] [Google Scholar]
- Chen Y, Agarwal S, Shaik NM, Chen C, Yang Z, Elmquist WF. (2009) P-glycoprotein and breast cancer resistance protein influence brain distribution of dasatinib. J Pharmacol Exp Ther 330:956–963 [DOI] [PubMed] [Google Scholar]
- Dai H, Marbach P, Lemaire M, Hayes M, Elmquist WF. (2003) Distribution of STI-571 to the brain is limited by P-glycoprotein-mediated efflux. J Pharmacol Exp Ther 304:1085–1092 [DOI] [PubMed] [Google Scholar]
- Demeule M, Régina A, Annabi B, Bertrand Y, Bojanowski MW, Béliveau R. (2004) Brain endothelial cells as pharmacological targets in brain tumors. Mol Neurobiol 30:157–183 [DOI] [PubMed] [Google Scholar]
- Gerstner ER, Chen PJ, Wen PY, Jain RK, Batchelor TT, Sorensen G. (2010) Infiltrative patterns of glioblastoma spread detected via diffusion MRI after treatment with cediranib. Neuro Oncol 12:466–472 [DOI] [PMC free article] [PubMed] [Google Scholar]
- Giri N, Shaik N, Pan G, Terasaki T, Mukai C, Kitagaki S, Miyakoshi N, Elmquist WF. (2008) Investigation of the role of breast cancer resistance protein (Bcrp/Abcg2) on pharmacokinetics and central nervous system penetration of abacavir and zidovudine in the mouse. Drug Metab Dispos 36:1476–1484 [DOI] [PMC free article] [PubMed] [Google Scholar]
- Hormigo A, Ding BS, Rafii S. (2011) A target for antiangiogenic therapy: vascular endothelium derived from glioblastoma. Proc Natl Acad Sci U S A 108:4271–4272 [DOI] [PMC free article] [PubMed] [Google Scholar]
- Huang H, Held-Feindt J, Buhl R, Mehdorn HM, Mentlein R. (2005) Expression of VEGF and its receptors in different brain tumors. Neurol Res 27:371–377 [DOI] [PubMed] [Google Scholar]
- Institute of Laboratory Animal Resources (1996) Guide for the Care and Use of Laboratory Animals, 7th ed Institute of Laboratory Animal Resources, Commission on Life Sciences, National Research Council, Washington, DC [Google Scholar]
- Kamiie J, Ohtsuki S, Iwase R, Ohmine K, Katsukura Y, Yanai K, Sekine Y, Uchida Y, Ito S, Terasaki T. (2008) Quantitative atlas of membrane transporter proteins: development and application of a highly sensitive simultaneous LC/MS/MS method combined with novel in-silico peptide selection criteria. Pharm Res 25:1469–1483 [DOI] [PubMed] [Google Scholar]
- Kamoun WS, Ley CD, Farrar CT, Duyverman AM, Lahdenranta J, Lacorre DA, Batchelor TT, di Tomaso E, Duda DG, Munn LL, et al. (2009) Edema control by cediranib, a vascular endothelial growth factor receptor-targeted kinase inhibitor, prolongs survival despite persistent brain tumor growth in mice. J Clin Oncol 27:2542–2552 [DOI] [PMC free article] [PubMed] [Google Scholar]
- Kodaira H, Kusuhara H, Ushiki J, Fuse E, Sugiyama Y. (2010) Kinetic analysis of the cooperation of P-glycoprotein (P-gp/Abcb1) and breast cancer resistance protein (Bcrp/Abcg2) in limiting the brain and testis penetration of erlotinib, flavopiridol, and mitoxantrone. J Pharmacol Exp Ther 333:788–796 [DOI] [PubMed] [Google Scholar]
- Kuratsu J, Itoyama Y, Uemura S, Ushio Y. (1989) [Regrowth patterns of glioma–cases of glioma regrew away from the original tumor]. Gan No Rinsho 35:1255–1260 [PubMed] [Google Scholar]
- Lee YJ, Kusuhara H, Jonker JW, Schinkel AH, Sugiyama Y. (2005) Investigation of efflux transport of dehydroepiandrosterone sulfate and mitoxantrone at the mouse blood-brain barrier: a minor role of breast cancer resistance protein. J Pharmacol Exp Ther 312:44–52 [DOI] [PubMed] [Google Scholar]
- Lucio-Eterovic AK, Piao Y, de Groot JF. (2009) Mediators of glioblastoma resistance and invasion during antivascular endothelial growth factor therapy. Clin Cancer Res 15:4589–4599 [DOI] [PubMed] [Google Scholar]
- Morelli MP, Brown AM, Pitts TM, Tentler JJ, Ciardiello F, Ryan A, Jürgensmeier JM, Eckhardt SG. (2009) Targeting vascular endothelial growth factor receptor-1 and -3 with cediranib (AZD2171): effects on migration and invasion of gastrointestinal cancer cell lines. Mol Cancer Ther 8:2546–2558 [DOI] [PMC free article] [PubMed] [Google Scholar]
- Polli JW, Olson KL, Chism JP, John-Williams LS, Yeager RL, Woodard SM, Otto V, Castellino S, Demby VE. (2009) An unexpected synergist role of P-glycoprotein and breast cancer resistance protein on the central nervous system penetration of the tyrosine kinase inhibitor lapatinib (N-{3-chloro-4-[(3-fluorobenzyl)oxy]phenyl}-6-[5-({[2-(methylsulfonyl)ethy l]amino}methyl)-2-furyl]-4-quinazolinamine; GW572016). Drug Metab Dispos 37:439–442 [DOI] [PubMed] [Google Scholar]
- Ramalingam SS, Belani CP, Mack PC, Vokes EE, Longmate J, Govindan R, Koczywas M, Ivy SP, Gandara DR. (2010) Phase II study of Cediranib (AZD 2171), an inhibitor of the vascular endothelial growth factor receptor, for second-line therapy of small cell lung cancer (National Cancer Institute #7097). J Thorac Oncol 5:1279–1284 [DOI] [PMC free article] [PubMed] [Google Scholar]
- Satoh T, Yamaguchi K, Boku N, Okamoto W, Shimamura T, Yamazaki K, Shi X, Mishima H. (2011) Phase I results from a two-part Phase I/II study of cediranib in combination with mFOLFOX6 in Japanese patients with metastatic colorectal cancer. Invest New Drugs http://dx.doi.org/10.1007/s10637-011-9693-6 [DOI] [PubMed]
- Sikkema AH, de Bont ES, Molema G, Dimberg A, Zwiers PJ, Diks SH, Hoving EW, Kamps WA, Peppelenbosch MP, den Dunnen WF. (2011) Vascular endothelial growth factor receptor 2 (VEGFR-2) signalling activity in paediatric pilocytic astrocytoma is restricted to tumour endothelial cells. Neuropathol Appl Neurobiol 37:538–548 [DOI] [PubMed] [Google Scholar]
- Silbergeld DL, Chicoine MR. (1997) Isolation and characterization of human malignant glioma cells from histologically normal brain. J Neurosurg 86:525–531 [DOI] [PubMed] [Google Scholar]
- Tang SC, Lagas JS, Lankheet NA, Poller B, Hillebrand MJ, Rosing H, Beijnen JH, Schinkel AH. (2012) Brain accumulation of sunitinib is restricted by P-glycoprotein (ABCB1) and breast cancer resistance protein (ABCG2) and can be enhanced by oral elacridar and sunitinib coadministration. Int J Cancer 130:223–233 [DOI] [PubMed] [Google Scholar]
- Wang T, Oberoi RK, Elmquist WF. (2011) Determination of cediranib in mouse plasma and brain tissue using high-performance liquid chromatography-mass spectrometry, J Chromatogr B Analyt Technol Biomed Life Sci 879:3812–3817 [DOI] [PMC free article] [PubMed] [Google Scholar]
- Zhao R, Raub TJ, Sawada GA, Kasper SC, Bacon JA, Bridges AS, Pollack GM. (2009) Breast cancer resistance protein interacts with various compounds in vitro, but plays a minor role in substrate efflux at the blood-brain barrier. Drug Metab Dispos 37:1251–1258 [DOI] [PMC free article] [PubMed] [Google Scholar]