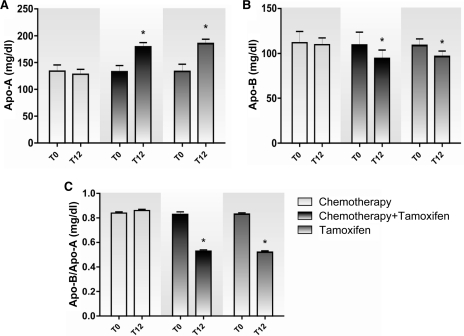
Figure 4.
Plasma concentrations of Apo-A (A), Apo-B (B), and the Apo-B/Apo-A ratio (C) in the groups treated with chemotherapy alone, chemotherapy followed by tamoxifen, and tamoxifen alone.
*p < .01 compared with the beginning (T0).
Abbreviations: Apo-A, apolipoprotein A-1; Apo-B, apolipoprotein B-100; T, time.

