Abstract
Insight into the O2 quenching mechanism of a photosensitizer (static or dynamic) would be useful for the design of heterogeneous systems to control the mode of generation of 1O2 in water. Here, we describe the use of a photosensitizer, meso-tetra(N-methyl-4-pyridyl)porphine (1), which was adsorbed onto porous Vycor glass (PVG). A maximum loading of 1.1 × 10⁻⁶ mol 1 per g PVG was achieved. Less than 1% of the PVG surface was covered with photosensitizer 1, and the penetration of 1 reaches a depth of 0.32 mm along all faces of the glass. Time-resolved measurements showed that the lifetime of triplet 1*-ads was 57 µs in water. Triplet O2 quenched the transient absorption of triplet 1*-ads; for samples containing 0.9 × 10⁻⁶–0.9 × 10⁻⁸ mol 1 adsorbed per g PVG, the Stern–Volmer constant, KD, ranged from 23 700 to 32 100 M−1. The adduct formation constant, KS, ranged from 1310 to 510 M−1. The amplitude of the absorption at 470 nm decreased slightly (by about 0.1) with increased O2 concentrations. Thus, the quenching behavior of triplet 1*-ads by O2 was proposed to be strongly dependent on dynamic quenching. Only ~10% of the quenching was attributed to the static quenching mechanism. The quenching of triplet 1*-ads was similar to that observed for photosensitizers in homogeneous solution which are often quenched dynamically by O2.
1. Introduction
Heterogeneous materials have been studied for many years, and chemists discovered that some could be used as supports for the generation of singlet oxygen [1O2(1Δg)].1–1e Recently, we reported that meso-tetra(N-methyl-4-pyridyl)porphine (1) adsorbed onto porous Vycor glass (PVG), in which a pH decrease of the surrounding solution indicated the displacement of protons from the surface silanol groups via cation exchange (Scheme 1).2 Singlet oxygen was generated cleanly in aqueous solution upon irradiation of this heterogeneous sensitizer, 1-ads.2
SCHEME 1.
Adsorption of Photosensitizer 1 onto the PVG Surface and Production of Singlet Oxygen
Despite the effectiveness of this and other heterogeneous systems to generate 1O2, surprisingly little is known about the mechanism of sensitizer quenching by O2 at water–solid interfaces. For example, how does the oxygen encounter the excited PVG heterogeneous sensitizer? What mechanism (static or dynamic) converts ground-state O2 into 1O2, which then diffuses into the bulk solution?
Some detail of the O2 quenching process may be gleaned from previous studies of gas–solid systems. These studies often indicate the static quenching of O2–where a ground-state O2 adduct is formed at the surface–rather than a dynamic encounter of O2 with the surface. At the gas–solid interface, Gafney showed that photoexcited Ru(bpy)32+-adsorbed to PVG statically quenches O2,3 Avnir showed that photoexcited Ru(bpy)32+-adsorbed to porous silica and porous glass statically quench O2 at low temperatures, but dynamically quench O2 at high temperatures,4 and Thomas showed that aromatic compounds adsorbed onto nonporous glass statically quench O2.5,6 Pore size of silica-adsorbed photosensitizers can be tailored to statically or dynamically quench O2 in gas–solid systems.7,8
Few studies have examined sensitizer quenching by O2 at organic solvent–solid interfaces9 or water–solid interfaces.10 Despite reports on 1O2 production (ΦΔ) and 1O2 lifetimes (τΔ) in homogeneous aqueous media, Nafion membranes,11 micellar media,12 water-soluble supramolecular hosts,13 or aqueous reactions using TiO2,14 studies of the quenching mechanism of heterogeneous photosensitizers by O2 at the water–solid interface are uncommon and are in need of elaboration.
We report here a photophysical analysis of how O2 quenches 31* at the water–PVG interface. We also examined the effects of surface loading and percent coverage of the photosensitizer and the depth that 1 can penetrate into the PVG material. An assessment of the quenching of the photosensitizer (static or dynamic) could help in the design of heterogeneous systems that attempt to control the exact mode of generation of 1O2 in water.
2. Experimental Section
2.1. Materials and Sample Preparation
Deionized H2O was obtained from a U.S. Filter Corp. deionization system. meso-Tetra(N-methyl-4-pyridyl)porphine tetratosylate was purchased commercially and used as received. The PVG was used as a host material and was purchased from Advanced Glass and Ceramics (Corning 7930). The PVG has a void space of ~28% of the volume, average pore sizes of 40 Å, a hydrophilic absorbing surface area of 250 m2/g, a density of 1.38 g/mL, and transparency in the near-UV (50% T at 351 nm), visible, and parts of the near-IR.15 Pieces of PVG (1.5 cm × 1.5 cm; thickness: 1.15–1.53 mm) were heated in a muffle furnace at 500 °C and stored in a desiccator under vacuum at 30 mmHg. The photosensitizer-coated PVG was prepared by soaking 1.4 g of PVG into a 20 mL 3.7 × 10⁻⁵ M aqueous solution of 1 for 15–64 h. The amount of 1 adsorbed onto PVG was calculated from the difference in absorbance of the solution before introduction of PVG and the absorbance of the same solution after the removal of PVG.2,16 For the transient absorption studies, PVG was cut such that each piece fits diagonally into a 1 cm path-length quartz cuvette. Each PVG/1 sample was placed into the quartz cuvette, which contained deionized water, and was sparged with N2 gas for 20 min. Any bubbles that stuck onto the PVG surface were removed by sonication for a few seconds. Some PVG samples (1.5 cm × 1.5 cm; thickness: 1.53 mm) were cut into 0.3 cm × 1.5 cm pieces and photographed with a microscope.
2.2. Instruments
Photographic images were taken with a Nikon TE200 microscope equipped with an Orca 100 monochrome charge-coupled device (CCD) camera and a Hamamatsu camera controller (C474295). The light source used was a 100 W mercury arc lamp. The objective used was a Plan Apo 60×Oil DIC. Images were recorded and analyzed with Cam-Media software.17 Absorption spectra were collected with a Hitachi UV–vis U-2001, a Hewlett-Packard 8453 diode array, or a Varian Carey 14 spectrophotometer. In some experiments with the Carey 14 instrument, the Q-bands of 1 at 525, 552, 585, and 640 nm were followed because the intense Soret band at 422 nm gave absorbances of 2.5 or greater, which saturated the UV–vis detector. A Quantel Brilliant B Nd:YAG laser (417 nm, 0.6–1.6 mJ/pulse) was used in the transient absorption experiments.18,19
2.3. Transient Absorption Spectroscopy
The PVG samples used in these experiments contained 0.9 × 10⁻⁸–1.1 × 10⁻⁶ mol 1/g PVG. Room-temperature time-resolved measurements were conducted as previously described.20 The PVG samples were excited at 417 nm but oriented so that reflected laser light was directed at a 45° angle away from the detector on the transient absorption apparatus. Each kinetic trace is an average of 64 laser pulses. The triplet of 1-ads was monitored at 470 nm, in which a 435 nm long pass filter was placed in front of the detector monochromator to block scattered laser light. The data points in the transient absorption experiments were collected every 10 nm from 450 to 550 nm. An MKS Instruments multigas controller (MKS 647C) was used to control the flow of O2 and N2 through two MKS Instruments flow controllers. The flow controllers were set for a flow rate of 100 standard cubic centimeters per minute (sscm). Gas correction factors (GCFs) programmed into the MGC were utilized to correct for specific heat, density, and molecular structure of O2 and N2. The samples were purged with different ratios of an O2:N2 stream of gas for 5 min before each kinetic trace was taken. The oxygen concentration of a solution bubbled with the O2:N2 gas stream were determined by using Henry’s law.21,22
2.4. Computational Methods
Density function theoretical (DFT) calculations were conducted by the exchange-correlation of B3LYP along with Pople basis set 6–31G(d) with the use of the Gaussian 03 program package.23 The solvent accessible surface was computed by the method of Lee and Richards.24
3. Results and Discussion
3.1. Time-Dependent Adsorption of Photosensitizer onto PVG
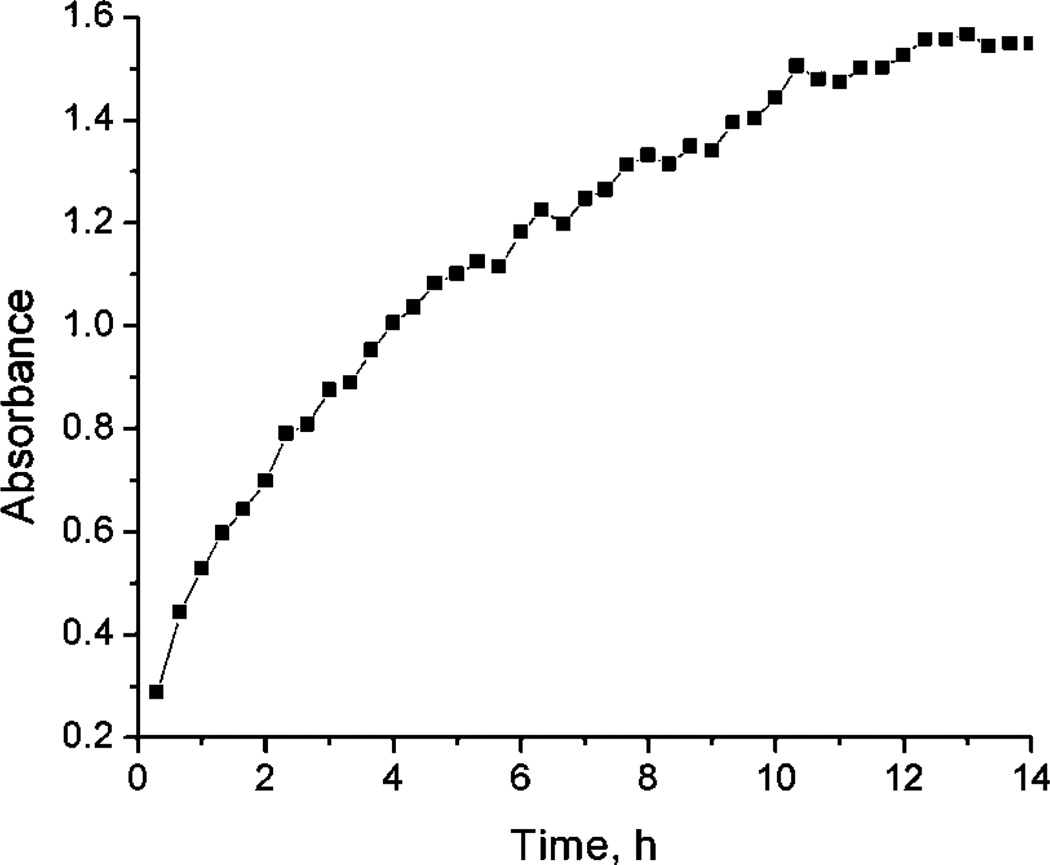
A clean piece of PVG placed into an aqueous solution containing 1 led to the adsorption of 1 onto PVG. Figure 1 shows the time-dependent adsorption of 1 onto PVG over a 15 h period. The adsorption process was followed by monitoring the largest of the four Q-bands of 1-ads at λ = 525 nm. A plateau is reached when there is 8.8 × 10⁻⁷ mol 1 adsorbed onto 1 g PVG. Loadings of 1.1 × 10⁻⁶ mol 1 onto PVG can be achieved, but only after a 48–72 h period. Once the 1-ads samples contained the desired surface coverage, they were rinsed with distilled water prior to use.
Figure 1.
Adsorption of a PVG sample at λ = 525 nm that was sitting in a solution containing 1. The PVG sample was removed at the indicated times. The plateau region at 14 h corresponds to 8.83 × 10⁻⁷ mol 1 adsorbed onto 1 g PVG.
3.2. Uniform Photosensitizer Distribution
Absorption spectra were recorded at different points on the PVG film to analyze the dispersal of adsorbed 1. The Q-band absorptions (475–700 nm) are found to be identical to within 0.01 absorbance unit, suggesting that the distribution of 1 is uniform; thus, the surface coverage of 1 adsorbed onto PVG could then be estimated. Two methods were used to determine the surface coverage of 1 adsorbed onto PVG. Both are in qualitative agreement with each other: (1) The amount of uncoated PVG was determined by subtracting 1.0 g of PVG from (8.83 × 10⁻⁷ mol 1/g PVG × 679.61 g/mol 1), which is 0.9994 g. Dividing 8.83 × 10⁻⁷ mol 1/g PVG into (0.9994 g uncoated PVG × 250 m2/g PVG) yielded 3.5 × 10⁻⁹ mol 1/m2, indicating that 0.35% of the PVG surface is covered by 1. (2) Surface coverage was determined by a calculation, in which porphyrin 1 is taken as a rectangular shape (22.2 Å × 22.2 Å × 7.3 Å) multiplied by (8.83 × 10⁻⁷ mol 1/g PVG × 6.02 × 10²³ molecules/mol × 10−21 mm3/Å3), which equals 1.91 mm3/g PVG. The rectangular shape of 1 was estimated on the basis of the B3LYP/6–31G(d) optimized structure and the corresponding solvent accessible contour map (Figure 2), in which the pyridinium rings are nearly orthogonal to the plane of the porphyrin (67°). The corresponding weight of 1-adsorbed PVG (1.91 mm3 × 1.38 g PVG/mL) equals 2.64 g PVG. Therefore, the surface coverage of 1 onto PVG was calculated by taking [8.83 × 10⁻⁷ mol 1/(2.64 g PVG × 250 m2/g PVG)] or 1.4 × 10⁻⁹ mol 1/m2, yielding 0.13% PVG surface coverage by 1. Both calculations [(1) and (2), vide supra] indicated that <1% of the PVG surface is covered with the photosensitizer 1. For comparison, the surface coverage of Ru(bpy)32+ on PVG is <1%,3 on porous silica is ~6%, and on porous glass is ~10%.4
Figure 2.
Rectangular shape of 1 (left) estimated from a B3LYP/6–31G(d) optimized structure and the corresponding computed solvent accessible map (right).
3.3. Photosensitizer Penetration Depth
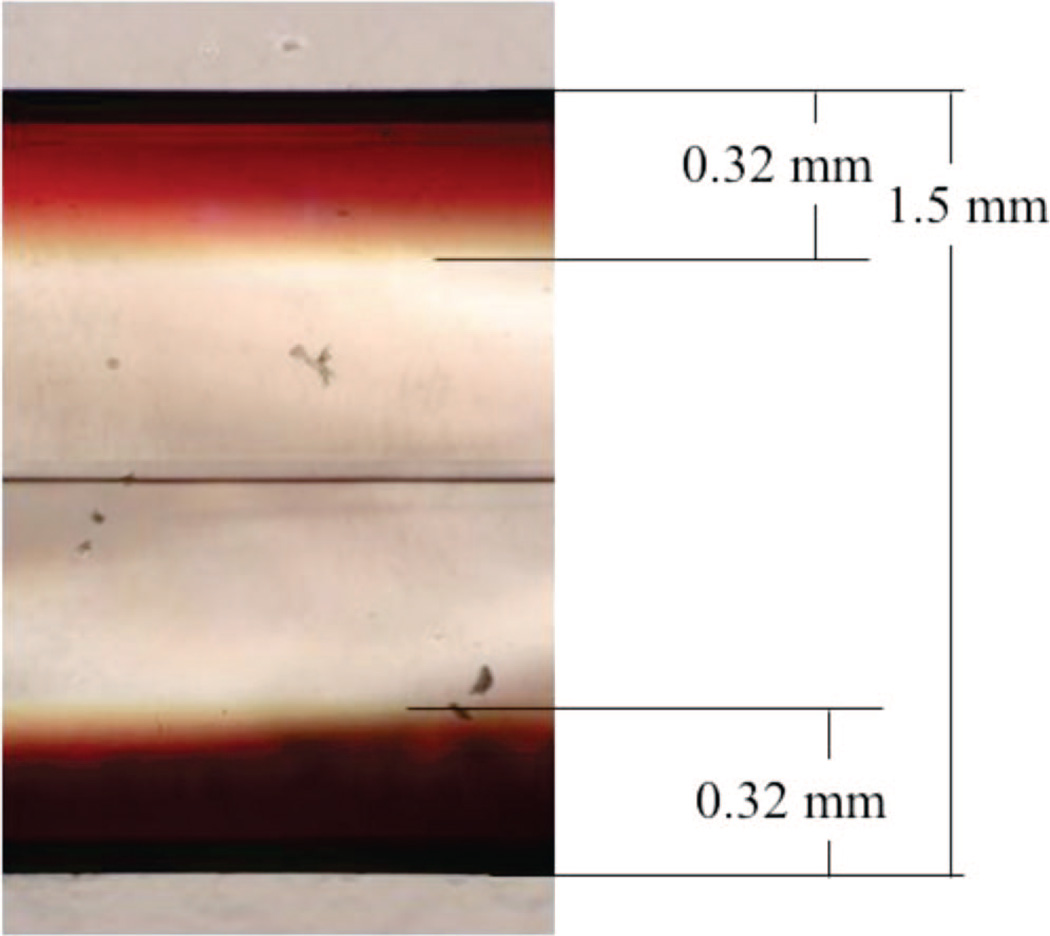
The depth that 1 can penetrate into PVG was examined using a microscope equipped with a CCD camera. Figure 3 shows a 1.5 mm thick (sensitizer coated) PVG sample, cut so that the depth of 1 penetrated into PVG could be viewed. The microscope image shows the penetration of 1 reaches a maximum depth of 0.32 mm along all faces of the sample, which corresponds to the plateau region of 8.8 × 10⁻⁷ mol 1/g PVG (Figure 1). Although O2 and other gases are permeable and can pass through the connected pores of PVG,25 1 neither penetrates to the center of the PVG film nor is 1 localized on the outer surface of PVG. A 10-fold mole increase of 1 resulted in only a 4-fold local increase in sensitizer distribution into PVG [cf. 0.9 × 10⁻⁶ mol 1 (penetration depth 0.32 mm) and 0.9 × 10⁻⁷ mol 1 adsorbed onto 1 g PVG (penetration depth 0.09 mm)]. Oxygen is expected to reach the excited sites of 1-ads, controlled by Knudsen diffusion, in which O2 collides numerous times within the pore walls, eventually proceeding through the PVG channels. For comparison, Ru(bpy)32+ penetrates 0.5 ± 0.1 mm into PVG.3 Streptocyanine dyes also possessed diffusivity into silica gels, influenced by the gel porosities.26
Figure 3.
A low-magnification (60×) cross-sectional optical image. The red areas indicate the depth of 1 accessed into PVG. The image shows 0.32 mm penetration depth on each face for 0.9 × 10⁻⁶ mol 1 adsorbed onto a 1.5 mm PVG sample. The horizontal line in the middle of the PVG sample corresponds to where two glass layers meet due to the commercial fabrication process.
3.4. Spectral Properties
Previously, we reported that the spectral features of 1-ads are nearly identical to 1 in fluid water solution.2 Here, we report the spectral features measured at different concentrations of 1 adsorbed onto PVG.
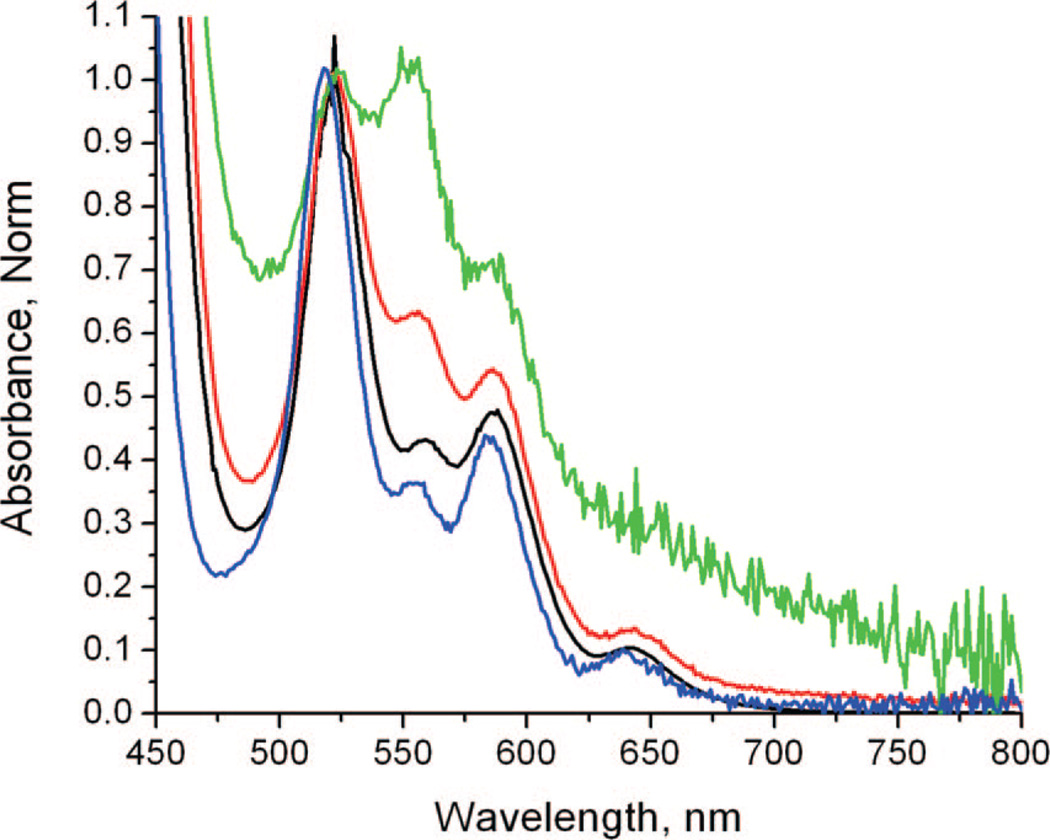
Figure 4 shows absorption spectra of 1 in water and 1 adsorbed onto PVG. While the effect of higher coverage dose of 1 produces neither red shifts nor blue shifts in the Q-bands, the adsorption of 1 on PVG leads to an unexpected effect on the absorption intensity. Higher coverages of 1 adsorbed onto PVG led to a decrease of the Q-band absorption intensity, (cf. 0.9 × 10⁻⁸, 0.9 × 10⁻⁷, and 0.9 × 10⁻⁶ mol 1/g PVG). At higher surface coverage, the absorption spectrum of 1-ads becomes somewhat similar to that of 1 in aqueous solution (cf. spectra in blue and black, Figure 4). Deducing a possible orientational effect of the porphyrin on the PVG surface is challenging based upon these normalized absorption spectra. Polarization effects are known for porphyrins result in symmetric changes of all the S0 → S1 transitions. However, atomic-level detail is unavailable for PVG and how it may relate to the conformation of adsorbed 1. Interestingly, recent studies have shown a reduced hydrating ability of ~2.2 H-bonds per water molecule confined in PVG pores compared bulk water with~3.6 H-bonds per water molecule, pointing to the importance for confinement effects.27,28
Figure 4.
Absorption spectra of 1 in water (blue line) and 1-ads at different loadings: 0.9 × 10⁻⁸ (green line), 0.9 × 10⁻⁷ (red line), and 0.9 × 10⁻⁶ (black line) mol of 1 adsorbed on PVG. The spectra were normalized at 532 nm. Except for the green line (0.9 × 10⁻⁸ mol 1 adsorbed onto PVG), the Q-band maximum is at 525 nm.
3.5. Time-Resolved Photophysical Studies
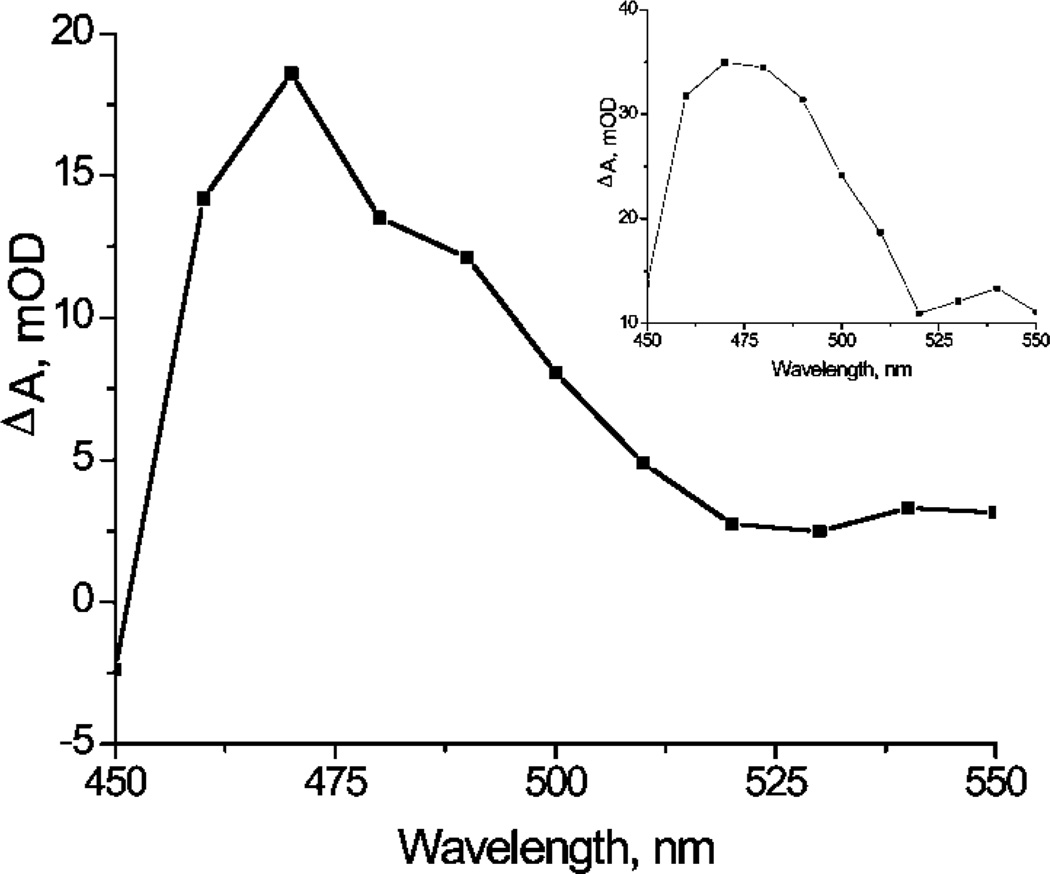
Figure 5 shows a nanosecond transient absorption spectrum generated from pulsed 417 nm light excitation of 0.9 × 10⁻⁷ mol 1 adsorbed onto 1 g PVG in an N2-purged H2O solution. The absorption band at ~470 nm was assigned to 31*-ads. Similar transient features were observed for 31* in fluid water (Figure 5, inset) and also by Reddi et al. for 31* in phosphate buffered solution and in aqueous 2% sodium dodecyl sulfate solution.29 First-order decay kinetics were observed for the transient absorption of 31*-ads, which decayed cleanly to baseline. The lifetime of 31*-ads (τ0 = 57 ± 1 µs) is similar to 31* in fluid aqueous solution (τ0 = 49 ±1 µs). Our absorption measurements in the UV–vis region before and after transient absorption experiments revealed no significant change. Next we describe how O2 quenches the transient absorption of 31*-ads and 31* in water solution.
Figure 5.
Nanosecond transient absorption spectra observed at 500 ns after pulsed-light excitation (417 nm, 1.6 mJ/pulse) of 1 in water solution (inset) and 1 at the water/PVG interface. Data points were collected every 10 nm from 450 to 550 nm.
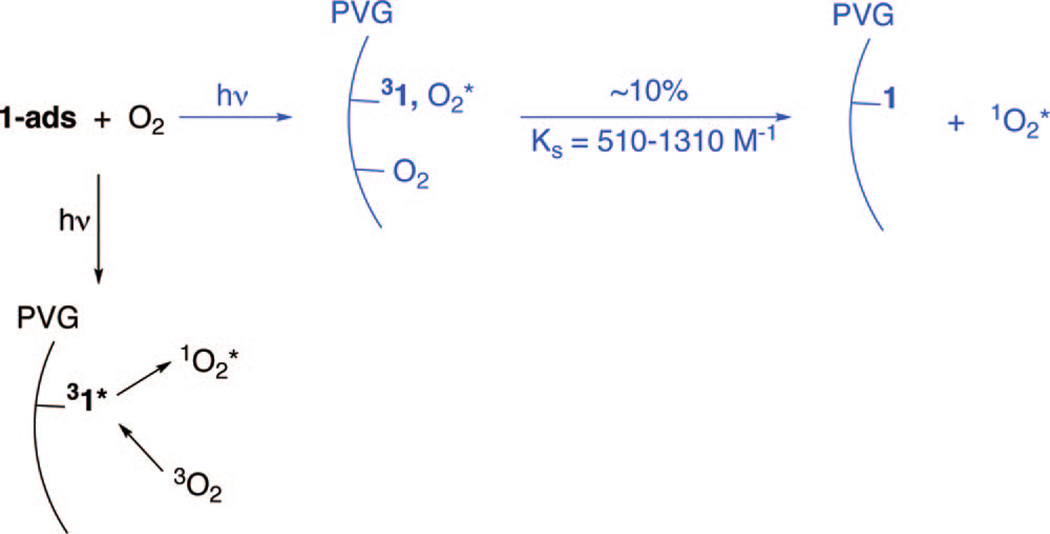
Figure S1 shows the lifetime and the amplitude quenching of the 31*-ads transient absorption by O2 (Supporting Information). Photoexcited 1 quenching by O2 at the PVG/water interface encouraged a Stern–Volmer analysis for insight into quenching mechanism. Two mechanisms were considered: (1) the dynamic encounter of O2 with an excited site on the surface, and (2) a ground-state O2 adduct formed at the surface with migration of adsorbed O2 to an excited site (Scheme 2).
SCHEME 2.
Mechanism of 31*-ads Quenching by O2a
a Dynamic quenching route in black and static quenching route in blue.
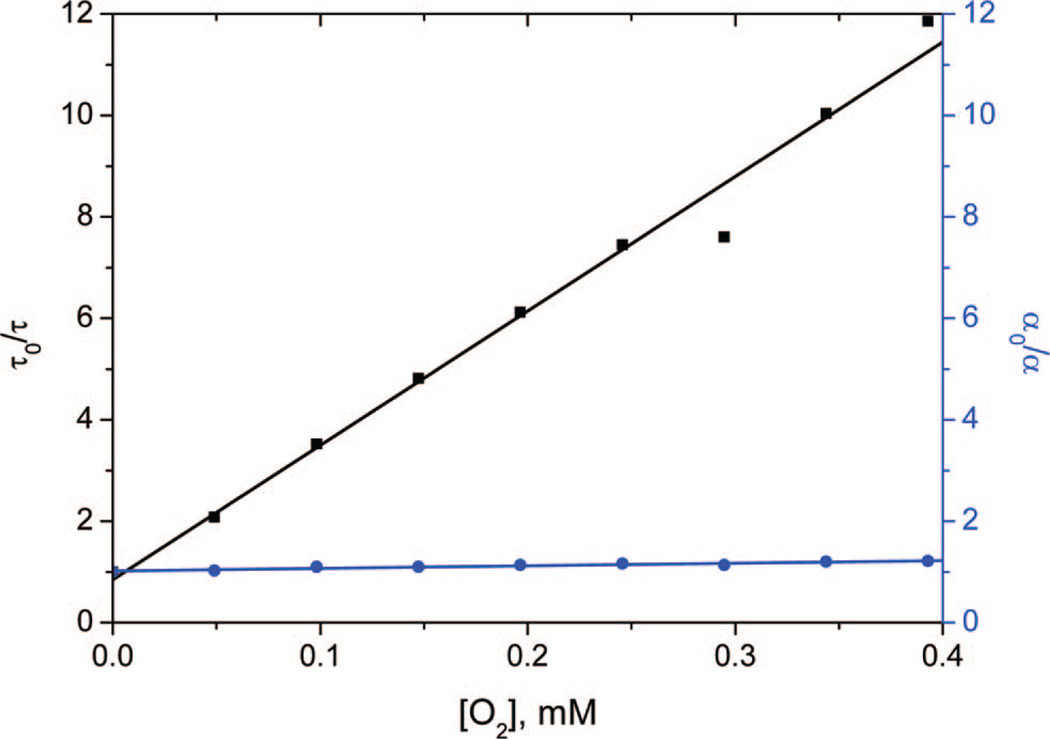
Stern–Volmer data collected at nine O2 concentrations (from 0 to 0.4 mM) are shown in Table 1 and Figure 6, in which the symbol τ refers to the lifetime of the excited porphyrin, kq is the rate constant for O2 quenching, KD is the Stern–Volmer constant, KS is the association constant for complex formation between the sensitizer and O2, and the subscript “0” indicates data in the absence of O2. The left axis of Figure 6 shows the plot of τ0/τ vs [O2] to be linear over the O2 concentration examined and corresponded to the Stern–Volmer equation: τ0/τ = 1 + kqτ0[O2] = 1 + KD[O2]. For 0.9 × 10⁻⁷ mol 1 adsorbed onto 1 g PVG, KD = 26 500 M−1 and the quenching rate constant kq = 4.6 × 10⁸ M−1 s−1, indicating that 50% of 31*-ads was quenched at an [O2] of 0.04 mM. For the samples containing 0.9 × 10⁻⁶–0.9 × 10⁻⁸ mol 1 adsorbed onto 1 g PVG, the KD values ranged from 32 000 to 23 700 M−1.
TABLE 1.
Stern–Volmer Quenching Constants as a Function of Coverage of 1 onto Porous Vycor Glass or of 1 in Fluid Water Solution
| photosens | absorbance λ520 |
KD (M−1) | KS (M−1) |
kq (M−1 s−1) |
|---|---|---|---|---|
| 1-adsa,b | 0.87 | 23700 ± 1320 | 1310 ± 210 | 4.2 × 10⁸ |
| 1-adsa,c | 0.25 | 26500 ± 1220 | 510 ± 60 | 4.6 × 10⁸ |
| 1-adsa,d | 0.025 | 32100 ± 1460 | 650 ± 80 | 5.6 × 10⁸ |
| 1 in fluid H2Oe | ~0.2 | 89600 ± 2600 | 1160 ± 170 | 1.8 × 10⁹ |
The PVG/1 samples were immersed in water.
Sample contained 0.9 × 10⁻⁶ mol 1 adsorbed onto PVG.
Sample contained 0.9 × 10⁻⁷ mol 1 adsorbed onto PVG.
Sample contained 0.9 × 10⁻⁸ mol 1 adsorbed onto PVG.
Homogeneous 1 in deionized water solution.
Figure 6.
Lifetime quenching as a function of O2 concentration of a H2O solution containing 0.9 × 10⁻⁷ mol 1 adsorbed onto PVG (in black, left). Amplitude quenching as a function of O2 concentration of a H2O solution containing 0.9 × 10⁻⁷ mol 1 adsorbed onto PVG (in blue, right). Samples were excited with a 10 ns 417 nm light pulse (0.6 mJ/pulse), and the transient absorption was monitored at 470 nm.
Interestingly, the bimolecular quenching constant kq for 1-ads (kq = ~5 × 10⁸ M−1 s−1) is about one-quarter the value measured for 1 in fluid water (kq = 1.8 × 10⁹ M−1 s−1). The experiments for 1 in fluid water solution produced a KD value of 89 600 M−1. Thus, the time scale for O2 diffusion may be slower in the water–PVG heterogeneous system compared to fluid solution. By analogy, Thomas et al. used the Einstein equation 〈x2〉 = 6Dt to suggest that nitromethane quenching of excited anthracene is 103–106 times slower in a zeolite compared to fluid solution (cf. 10−8–10−11 cm2 s−1).30 In our system, the smaller KD values in the heterogeneous samples may result from reduced directions for access of O2 to 31*-ads compared to O2 to 31* in fluid solution.
The amplitude of the time-resolved absorbance at 470 nm was examined (Figure S1, Supporting Information). Because a ground-state adduct equilibrium of 1-ads and O2 would be expected to have a different absorption spectrum from 1-ads, an absorption decrease can point to a static quenching mechanism. Figure 6 (right-hand Y-axis) shows the plot of α0/α vs [O2] was linear over the O2 concentration examined and followed the equation α0/α = 1 + KS[O2]. For 1-ads, the adduct formation constant KS ranged from 510 to 1310 M−1. The amplitude of the absorption at 470 nm decreased slightly (by about 0.1) with increasing O2 concentrations. Thus, we estimate that ~10% of the quenching occurred via the static quenching mechanism (colored blue in Scheme 2). The above Stern–Volmer analysis suggested that quenching of 31*-ads by O2 is primarily dynamic, the route colored black in Scheme 2. In the absence of aggregation, photosensitizers in homogeneous fluid solution are often quenched dynamically by O2.21
4. Conclusion
In isotropic heterogeneous media static and dynamic quenching modes can operate. In the present case, we have evidence that O2 quenches triplet 1* at the water–PVG interface primarily by a dynamic quenching mechanism. The contribution from static quenching remains low even with loadings of 1 onto PVG that varied by 100-fold. The O2 quenching constants kq for 31*-ads were only 3–4 times smaller than for 31* itself, suggesting the heterogeneous system is capable of generating singlet oxygen for its use as a reagent in the surrounding aqueous solution.
Acknowledgment
J.G. and G.J.M. thank the National Science Foundation for support. D.A., M.Z., and A.G. thank the National Institutes of Health and the PSC-CUNY Grants Program for support. Computational support was provided by the CUNY Graduate Center computational facility. We thank Harry D. Gafney (CUNY Queens College) for valuable discussions in an early phase of this study.
Footnotes
Supporting Information Available: Time-resolved absorbance of 31*-ads in the presence of increasing concentrations of oxygen. This material is available free of charge via the Internet at http://pubs.acs.org.
References and Notes
- 1.Recent examples include: (a) Polymers and polymer blends: Koizumi H, Kimata Y, Shiraishi Y, Hirai T. Chem. Commun. 2007:1846–1848. doi: 10.1039/b617718b. Schaap AP. Spectrum. 2007;20:4–13. Zebger I, Poulsen L, Gao Z, Andersen LK, Ogilby PR. Langmuir. 2003;19:8923–8933. (b) Quantum dots: Ma J, Chen JY, Idowu M, Nyokong T. J. Phys. Chem. B. 2008;112:4465–4469. doi: 10.1021/jp711537j. Tsay JM, Trzoss M, Shi L, Kong X, Selke M, Jung ME, Weiss S. J. Am. Chem. Soc. 2007;129:6865–6871. doi: 10.1021/ja070713i. Samia ACS, Dayal S, Burda C. Photochem. Photobiol. 2006;82:617–625. doi: 10.1562/2005-05-11-IR-525. (c) Silica, silica nanoparticles, xerogels, and exchange resins: Cantau C, Pigot T, Manoj N, Oliveros E, Lacombe S. ChemPhysChem. 2007;8:2344–2353. doi: 10.1002/cphc.200700482. Feng K, Wu LZ, Zhang LP, Tung CH. Tetrahedron. 2007;63:4907–4911. Ishii K, Shiine M, Kikukawa Y, Kobayashi N, Shiragami T, Matsumoto J, Yasuda M, Suzuki H, Yokoi H. Chem. Phys. Lett. 2007;448:264–267. Chirvony V, Chyrvonaya A, Ovejero J, Matveeva E, Goller B, Kovalev D, Huygens A, de Witte P. Adv. Mater. 2007;19:2967–2972. Greer A. Acc. Chem. Res. 2006;39:797–804. doi: 10.1021/ar050191g. Roy I, Ohulchanskyy TY, Pudavar HE, Bergey EJ, Oseroff AR, Morgan J, Dougherty TJ, Prasad PN. J. Am. Chem. Soc. 2003;125:7860–7865. doi: 10.1021/ja0343095. (d) Modified TiO2: Naito K, Tachikawa T, Fujitsuka M, Majima T. J. Phys. Chem. C. 2008;112:1048–1059. Jaczyk A, Krakowska E, Stochel G, Macyk W. J. Am. Chem. Soc. 2006;128:15574–15575. doi: 10.1021/ja065970m. Tatsuma T, Tachibana S, Miwa T, Tryk DA, Fujishima A. J. Phys. Chem. B. 1999;103:8033–8035. (e) Zeolites: Cojocaru B, Laferriere M, Carbonell E, Parvulescu V, Garcia H, Scaiano JC. Langmuir. 2008;24:4478–4481. doi: 10.1021/la800441n. Pace A, Pierro P, Buscemi S, Vivona N, Clennan EL. J. Org. Chem. 2007;72:2644–2646. doi: 10.1021/jo0625047. Jockusch S, Sivaguru J, Turro NJ, Ramamurthy V. Photochem. Photobiol. Sci. 2005;4:403–405. doi: 10.1039/b501701g.
- 2.Aebisher D, Azar NS, Zamadar M, Gafney HD, Gandra N, Gao R, Greer A. J. Phys. Chem. B. 2008;112:1913–1917. doi: 10.1021/jp709829z. [DOI] [PubMed] [Google Scholar]
- 3.Gafney HD, Wolfgang S. J. Phys. Chem. 1983;87:5395–5401. [Google Scholar]
- 4.Samuel J, Ottolenghi M, Avnir D. J. Phys. Chem. 1992;96:6398–6405. [Google Scholar]
- 5.Krasnansky R, Koike K, Thomas JK. J. Phys. Chem. 1990;94:4521. [Google Scholar]
- 6.Krasnansky R, Thomas JK. J. Photochem. Photobiol. A: Chem. 1991;57:81–86. [Google Scholar]
- 7.Drake JM, Levitz P, Turro NJ, Nitsche KS, Cassidy KF. J. Phys. Chem. 1988;92:4680–4684. doi: 10.1103/PhysRevLett.61.865. [DOI] [PubMed] [Google Scholar]
- 8.Wellner E, Rojanski D, Ottolenghi M, Huppert D, Avnir D. J. Am. Chem. Soc. 1987;109:575–576. [Google Scholar]
- 9.Ruetten SA, Thomas JK. J. Phys. Chem. B. 1999;103:1278–1286. [Google Scholar]
- 10.Xiong Z, Xu Y, Zhu L, Zhao J. Environ. Sci. Technol. 2005;39:651–657. doi: 10.1021/es0487630. [DOI] [PubMed] [Google Scholar]
- 11.(a) Zhang D, Wu L-Z, Yang QZ, Li X-H, Zhang L-P, Tung C-H. Org. Lett. 2003;5:3221–3224. doi: 10.1021/ol035012e. [DOI] [PubMed] [Google Scholar]; (b) Wetzler DE, Garcia-Fresnadillo D, Orellana G. Phys. Chem. Chem. Phys. 2006;8:2249–2256. doi: 10.1039/b517756a. [DOI] [PubMed] [Google Scholar]
- 12.(a) Rodgers MAJ, Lee PC. J. Phys. Chem. 1984;88:3480–3484. [Google Scholar]; (b) Lee PC, Rodgers MAJ. J. Phys. Chem. 1984;88:4385–4389. [Google Scholar]; (c) Matheson IBC, Rodgers MAJ. J. Phys. Chem. 1982;86:884–887. [Google Scholar]; (d) Lee PC, Rodgers MAJ. J. Phys. Chem. 1983;87:4894–4898. [Google Scholar]
- 13.Natarajan A, Kaanumalle LS, Jockusch S, Gibb CLD, Gibb BC, Turro NJ, Ramamurthy V. J. Am. Chem. Soc. 2007;129:4132–4133. doi: 10.1021/ja070086x. [DOI] [PubMed] [Google Scholar]
- 14.Daimon T, Nosaka Y. J. Phys. Chem. C. 2007;111:4420–4424. [Google Scholar]
- 15.Elmer TH. In: ASM Engineered Materials Handbook. Schnieder SJ Jr, editor. Vol. 4. Materials Park, OH: ASM; 1991. p. 427. [Google Scholar]
- 16.Gafney HD, Shi W. J. Phys. Chem. 1988;92:2329. [Google Scholar]
- 17.Bauer LA, Reich DH, Meyer GJ. Langmuir. 2003;19:7043–7048. [Google Scholar]
- 18.Staniszewski A, Morris AJ, Ito T, Meyer GJ. J. Phys. Chem. B. 2007;111:6822–6828. doi: 10.1021/jp070413n. [DOI] [PubMed] [Google Scholar]
- 19.Staniszewski A, Heuer WB, Meyer GJ. Inorg. Chem. 2008;47:7062–7064. doi: 10.1021/ic800171h. [DOI] [PubMed] [Google Scholar]
- 20.Argazzi R, Bignozzi CA, Heimer TA, Castellano FN, Meyer GJ. Inorg. Chem. 1994;33:5741–5749. [Google Scholar]
- 21.Iu K-K, Ogilby PR. J. Phys. Chem. 1988;92:4662–4666. [Google Scholar]
- 22.Battino R, editor. IUPAC Solubility Data Series. Vol. 7. Oxford: Pergamon; 1981. [Google Scholar]
- 23.Frisch MJ, Trucks GW, Schlegel HB, Scuseria GE, Robb MA, Cheeseman JR, Montgomery JA, Jr, Vreven T, Kudin KN, Burant JC, Millam JM, Iyengar SS, Tomasi J, Barone V, Mennucci B, Cossi M, Scalmani G, Rega N, Petersson GA, Nakatsuji H, Hada M, Ehara M, Toyota K, Fukuda R, Hasegawa J, Ishida M, Nakajima T, Honda Y, Kitao O, Nakai H, Klene M, Li X, Knox JE, Hratchian HP, Cross JB, Bakken V, Adamo C, Jaramillo J, Gomperts R, Stratmann RE, Yazyev O, Austin AJ, Cammi R, Pomelli C, Ochterski JW, Ayala PY, Morokuma K, Voth GA, Salvador P, Dannenberg JJ, Zakrzewski VG, Dapprich S, Daniels AD, Strain MC, Farkas O, Malick DK, Rabuck AD, Raghavachari K, Foresman JB, Ortiz JV, Cui Q, Baboul AG, Clifford S, Cioslowski J, Stefanov BB, Liu G, Liashenko A, Piskorz P, Komaromi I, Martin RL, Fox DJ, Keith T, Al-Laham MA, Peng CY, Nanayakkara A, Challacombe M, Gill PMW, Johnson B, Chen W, Wong MW, Gonzalez C, Pople JA. Gaussian 03, revision B.05. Pittsburgh, PA: Gaussian, Inc.; 2003. [Google Scholar]
- 24.(a) Lee B, Richards FM. J. Mol. Biol. 1971;55:379–380. doi: 10.1016/0022-2836(71)90324-x. [DOI] [PubMed] [Google Scholar]; (b) Richards FM. Annu. Rev. Biophys. Bioeng. 1977;6:151–176. doi: 10.1146/annurev.bb.06.060177.001055. [DOI] [PubMed] [Google Scholar]
- 25.(a) Knagge K, Smith JR, Smith LJ, Buriak J, Raftery D. Solid State Nucl. Magn. Reson. 2006;29:85–89. doi: 10.1016/j.ssnmr.2005.10.001. [DOI] [PubMed] [Google Scholar]; (b) Preethi N, Shinohara H, Nishide H. Bull. Chem. Soc. Jpn. 2006;79:1308–1311. [Google Scholar]; (c) Uchytil P, Petrickovic R, Seidel-Morgenstern A. J. Membr. Sci. 2007;293:15–21. [Google Scholar]; (d) Shiojiri K, Yanagisawa Y, Yamasaki A, Kiyono F. J. Membr. Sci. 2006;282:442–449. [Google Scholar]; (e) Yang J, Cermakova J, Uchytil P, Hamel C, Seidel-Morgenstern A. Catal. Today. 2005;104:344–351. [Google Scholar]
- 26.Hellriegel C, Kirstein J, Braeuchle C, Latour V, Pigot T, Olivier R, Lacombe S, Brown R, Guieu V, Payrastre C, Izquierdo A, Mocho P. J. Phys. Chem. B. 2004;108:14699–14709. [Google Scholar]
- 27.Gleb LD, Gubbins KE. Langmuir. 1998;14:2097–2111. [Google Scholar]
- 28.Thompson H, Soper AK, Ricci MA, Bruni F, Skipper NT. J. Phys. Chem. B. 2007;111:5610–5620. doi: 10.1021/jp0677905. [DOI] [PubMed] [Google Scholar]
- 29.Reddi E, Ceccon M, Valduga G, Jori G, Bommer JC, Elisei F, Latterini L, Mazzucato U. Photochem. Photobiol. 2002;75:462–470. doi: 10.1562/0031-8655(2002)075<0462:ppaaao>2.0.co;2. [DOI] [PubMed] [Google Scholar]
- 30.Ellison EH, Thomas JK. Langmuir. 2001;17:2446–2454. [Google Scholar]


