

The crystal structure of the effector-binding domain of the transcriptional repressor AraR from B. subtilis in complex with the effector molecule (l-arabinose) was determined at 2.2 Å resolution. A detailed analysis of the crystal identified a dimer organization that is distinctive from that of other members of the GalR/LacI family.
Keywords: repressors, dimerization, effector binding, isothermal titration calorimetry, differential scanning fluorimetry, dimeric interface
Abstract
In Bacillus subtilis, the arabinose repressor AraR negatively controls the expression of genes in the metabolic pathway of arabinose-containing polysaccharides. The protein is composed of two domains of different phylogenetic origin and function: an N-terminal DNA-binding domain belonging to the GntR family and a C-terminal effector-binding domain that shows similarity to members of the GalR/LacI family. The crystal structure of the C-terminal effector-binding domain of AraR in complex with the effector l-arabinose has been determined at 2.2 Å resolution. The l-arabinose binding affinity was characterized by isothermal titration calorimetry and differential scanning fluorimetry; the K d value was 8.4 ± 0.4 µM. The effect of l-arabinose on the protein oligomeric state was investigated in solution and detailed analysis of the crystal identified a dimer organization which is distinctive from that of other members of the GalR/LacI family.
1. Introduction
Like many other bacteria, Bacillus subtilis can utilize various carbohydrates as sources of carbon and energy. The enzymes of the various metabolic pathways are in general synthesized only in the presence of their substrate and in the absence of the preferred carbon source. The transcription of the genes coding for transporters and catabolic enzymes is thus tightly regulated by numerous transcription factors (Henkin, 1996 ▶; Stülke & Hillen, 2000 ▶).
As a soil bacterium, B. subtilis participates in the decomposition of plant material and can utilize the l-arabinose pentose carbohydrate that is present in plant polysaccharides. The expression of 13 genes participating in the metabolism of arabinose-, galactose- and xylose-containing polysaccharides is negatively controlled by the transcription factor AraR. AraR recognizes and binds to eight specific DNA operator sites and thus blocks transcription from five promoters (Mota et al., 1999 ▶, 2001 ▶; Sá-Nogueira & Mota, 1997 ▶). Binding of the effector molecule arabinose modulates the binding of AraR to DNA and results in derepression of the arabinose regulon.
AraR comprises 362 amino-acid residues and belongs to the GntR family of bacterial regulatory proteins. These regulators are characterized by a modular domain organization, with a small N-terminal DNA-binding domain and a large C-terminal effector-binding domain. The C-terminal domain typically mediates homodimer formation; it receives the signal through binding of the effector molecule and transmits it to the DNA-binding domain.
The N-terminal domain of AraR (residues 1–70) contains the winged-helix–turn–helix domain typical of the GntR family of bacterial regulatory proteins (Haydon & Guest, 1991 ▶). This domain is responsible for specific DNA recognition and binding. The C-terminal domain of AraR is comprised of 292 amino-acid residues (residues 71–363) and is homologous to the GalR/LacI family of bacterial regulators and sugar-binding proteins (Weickert & Adhya, 1992 ▶). This domain is involved in effector (l-arabinose) binding and protein dimerization (Franco et al., 2006 ▶).
Residues that are crucial for DNA recognition and effector binding as well as for dimerization have been identified using the mutagenesis approach and homology modelling (Franco et al., 2006 ▶, 2007 ▶); however, no crystal structures are available for AraR or its individual domains.
In order to obtain structural information on effector recognition and dimerization, we produced recombinant C-terminal domain of AraR and full-length AraR and characterized the effector binding and its effect on protein dimerization. We determined the crystal structure of the C-terminal domain of AraR in complex with l-arabinose and analyzed the structure in order to provide insights into the structural mechanisms underlying the function of AraR.
2. Experimental
2.1. Protein expression and purification
The gene for full-length AraR (NCBI reference sequence ZP_03593195.1) and the coding sequence for the effector-binding domain of AraR (residues 71–363, referred to here as C-AraR) were cloned into the pET151/D-TOPO vector using Gateway cloning technology (Invitrogen). The vectors included a sequence encoding an N-terminal His6 affinity tag followed by a V5 epitope and a sequence encoding the tobacco etch virus (TEV) protease recognition site. Upon TEV protease cleavage, the six-amino-acid sequence GIDPFT remained at the N-terminus of the recombinant C-AraR as a cloning artifact.
Protein preparation was carried out by a procedure used previously for the production of other bacterial repressors for crystallographic studies (Řezáčová et al., 2007 ▶, 2008 ▶). The AraR and C-AraR proteins were overexpressed in Escherichia coli BL21 (DE3) grown on LB broth (Sigma) supplemented with 0.8%(v/v) glycerol and 20 µg ml−1 ampicillin. The bacterial culture was grown at 310 K and protein expression was induced with 1 mM isopropyl β-d-1-thiogalactopyranoside at an OD600 of about 1 for a total of 5 h at 293 K. The cells were harvested by centrifugation, resuspended in five volumes of lysis buffer [50 mM Tris–HCl pH 7.5, 500 mM NaCl, 10 mM imidazole, 5%(v/v) glycerol] and lysed by sonication after the addition of protease inhibitor (1 mM PMSF). The lysate was clarified by centrifugation and subjected to affinity chromatography using a His-Select Nickel Affinity Gel (Sigma) column equilibrated with lysis buffer. The His6-tagged protein was eluted with 250 mM imidazole in lysis buffer.
The affinity tag was removed from C-AraR by incubation with recombinant His6-tagged TEV protease overnight at 298 K while dialyzing against lysis buffer. The sample was subjected to a second round of Ni–NTA metal-affinity chromatography to remove the TEV protease and the cleaved His6 tag, extensively dialyzed against 20 mM Tris–HCl pH 7.5, 250 mM NaCl, 0.02%(v/v) β-mercaptoethanol and concentrated using Amicon Ultra Concentrators (Millipore). Proteins that were >95% pure as judged by SDS–PAGE were flash-cooled in liquid nitrogen and stored at 203 K until further use.
2.2. Protein crystallization
Initial C-AraR crystals were obtained by the sitting-drop vapour-diffusion method using the JCSG+ Suite (Qiagen) crystallization screen with a Gryphon crystallization workstation (Art Robbins); 0.2 µl protein solution was mixed with 0.2 µl well solution and the mixture was equilibrated against 50 µl reservoir solution. Crystals appeared after several days in various conditions containing PEG as the precipitant. Further optimization was performed manually and involved changing to the hanging-drop mode in VDX48 crystallization plates (Hampton Research). Optimal C-AraR crystals were obtained by mixing 1 µl protein solution [16.8 mg ml−1 in 10 mM Tris–HCl pH 7.5, 250 mM NaCl, 0.02%(v/v) β-mercaptoethanol] supplemented with 50 mM l-arabinose with 1 µl reservoir solution [70 mM HEPES pH 7.5, 7%(w/v) PEG 8000, 6%(v/v) ethylene glycol, 20%(v/v) glycerol, 10 mM spermidine] and equilibrating at 293 K against 150 µl reservoir solution. Rod-shaped crystals appeared within a day and grew to final dimensions of 0.3 × 0.15 × 0.15 mm within one week. The crystals were flash-cooled by plunging them into liquid nitrogen and were then stored in liquid nitrogen until use in X-ray diffraction experiments.
2.3. Data collection and structure determination
Diffraction data were collected at 100 K on beamline MX14.2 of BESSY, Berlin, Germany. All diffraction data were processed using the HKL-3000 suite of programs (Minor et al., 2006 ▶). The crystals exhibited the symmetry of space group P212121 and contained two molecules in the asymmetric unit, with a solvent content of ∼56%. Crystal parameters and data-collection statistics are given in Table 1 ▶. The crystals exhibited anisotropic diffraction to a minimum Bragg spacing (d min) of about 2.2 Å in one direction and to a d min of about 2.9 Å in the other direction. The low value of the completeness in the highest resolution shell is a consequence of this anisotropy.
Table 1. Crystal data and diffraction data-collection and refinement statistics.
Values in parentheses are for the highest resolution shell.
| Data-collection statistics | |
| Wavelength (Å) | 0.917 |
| Space group | P212121 |
| Unit-cell parameters (Å) | a = 62.1, b = 106.3, c = 111.8 |
| No. of molecules in asymmetric unit | 2 |
| Resolution (Å) | 30–2.2 (2.28–2.20) |
| No. of unique reflections | 33024 (2220) |
| Multiplicity | 6.6 (5.5) |
| Completeness (%) | 86.8 (59.3) |
| Rmerge† (%) | 5.7 (28.0) |
| Average I/σ(I) | 35.9 (4.9) |
| Refinement statistics | |
| Resolution range (Å) | 30–2.2 (2.28–2.20) |
| No. of reflections in working set | 31295 |
| No. of reflections in test set | 1660 |
| R‡ (%) | 18.42 (25.6) |
| Rfree§ (%) | 22.6 (31.9) |
| R.m.s.d. bond lengths (Å) | 0.013 |
| R.m.s.d. angles (°) | 1.41 |
| No. of atoms in asymmetric unit | 4810 |
| No. of water molecules in asymmetric unit | 246 |
| Mean B value, protein/solvent (Å2) | 51.9/52.5 |
| Ramachandran plot statistics¶ | |
| Residues in favoured regions (%) | 96.4 |
| Residues in allowed regions (%) | 99.3 |
R
merge = 
 , where I
i(hkl) is an individual intensity of the ith observation of reflection hkl and 〈I(hkl)〉 is the average intensity of reflection hkl, with summation over all data.
, where I
i(hkl) is an individual intensity of the ith observation of reflection hkl and 〈I(hkl)〉 is the average intensity of reflection hkl, with summation over all data.
R = 
 , where F
obs and F
calc are observed and calculated structure factors, respectively.
, where F
obs and F
calc are observed and calculated structure factors, respectively.
R free is equivalent to R but is calculated for 5% of the reflections chosen at random and omitted from the refinement process (Brünger, 1992 ▶).
As determined by MolProbity (Chen et al., 2010 ▶).
The structure of C-AraR was determined by molecular replacement using MOLREP (Vagin & Teplyakov, 2010 ▶). The polyalanine search model was derived from the structure of the effector-binding domain (residues 55–329) of the E. coli PurR repressor (PDB entry 1jft; Huffman et al., 2002 ▶), which shares 26% sequence identity with C-AraR. Model refinement was carried out using REFMAC v.5.2 (Murshudov et al., 2011 ▶) from the CCP4 package (Winn et al., 2011 ▶) and was interspersed with manual adjustments using Coot (Emsley & Cowtan, 2004 ▶). The final steps included TLS refinement (Winn et al., 2001 ▶) using 19 TLS groups.
The coordinates for the ligand were added after complete refinement of the C-AraR and solvent model. The quality of the final model was validated with MolProbity (Chen et al., 2010 ▶). The final refinement statistics are given in Table 1 ▶. All figures showing structural representations were prepared with PyMOL (DeLano, 2002 ▶). The PISA (Krissinel & Henrick, 2005 ▶) and ConSurf (Landau et al., 2005 ▶) servers were used to analyze the structures. Atomic coordinates and experimental structure factors have been deposited in the Protein Data Bank with code 3tb6.
2.4. Size-exclusion chromatography
Analytical size-exclusion chromatography was performed on a Superdex 200 10/300 GL Tricorn column (Pharmacia) equilibrated with 10 mM Tris pH 7.5, 250 mM NaCl, 0.02%(v/v) β-mercaptoethanol. When the AraR and C-AraR proteins in complex with l-arabinose were analyzed, the equilibration buffer was supplemented with 50 mM l-arabinose.
A sample of 50 µl AraR protein at 2 mg ml−1 or of 50 µl C-AraR protein at 3.2 mg ml−1 (with or without the addition of 50 mM l-arabinose) was loaded onto the column. The apparent molecular weight was estimated by comparison with protein standards (Sigma–Aldrich), which consisted of blue dextran (2000 kDa), bovine serum albumin (66 kDa), carbonic anhydrase (29 kDa), cytochrome c (12.4 kDa) and aprotinin (6.5 kDa).
2.5. Differential scanning fluorimetry
The thermal shift assay was conducted in a PCR Roche LightCycler 480 II. Solutions of 2 µM protein and 100 mM l-arabinose were mixed and 1 µl 25× diluted (in water) 5× SYPRO Orange (Bio-Rad) was added to 25 µl of this mixture in the wells of a 96-well LightCycler 480 Multiwell Plate 96 and sealed using LightCycler 480 Sealing Foil (Roche). The final concentrations of the AraR and C-AraR proteins were 1 µM. The final concentration of l-arabinose ranged from 0.1 to 50 mM. The measurements were performed in 20 mM Tris–HCl pH 7.5, 50 mM NaCl, 0.02%(v/v) β-mercaptoethanol. The plate was heated from 293 to 363 K with a heating rate of 0.8 K min−1. The fluorescence intensity was recorded using wavelengths for excitation and emission of 465 and 580 nm, respectively.
The data analysis is based on a published procedure (Lo et al., 2004 ▶). The fluorescence values were fitted to the nonlinear equation (1) (Pantoliano et al., 2001 ▶) to obtain ΔH u, ΔC pu, T m, F min and F max,
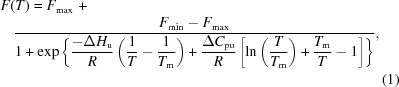 |
where F(T) is the measured fluorescence intensity at temperature T, F min and F max are the fluorescence intensities before and after the unfolding process, T m is the midpoint of the protein-unfolding transition, R is the gas constant, ΔH u is the enthalpy of protein unfolding and ΔC pu is the heat-capacity change of protein unfolding. The program GraphPad Prism 5 was used to perform nonlinear fitting.
To carefully determine the parameters in the absence of the ligand, ten parallel measurements were performed and fitted separately. The mean values and their standard errors were calculated as weighted arithmetic means, with the square of the standard errors determined from each measurement used as the weighting term. For each l-arabinose concentration (0.1–50 mM), three parallel measurements were performed and the weighted arithmetic means of T m were calculated.
2.6. Isothermal titration calorimetry (ITC)
Thermodynamic analysis by ITC was performed using VP-ITC (MicroCal) at 298 K in 20 mM Tris–HCl pH 7.5, 50 mM NaCl, 0.02%(v/v) β-mercaptoethanol. 1.5 ml C-AraR protein solution at a concentration of 35 µM was titrated against the ligand solution at a concentration representing a 11.5-fold molar excess over the protein concentration. At each injection (of a total of 35), 10 µl ligand solution was injected into a sample cell. Each experiment was accompanied by a corresponding control experiment in which the ligand was injected into the buffer alone. An accurate concentration of the protein was determined by HPLC amino-acid analysis. The association constants and the thermodynamic parameters were estimated using Origin (v.7.0; MicroCal). The values reported are the average and standard errors calculated from two titration experiments.
3. Results and discussion
3.1. Overall structure description and quality
The structure of the C-terminal effector-binding domain of AraR (C-AraR; residues 71–363) in complex with its effector l-arabinose was determined by molecular replacement and was refined using data to 2.2 Å resolution. The data-collection and model-refinement statistics are given in Table 1 ▶. The orthorhombic crystal form contained two molecules in the asymmetric unit, with a solvent content of 56%. The final crystallographic model consisted of two molecules of C-AraR, with residues 79–361 in polypeptide chain A and 80–358 in chain B. The N- and C-terminal residues of both molecules in the asymmetric unit could not be located in the electron-density map and were thus not included in the final model. The two protein chains in the asymmetric unit are quite similar: the r.m.s.d. for superposition of 292 Cα atoms is 0.208, a value that is within the range observed for different crystal structures of identical proteins (Betts & Sternberg, 1999 ▶).
The electron density used for modelling l-arabinose into the effector-binding site was of excellent quality in both protein chains in the asymmetric unit (Fig. 1 ▶). Two glycerol molecules and 246 water molecules were modelled into nonprotein electron density in positions allowing hydrogen-bond interactions.
Figure 1.

Ribbon representation of the overall structure of C-AraR. The protein is coloured according to the secondary-structure elements, with α-helices in red, β-strands in yellow and loops in green. The l-arabinose in the effector-binding site is shown as sticks, with C and O atoms coloured grey and red, respectively. On the right, the detail of the effector-binding site is shown, with the 2F o − F c electron-density map for l-arabinose contoured at 1.0σ. The detailed view is rotated by ∼90° with respect to the overall view.
There are two Ramachandran outliers in each protein chain: His135 and Asp301. Residue Asp301 is an outlier with special conformation in the effector-binding site which is conserved in other transcriptional repressors: e.g. Asp275 in E. coli PurR or Asp274 in E. coli LacI (Mowbray & Björkman, 1999 ▶). Residue His135 is located in a flexible region at the dimer interface.
The effector-binding domain of AraR consists of two subdomains which have very similar α/β topologies (Fig. 1 ▶). They are composed of a core of six parallel β-sheets flanked on each side by two α-helices. The N-terminal subdomain consists of residues 71–182 and 318–346, while the C-terminal subdomain consists of residues 183–317 and 347–363. Three cross-over strands connect the two subdomains. The effector-binding site is located at the interface of the two subdomains (Fig. 1 ▶).
A structural comparison with models deposited in the Protein Data Bank using the program DALI (Holm & Sander, 1994 ▶) identified numerous structural homologues among bacterial proteins belonging to the GalR/LacI family of transcription regulators.
Despite their low sequence identity to C-AraR, the closest structural homologues are catabolite-control protein A (CcpA) from B. megaterium (sequence identity of 25%) and purine repressor (PurR) from E. coli (sequence identity of 26%). This structural similarity has been predicted previously based on sequence homology and has also been used in homology-modelling studies by others (Franco et al., 2006 ▶). The structures of CcpA and PurR superimpose with C-AraR with r.m.s.d.s of 1.9 Å for 269 equivalent Cα atoms and 2.1 Å for 273 equivalent Cα atoms, respectively (Fig. 2 ▶ a). The structural similarity to the E. coli lactose operon repressor LacI, which is the prototypical member of the GalR/LacI family, is also very high (r.m.s.d. of 2.3 Å for superposition of 267 equivalent Cα atoms).
Figure 2.

(a) Superposition of C-AraR (magenta) with CcpA (yellow) and PurR (green) structures. (b, c) Detail of the effector-binding site with bound small-molecular effectors. Ligands are represented as stick models with C-atom colours corresponding to the colour of the protein chain (O, N and P atoms are coloured red, blue and orange, respectively). The coordinates used for the superposition were those of CcpA from B. megaterium in complex with glucose 6-phosphate (PDB entry 2nzu; Schumacher et al., 2007 ▶) and of PurR from E. coli in complex with hypoxanthine (PDB entry 1qpz; Glasfeld et al., 1999 ▶).
The locations of the binding sites for the effector in CcpA (glucose 6-phosphate) and the co-repressor in PurR (hypoxanthine) coincide with the l-arabinose effector-binding site in AraR (Fig. 2 ▶ b).
3.2. Effector binding to AraR
3.2.1. Structural details of l-arabinose binding
The effector-binding site is located in a deep cleft between the N- and C-terminal subdomains of C-AraR. The side chains of the following residues form the l-arabinose binding pocket: Tyr92, Ile93, Phe94, Glu142 and Asn170 from the N-terminal domain, Asp212, Gln214, Arg218, Tyr272, Asn273 and Asp301 from the C-terminal domain, and Asp185 and His318 from the cross-over strands. The binding of the sugar at the interface of the two subdomains restrains the overall protein conformation substantially and stabilizes the protein. A change in the molecular shape as well as increased thermal stability upon l-arabinose binding was indeed observed in the size-exclusion chromatography and differential scanning fluorimetry experiments described below. Attempts to crystallize free C-AraR protein failed, probably owing to protein dynamics and conformational instability in the absence of the effector molecule.
The l-arabinose adopts the β-configuration and is deeply buried within the effector-binding site; it loses 92.5% (246 Å2) of its solvent-accessible surface upon binding to C-AraR. All of the hydroxyl groups of l-arabinose are involved in polar interactions with protein side chains: the O1 atom interacts with the side chain of Gln214, O2 forms hydrogen bonds to Arg218 and Asp301, O3 interacts with Asn273 and Asp301, and O4 interacts with Asn273. In addition to direct hydrogen bonds, the O1 atom is involved in a water-mediated interaction with the side chains of Arg218 and Asp185. All residues in contact with l-arabinose are shown in Fig. 3 ▶.
Figure 3.

Interactions of l-arabinose with C-AraR. The l-arabinose bound to C-AraR is shown with yellow C atoms. The residues forming direct hydrogen bonds (black dotted lines) to l-arabinose are highlighted by green C atoms. Other residues within van der Waals distance (below 4 Å) of l-arabinose are shown with grey C atoms. Water-mediated hydrogen bonds are represented by blue dotted lines. Residue His318, which is at a van der Waals distance from l-arabinose, is not shown in the figure for the sake of clarity.
Our structure confirmed the results of the mutational analysis performed by Franco et al. (2006 ▶), identifying residues Phe94, Asp212, Gln214, Arg218, Asp301 and His318 as being in contact with the effector. Mutations of all of these residues except His318 resulted in a non-inducible (suppressor) phenotype (Franco et al., 2006 ▶).
3.2.2. l-Arabinose affinity and effect on protein stabilization
The binding of l-arabinose to AraR was investigated using isothermal titration calorimetry (ITC) and differential scanning fluorimetry (DSF). While ITC provides information on ligand-binding affinity and thermodynamic parameters, DSF follows the thermal stabilization of the protein on ligand binding (Pantoliano et al., 2001 ▶; Lo et al., 2004 ▶).
The ITC experiments were carried out at pH 7.5 in 20 mM Tris–HCl, 50 mM NaCl, 0.02%(v/v) β-mercaptoethanol. The ligand-binding event was exothermic and the integrated ITC data were best fitted by a single-site model (Fig. 4 ▶). The fit provided an estimate of the dissociation constant for binding of l-arabinose to C-AraR in the buffer described above as 8.4 ± 0.4 µM.
Figure 4.

Isothermal titration calorimetry (ITC) profile of l-arabinose binding to C-AraR. The upper plot shows ITC results for 35 µM C-AraR titrated against 420 µM l-arabinose. The lower plot shows the calorimetric trace. The enthalpy of binding was obtained by integration of the upper curve and subtraction of the curve from a control titration (not shown). 1 cal = 4.186 kJ.
This value is comparable with those determined using the same technique for the binding of the strong inducer isopropyl β-d-1-thiogalactopyranoside (IPTG) to the LacI lactose repressor protein at pH 7.5 (Wilson et al., 2007 ▶). The dissociation constant for IPTG binding to LacI was 2.8 ± 0.2 µM, while the affinity of the weak inducer 2-phenylethyl β-d-1-thiogalactopyranoside was characterized by a dissociation constant of 50 ± 3 µM (Wilson et al., 2007 ▶).
In the DSF experiments, the fluorescent dye SYPRO Orange was used to monitor protein unfolding in response to increasing temperature. The unfolding process exposes the hydrophobic region of proteins and results in a large increase in fluorescence, which is used to monitor the protein-unfolding transition (Lo et al., 2004 ▶). Both proteins displayed melting profiles that can be approximated by a two-state model of thermal unfolding (Fig. 5 ▶ b).
Figure 5.

Thermal stabilization of AraR and C-AraR proteins by ligand binding. (a) Plot of T m determined by differential scanning fluorimetry (DSF) in the presence of an increasing concentration of l-arabinose. (b) Examples of the unfolding transition of AraR and C-AraR proteins in the absence and presence of 50 mM l-arabinose (l-Ara). After reaching the plateau, the fluorescence intensity starts to decrease owing to denaturation of the protein–dye complex; these data were excluded from fitting and are not shown.
The melting profiles were used to estimate the midpoint temperature of transition, which is also called the unfolding transition temperature (T m) as it correlates with the melting temperatures determined using other methods (Ericsson et al., 2006 ▶). The T m values of C-AraR and AraR determined at increasing concentrations of l-arabinose are summarized in Fig. 5 ▶(a).
The thermal stability of AraR was 1.3 K lower than the stability of the isolated effector-binding domain protein (323.6 versus 324.9 K). Addition of l-arabinose increases the thermal stability of both proteins (Fig. 5 ▶). The increase in T m values upon ligand binding (ΔT m) was very similar for both proteins. We can thus conclude that the affinity of l-arabinose for the effector-binding site in C-AraR is comparable with the affinity for the binding site in the context of the full-length protein.
3.3. Oligomerization of AraR
3.3.1. Oligomeric state in solution
The effect of l-arabinose on AraR oligomerization was investigated by analytical size-exclusion chromatography (SEC). The molecular weight of C-AraR as well as that of the full-length AraR protein was estimated in the presence or absence of the effector molecule l-arabinose.
Although exact molecular weight cannot be determined by SEC, the apparent molecular weight calculated for globular proteins can be used as a guide to evaluate the oligomeric states of proteins when combined with the results of other methods (e.g. protein crystallography). When a 50 µl sample of purified C-AraR protein at 96 µM was injected onto a Superdex 200 10/300 column, the protein eluted in two rather broad peaks corresponding to apparent molecular weights of 276.5 and 119.4 kDa. Addition of l-arabinose at 50 mM to the protein sample and column buffer produced an elution profile with one sharp peak corresponding to an apparent molecular weight of a globular protein of 70.6 kDa (Fig. 6 ▶). As the theoretical molecular weight of the C-AraR monomer is 33.3 kDa, it can be concluded that the effector-binding domain forms a homodimer in the presence of the effector. In the absence of l-arabinose the protein forms a higher oligomeric species with an apparent molecular weight corresponding to octamers and tetramers or trimers (Fig. 6 ▶). The l-arabinose acts as a conformational stabilizer which protects C-AraR from aggregation.
Figure 6.

Effect of l-arabinose on AraR oligomerization. The elution profiles from size-exclusion chromatography of purified AraR and C-AraR in the absence (solid line) and the presence (dotted line) of l-arabinose (l-Ara) were monitored by absorbance at 280 nm. The apparent molecular weight is assigned to each elution peak; the numbers in parentheses represent the ratio between the apparent molecular weight and the theoretical molecular weight of a monomer.
The full-length AraR at 49 µM eluted as a single major peak both in the absence and the presence of l-arabinose (Fig. 6 ▶) which corresponded to the apparent molecular weight of a homodimeric species (the theoretical molecular weight of the AraR monomer is 41.1 kDa). The minor peak that eluted at 17.9 ml represents a contaminating protein with an apparent molecular weight of 13 kDa. The apparent molecular weight of AraR in the presence of l-arabinose is slightly lower than that of the free protein (85.9 kDa versus 93.8 kDa) and the shapes of the elution peaks also differ. As the peak in the presence of l-arabinose is sharper and more symmetric, we can conclude that the presence of the effector stabilizes the homodimeric form of the protein.
3.3.2. Oligomeric state in the crystal
For GalR/LacI proteins in general, dimerization mediated by the effector-binding domain is required for binding to the operator DNA (Swint-Kruse & Matthews, 2009 ▶). Our SEC experiments confirmed the dimerization of the full-length AraR as well as of C-AraR in solution.
To identify the interfaces mediating AraR dimerization, we performed a detailed analysis of the intermolecular contacts observed in the crystal structures.
There are two major protein–protein interfaces in the crystal which result in the formation of dimeric assemblies (Fig. 7 ▶ a). To deduce which of the two interfaces is likely to reflect the dimeric interaction of C-AraR, these crystal interfaces and the architectures of the potential assemblies were evaluated. Interface 1 has an interface area of 1431 Å2, which represents approximately 11% of the total solvent-accessible surface area of a monomer. It contains 40 interacting residues spanning both of the C-AraR subdomains (Fig. 7 ▶ b). In the N-terminal subdomain the interface comprises residues from helix α2 (153–162) and from the loop connecting the helix to the preceding strand β2 (147–153) and the residues forming a loop connecting strands β4 and β5. In the C-terminal subdomain the following structural elements form the interface: helix α4 (residues 215–228) together with the subsequent loop and 310-helix (residues 232–236) and strand β7 (238–242).
Figure 7.

C-AraR dimer interfaces observed in the crystal structures. (a) The dimeric assemblies formed through interfaces 1 and 2. Molecule A is coloured grey and the two molecules interacting through interfaces 1 and 2 are coloured green and yellow, respectively. l-Arabinose is shown as spheres. (b) Details of residues involved in interfaces 1 (highlighted in green) and 2 (yellow). (c) The solvent-accessible surface of the C-AraR dimer interfaces coloured by residue conservation in closely homologous sequences. The surface is coloured in red to blue, with blue representing a sequence identity of 10% or lower and red representing a sequence identity of over 90%. Regions from neighbouring molecules which are in contact with the interface are shown as ribbons and coloured green and yellow for interfaces 1 and 2, respectively.
Interface 2 has a smaller interface area of 885 Å2, which represents 6.5% of the total solvent-accessible surface area of a monomer. The interaction is mediated almost exclusively through the N-terminal subdomain by 25 interacting residues, including the N-terminal residues, residues 88–92 from the loop connecting strand β1 to helix α1, residues from helix α1 (93–108), residues from strand β2 (111–116) and residues from helix α2 (212–135). Only two residues from the C-terminal subdomain of C-AraR (His304 and Ile308; Fig. 7 ▶ b) are part of interface 2.
Several pieces of evidence point towards the physiological relevance of crystal interface 2 in AraR dimer formation. The dimeric assembly produced by interface 2 allows the appropriate orientation of the DNA-binding domains for DNA recognition and binding (Fig. 7 ▶ a). In contrast, the dimeric assembly produced by interface 1 has a head-to-tail orientation in which the the two N-terminal DNA-binding domains would point in opposite directions, an architecture which is not compatible with DNA binding (Fig. 7 ▶ a). Interface 2 involves residues in the vicinity of the effector-binding site (residues 88–92) and residues at the N-terminus (residue 81) which in full-length AraR are directly linked to the N-terminal DNA-binding domain.
The proximity of the effector-binding site would thus allow an allosteric transition to the dimer interface upon effector binding. Indeed, it has been shown for other members of the GalR/LacI family that the N-terminal subdomain of the effector-binding domain moves upon ligand binding, while the C-terminal subdomain remains fixed (Swint-Kruse & Matthews, 2009 ▶). The residues that participate in interface 2 are more conserved throughout the AraR orthologues than those in interface 1 (Fig. 7 ▶ c). Final evidence comes from the mutation analysis of Franco et al. (2006 ▶), which showed that the mutation of residues Ile89, Tyr92, Glu102, Leu114 and Phe305 resulted in severe defects in AraR function in vivo and their role in dimerization was confirmed by classical transdominant experiments. All these mutations are located in interface 2 or in its close proximity (Fig. 7 ▶ b).
We thus conclude that interface 2 is responsible for AraR dimer formation. Crystal interface 1 might be involved in the formation of higher AraR oligomers, as the cooperative binding of two AraR dimers to two DNA operator sequences that is crucial for efficient repression has been shown experimentally (Mota et al., 2001 ▶).
Comparison of the C-AraR dimer formed through interface 2 with dimers of other proteins from the GalR/LacI family revealed a similarity in the overall head-to-head dimer orientation, but there is nevertheless a substantial difference in the relative orientation of the monomers (Fig. 8 ▶).
Figure 8.

Comparison of the C-AraR dimer with a dimer of PurR. (a) The dimer of PurR from E. coli in complex with hypoxanthine (PDB entry 1qpz; Glasfeld et al., 1999 ▶). The effector-binding domain is represented as a surface, the DNA-binding domain is represented as ribbons and the co-repressor hypoxanthine is represented as sticks. Longitudinal axes of the effector-binding domains are shown as green lines. (b) The dimer of C-AraR. The effector-binding domain is represented as a surface and the inducer l-arabinose is represented as sticks. Longitudinal axes of the effector-binding domains are shown as maroon lines.
The dimers of all GalR/LacI repressors for which structures are available are formed around twofold axes (Fig. 8 ▶ a). Such an orientation is crucial for binding to the inverted-repeat sequences of the operator DNA sites. The mutual orientation of the effector-binding domains in the dimer is parallel and the N-terminal DNA-binding domains point in one direction (Fig. 8 ▶); in particular, the spacing allows high-affinity interaction with the the pseudo-symmetrical DNA operator. The crystal structures and molecular-dynamics studies showed that the binding of the effector molecule triggers a conformational change which is transmitted into the DNA-binding domains and results in the misalignment of the DNA-binding sites (reviewed in Swint-Kruse & Matthews, 2009 ▶).
The dimeric assembly of the effector-binding domains of AraR is structurally different from that of other members of the GalR/LacI family. The effector-binding domains in the dimer are not parallel; the longitudinal axes of the monomers have an angle of about 40° between them (Fig. 8 ▶). The position of the DNA-binding domains in this dimer cannot be predicted. AraR has a rare modular structure with the C-terminal effector-binding domain being homologous to other members of the LacI/GalR family but with the N-terminal DNA-binding domain belonging to the GntR family. The unique dimeric organization of the effector-binding domain might be an indication of a different mode of DNA recognition. Alternatively, the observed dimer architecture might also represent an induced form of AraR in which the N-terminal DNA-binding domains are in a position with no affinity for DNA.
Further studies are required to investigate the structural basis of the formation of the full-length AraR oligomer and the modulation of the protein structure by binding of an effector molecule.
Supplementary Material
PDB reference: AraR effector-binding domain, 3tb6
Acknowledgments
This work was supported by the Ministry of Education of the Czech Republic (research project No. ME08016) and research projects AV0Z40550506 and AV0Z50520514 awarded by the Academy of Sciences of the Czech Republic. Diffraction data were collected on beamline MX14.2 at BESSY, Berlin, Germany. The authors wish to thank Milan Kožíšek of the Institute of Organic Chemistry and Biochemistry AS CR Prague for his help in performing the ITC experiments and Devon Maloy for critical proofreading of the manuscript.
References
- Betts, M. J. & Sternberg, M. J. (1999). Protein Eng. 12, 271–283. [DOI] [PubMed]
- Brünger, A. T. (1992). Nature (London), 355, 472–475. [DOI] [PubMed]
- Chen, V. B., Arendall, W. B., Headd, J. J., Keedy, D. A., Immormino, R. M., Kapral, G. J., Murray, L. W., Richardson, J. S. & Richardson, D. C. (2010). Acta Cryst. D66, 12–21. [DOI] [PMC free article] [PubMed]
- DeLano, W. L. (2002). PyMOL http://www.pymol.org.
- Emsley, P. & Cowtan, K. (2004). Acta Cryst. D60, 2126–2132. [DOI] [PubMed]
- Ericsson, U. B., Hallberg, B. M., Detitta, G. T., Dekker, N. & Nordlund, P. (2006). Anal. Biochem. 357, 289–298. [DOI] [PubMed]
- Franco, I. S., Mota, L. J., Soares, C. M. & de Sá-Nogueira, I. (2006). J. Bacteriol. 188, 3024–3036. [DOI] [PMC free article] [PubMed]
- Franco, I. S., Mota, L. J., Soares, C. M. & de Sá-Nogueira, I. (2007). Nucleic Acids Res. 35, 4755–4766. [DOI] [PMC free article] [PubMed]
- Glasfeld, A., Koehler, A. N., Schumacher, M. A. & Brennan, R. G. (1999). J. Mol. Biol. 291, 347–361. [DOI] [PubMed]
- Haydon, D. J. & Guest, J. R. (1991). FEMS Microbiol. Lett. 63, 291–295. [DOI] [PubMed]
- Henkin, T. M. (1996). FEMS Microbiol. Lett. 135, 9–15. [DOI] [PubMed]
- Holm, L. & Sander, C. (1994). Proteins, 19, 165–173. [DOI] [PubMed]
- Huffman, J. L., Lu, F., Zalkin, H. & Brennan, R. G. (2002). Biochemistry, 41, 511–520. [DOI] [PubMed]
- Krissinel, E. & Henrick, K. (2005). CompLife 2005, edited by M. R. Berthold, R. Glen, K. Diederichs, O. Kohlbacher & I. Fischer, pp. 163–174. Berlin, Heidelberg: Springer-Verlag.
- Landau, M., Mayrose, I., Rosenberg, Y., Glaser, F., Martz, E., Pupko, T. & Ben-Tal, N. (2005). Nucleic Acids Res. 33, W299–W302. [DOI] [PMC free article] [PubMed]
- Lo, M.-C., Aulabaugh, A., Jin, G., Cowling, R., Bard, J., Malamas, M. & Ellestad, G. (2004). Anal. Biochem. 332, 153–159. [DOI] [PubMed]
- Minor, W., Cymborowski, M., Otwinowski, Z. & Chruszcz, M. (2006). Acta Cryst. D62, 859–866. [DOI] [PubMed]
- Mota, L. J., Sarmento, L. M. & de Sá-Nogueira, I. (2001). J. Bacteriol. 183, 4190–4201. [DOI] [PMC free article] [PubMed]
- Mota, L. J., Tavares, P. & Sá-Nogueira, I. (1999). Mol. Microbiol. 33, 476–489. [DOI] [PubMed]
- Mowbray, S. L. & Björkman, A. J. (1999). J. Mol. Biol. 294, 487–499. [DOI] [PubMed]
- Murshudov, G. N., Skubák, P., Lebedev, A. A., Pannu, N. S., Steiner, R. A., Nicholls, R. A., Winn, M. D., Long, F. & Vagin, A. A. (2011). Acta Cryst. D67, 355–367. [DOI] [PMC free article] [PubMed]
- Pantoliano, M. W., Petrella, E. C., Kwasnoski, J. D., Lobanov, V. S., Myslik, J., Graf, E., Carver, T., Asel, E., Springer, B. A., Lane, P. & Salemme, F. R. (2001). J. Biomol. Screen. 6, 429–440. [DOI] [PubMed]
- Řezáčová, P., Kožíšek, M., Moy, S. F., Sieglová, I., Joachimiak, A., Machius, M. & Otwinowski, Z. (2008). Mol. Microbiol. 69, 895–910. [DOI] [PMC free article] [PubMed]
- Řezáčová, P., Krejčiříková, V., Borek, D., Moy, S. F., Joachimiak, A. & Otwinowski, Z. (2007). Proteins, 69, 679–682. [DOI] [PMC free article] [PubMed]
- Sá-Nogueira, I. & Mota, L. J. (1997). J. Bacteriol. 179, 1598–1608. [DOI] [PMC free article] [PubMed]
- Schumacher, M. A., Seidel, G., Hillen, W. & Brennan, R. G. (2007). J. Mol. Biol. 368, 1042–1050. [DOI] [PubMed]
- Stülke, J. & Hillen, W. (2000). Annu. Rev. Microbiol. 54, 849–880. [DOI] [PubMed]
- Swint-Kruse, L. & Matthews, K. S. (2009). Curr. Opin. Microbiol. 12, 129–137. [DOI] [PMC free article] [PubMed]
- Vagin, A. & Teplyakov, A. (2010). Acta Cryst. D66, 22–25. [DOI] [PubMed]
- Weickert, M. J. & Adhya, S. (1992). J. Biol. Chem. 267, 15869–15874. [PubMed]
- Wilson, C. J., Zhan, H., Swint-Kruse, L. & Matthews, K. S. (2007). Biophys. Chem. 126, 94–105. [DOI] [PubMed]
- Winn, M. D., Isupov, M. N. & Murshudov, G. N. (2001). Acta Cryst. D57, 122–133. [DOI] [PubMed]
- Winn, M. D. et al. (2011). Acta Cryst. D67, 235–242.
Associated Data
This section collects any data citations, data availability statements, or supplementary materials included in this article.
Supplementary Materials
PDB reference: AraR effector-binding domain, 3tb6