Abstract
A summary is presented of a range of mathematical models that relate to topical microbicidal molecules, applied vaginally to inhibit HIV transmission. These models contribute to the fundamental understanding of the functioning of those molecules, as introduced in different delivery systems. They also provide computational tools that can be employed in the practical design and evaluation of vaginal microbicide products. Mathematical modeling can be implemented, using stochastic principles, to understand the probability of infection by sexually transmitted HIV virions. This provides a frame of reference for the deterministic models of the various processes that underlie HIV transmission and its inhibition, including: the temporal and spatial history of HIV migration from semen to vaginal epithelial surfaces and thence to the underlying stroma; the time and spatial distribution of microbicidal drugs as delivered by various vehicles (e.g., gels, rings, films, and tablets)—this is central to understanding microbicide product pharmacokinetics; and the time and space history of the drug interactions with HIV directly and with host cells for HIV within the vaginal environment—this informs the understanding of microbicide pharmacodynamics. Models that characterize microbicide functionality and performance should and can interface with both in vitro and in vivo experimental studies. They can serve as a rapidly applied, inexpensive tool, to facilitate microbicide R&D, in advance of more costly and time consuming clinical trials.
Keywords: Microbicides, HIV, Mathematical models, Vagina, Pharmacokinetics, Pharmacodynamics
Introduction
Microbicides
Vaginal drug delivery in general, and microbicide delivery and functionality in particular, are highly complex processes that are not fully understood. The urgency to develop efficacious anti-HIV microbicide products has placed a great deal of pressure on the nascent field of microbicide research and development. The field has been buoyed by successful proof of principle in the CAPRISA trial of a tenofovir gel [1]. In large part, it is following established paradigms for product development, loading different types of active pharmaceutical ingredients (APIs) into a small number of different dosage forms, and urgently subjecting them to a set of in vitro and animal in vivo studies, en route to human trials. In principle, this progression should embody fundamental understanding of the many processes involved in microbicide functionality (biological, biochemical, biophysical, and behavioral), the use of effective materials for the delivery systems, resolute but practical testing and evaluation methods, and the practical considerations of scale up, stability, speed of testing, and cost. Within this microbicide pipeline, there is a place for development and application of mathematical modeling. Modeling has been proven valuable in many contexts of drug delivery, throughout the progression of fundamental understanding to clinical and commercial success [2–4]. To date, the role of modeling within the microbicides field has been limited, but the potential exists for it to contribute more significantly to our definition, and understanding, of the science of microbicide functionality, and to the practical development of microbicide products.
Microbicide bioactivity is manifest to the extent that API molecules are distributed sufficiently throughout the environment in which the virions are introduced and migrate (i.e., pharmacokinetic functioning), and to the extent that the APIs can act at their target sites to diminish infection (i.e., pharmacodynamic functioning). Here, we focus upon the fluids and tissues of the vagina; however, our perspective applies also to the other compartments of the female reproductive tract (e.g., the cervix and uterus) and to the rectum. In addition, although the focus here is upon HIV as the sexually transmitted pathogen, the concepts and methods here have relevance to microbicides for other sexually transmitted infections, including human papillomavirus and herpes simplex virus.
When microbicide APIs are introduced to the vaginal canal, they can in principle be transported into the fluids of the lumen (ambient vaginal fluids or semen) and across the epithelial surfaces into the epithelium proper, underlying stroma and beyond. In general, these APIs could act by either contacting and neutralizing individual virions or interacting with host cells for virions within the tissue. The original candidate microbicide APIs were of the former type, e.g., entry inhibitors that alter the viral envelope [5]. These molecules would be released into the fluids of the vaginal lumen (ambient vaginal fluids, semen) within which they would collide with and neutralize virions, free or cell associated. An initial, biophysics-based deterministic PK/PD model of viral transport and neutralization by such APIs was introduced [6] and will be discussed below. Other types of APIs act against the virus within the tissue underlying the vaginal surfaces, rather than within luminal fluids, e.g., non-nucleoside reverse transcriptase inhibitors and nucleotide reverse transcriptase inhibitors such as tenofovir, which was used in the first statistically successful microbicide gel trial [1]. Alternatively, reduction in the likelihood of infection could be achieved by APIs that contact host cells for invading virions to inhibit the viral replication process, e.g., PSC-RANTES [5,7]. Currently, a number of molecules of this type are being evaluated in the microbicides field.
We can think of delivery of microbicide APIs as a multi-compartment problem, including: the delivery system, ambient vaginal fluid, semen, epithelium, stroma, and the bloodstream. In general, API delivery throughout vaginal lumenal fluids will be faster than API transport throughout the underlying tissue. Understanding API distribution within lumenal fluids is relevant to APIs that act within the tissue—not just APIs that act within those fluids. This is because transport in fluids very likely occurs much more rapidly than transport in tissue: as a result, the surface area over which the APIs contact and enter the target epithelial surfaces is increased from that of the delivery vehicle alone. Substantial increase in the rate of API delivery by convection in vaginal fluid was shown in the model of an intravaginal ring (IVR) discussed below [8]. Notably, loss of APIs from lumenal fluids will also likely be faster (e.g., due to leakage of those fluids) than loss from the tissue compartment.
Different types of dosage forms (e.g., gels vs. rings) will distribute APIs at different rates, into and throughout their target compartments. For example, a gel may be capable of rapid but transient delivery of APIs to vaginal fluids and tissues. In contrast, a ring is attractive because of its capacity for sustained delivery over extended time intervals. Mathematical modeling can help us understand consequences of the differential kinetics of API and HIV transport processes in the presence of these different dosage forms. This has the practical application of helping to establish dosage regimens for different types of dosage forms delivering different types of APIs.
Modeling of microbicides
In general, mathematical models input data to make predictions. In the context of microbicides, such predictions can inform us about how processes related to microbicide product functionality work, or about the extent to which a particular product (API+delivery system) achieves defined performance standards. A classical type of modeling in the context of drug delivery is compartmental analysis, which can help elucidate pharmacokinetics [2–4]. This has been used to help establish important contrasts about microbicide delivery by different dosage forms [9], and we shall give further examples of it below. Differences in model predictions (e.g., of API concentration distributions) provide comparisons that, oftentimes, are as valuable as the individual predictions themselves. In particular, differences in model predictions of measures of microbicide product performance can help rank order candidate products during the course of development. This is illustrated below [10].
The accuracy of models depends in part on the extent to which they capture—mechanistically and/or stochastically—the essences of the phenomena which they are characterizing, and in part on the accuracy of the values of parameters that must be input to them (e.g., API diffusion coefficients, and partition coefficients at the epithelial surface). Those parameters are generally obtained by experiment. Of course, the accuracy of a model is ultimately validated by comparison of its predictions per se with experiments. A corollary to this definition of validation is that contrasts predicted by multiple applications of a model should correspond to contrasts obtained in experiments. This complementary aspect of validation is particularly relevant to the microbicides field. Experimental data related to pharmacokinetics (and pharmacodynamics) are limited. Species differences challenge the quantitative translation of animal data to the human. And, of course, there is no “validated” efficacy of any microbicide product to date. In this context, it becomes expeditious to use modeling to rank order microbicide functioning and product performance. Reliance upon individual quantitative predictions by models is still limited.
Scope of this review
This article will address several interrelated types of modeling approaches within the microbicides field. We begin by briefly summarizing a stochastic analysis of the probability of infection [11]. The model here contains the number of transferred infectious virions as the salient independent variable. Parameters are introduced that characterize viral infectiousness and clearance rate, and also the density of infectible host cells that virions must contact in order to initiate transmission. The bioactivity of topical microbicidal APIs can alter viral infectiousness. The microbicide product can potentially alter the number of virions (infectious or not) that migrate from HIV-laden semen to the vaginal (or rectal) epithelial surfaces. Thus, there is a link between this stochastic model and microbicide functionality, and this is addressed in the paper [11].
We next consider the time- and space-dependent distributions of APIs, i.e., their pharmacokinetics (PK). We summarize a particular approach to compartmental modeling that is relevant to microbicides, and that is somewhat unusual in that the spatial distributions of APIs within compartments are computed, not just differences in spatially averaged concentrations between compartments. This is necessary because the biophysical mechanisms of exchange between compartments depend upon concentration distributions within them, of both APIs and virions. We will also consider models that characterize the time- and space-dependent distributions of virions introduced in semen, and the interactions of those virions with APIs. Since those interactions can lead to viral neutralization and reduction in the likelihood of infection, they can be termed pharmacodynamic (PD) models. The primary focus here will be upon models in which the microbicide delivery system is a semi-solid material, such as a gel. To date, there has been relatively little PK/PD modeling for other dosage forms, including rings. Given the current importance of IVRs in the microbicide pipeline, it is important that they become a priority in further modeling efforts. Understanding drug delivery by a vaginal gel requires analysis of the spreading of the gel along the vaginal canal, which develops a coating of the epithelial surfaces. We will summarize several generations of models of this process, and their incorporation into a practical algorithm for rational design of an optimal gel. In addition, we will present results for an initial modeling study of API delivery by an IVR and will mention very new work on vaginal deployment and API release by a film.
The probability of infection by sexually transmitted HIV
In the study of infection by HIV, stochastic and statistical models have contributed to our understanding of the likelihood of infection, and of the roles of biological and behavioral factors, such as viral load in semen, viral infectiousness, and frequency of exposure in this process [11–21].
Tuckwell et al. [11] presented a stochastic analysis of the probability of infection by HIV, including consideration of the effect of a topical microbicide in diminishing this probability. The analysis focused upon the number of infectious virions, termed n, that were “transferred” to the host, that entered the bloodstream, and that were capable of infecting cells (e.g., CD4+ T cells) therein. Although this model focuses upon the onset of infection by transport of virions to infectible cells within the bloodstream, it can be interpreted with respect to initial infection of cells at other sites, e.g., within the vagina. Specifically, the model could be extended to focus upon contact of virions with potentially infectible cells on the surface of the vaginal epithelium (e.g., Langerhans cells) and/or cells within the tissue beneath those surfaces (e.g., CD4+ T cells, macrophages, and Langerhans cells within the stroma).
The model incorporates salient biological aspects of the infection process by including a clearance rate, c, of the transferred virions, and also a measure of the infectivity of a virion, k, based on the infection rate of an infectible cell per virion. In addition, the model includes the concentration of infectible cells in the bloodstream, termed T. A general expression is developed for the probability Pinf(t) that at least one host cell is infected, as a function of time t.
| (1) |
In the limit of long times, this reduces to
| (2) |
Equations 1 and 2 indicate that there is as the number of transferred infectious virions decreases, its effect on infectivity is a negative exponential. The analysis by Tuckwell et al. illustrated this by estimating values the parameters in the model from epidemiologic and biological data, and also results of prior models related to HIV infectivity [22]. Of course, there is inherent biological variability in the values of these parameters, and the analysis considered upper and lower bounds, in order to get a sense of the magnitudes of changes in infectivity. Specifically, the model was applied to viral transfer by needlestick and by heterosexual intercourse. For the latter, Eq. 2 was simplified to contain a single lumped parameter, γ=kT/c.
| (3) |
Using epidemiologic data, upper and lower bounds for γ were taken as 7.82×10⁻⁸ and 6×10⁻⁷, respectively. Figure 3 of the Tuckwell paper (reproduced here as Fig. 1) illustrates the dependence of Pinf upon n for these two values of γ.
Fig. 3.
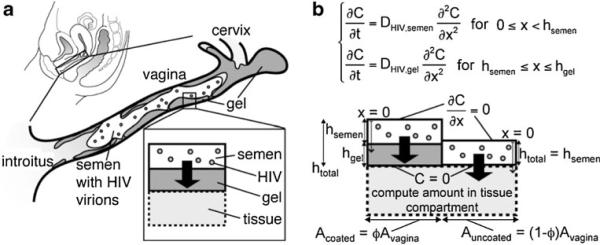
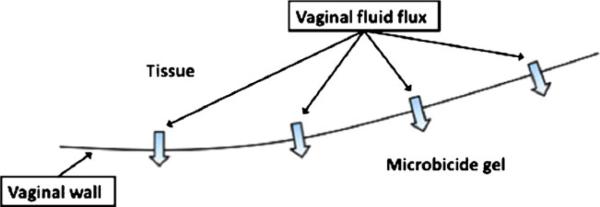
From reference [26]: a cartoon of vaginal coating by a gel in the presence of HIV-laden semen; b schematic of two side-by-side bins in the compartmental model of HIV transport from a semen layer to a partially coated vaginal epithelial surface. The left bin contains gel coating and the right bin does not. In the model, imaging data of the entire epithelial surface are discretized to create a mosaic of these types of bins, with varying heights and surface contact areas
Fig. 1.
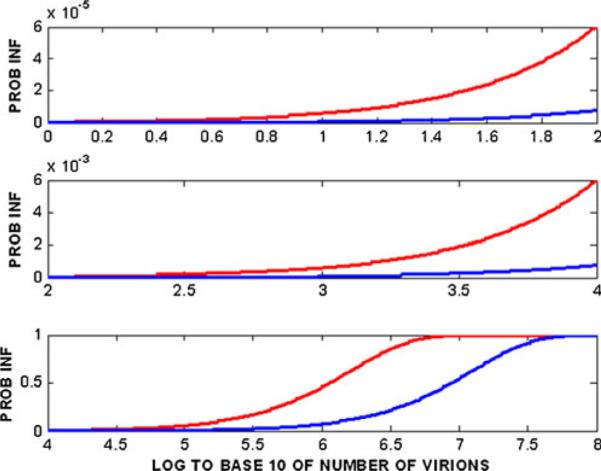
Probability of HIV-1 infection from heterosexual intercourse as a function of log10 of the number of virions transferred, based upon the Tuckwell et al. model [11]. The blue and red curves are for γ=7.8×10⁻⁸ and 6.0009×10⁻⁷, respectively
The analysis characterizes the effect of a microbicide as the extent to which it diminishes n. This is done by introducing an efficacy parameter, q, ranging from (0,1) such that n is reduced to n(1−q). Thus, for example, a microbicide that is termed “90% efficacious” would reduce n by a factor of 10. Figure 2 here reproduces Fig. 4 of the paper, which depicts the dependence of the percent reduction in infections due to the microbicide vs. log10(n) for γ=7.8×10⁻⁸.
Fig. 2.
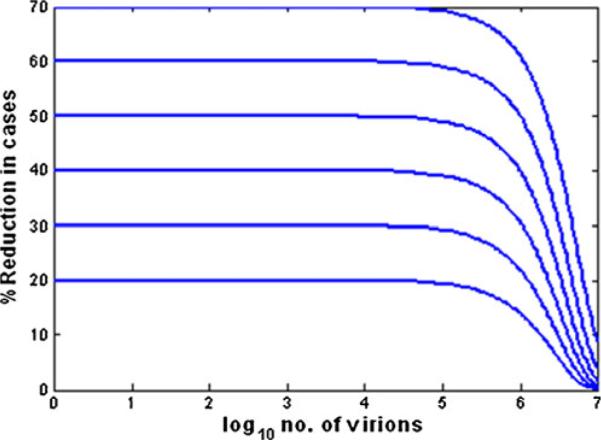
The percent reduction in the probability of infection as influenced by microbicides with different efficacies, as defined by the factor q in the Tuckwell model [11]. The values of q range from 20% to 70%
Fig. 4.
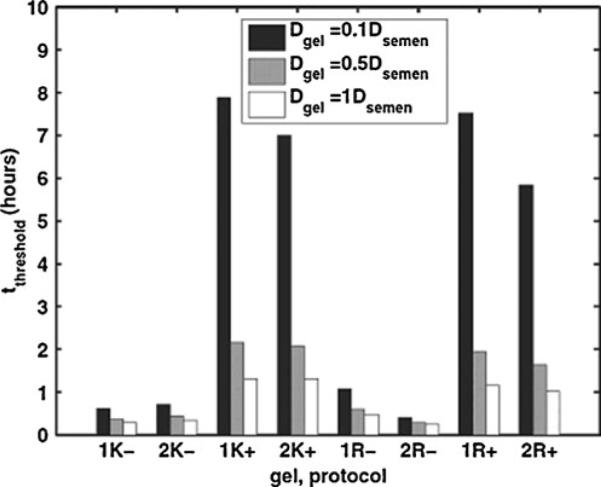
From reference [26]: model-predicted values of time to threshold for HIV transport through two vaginal gels to the epithelial surface. Vaginal epithelial gel coating distributions were imaged after gels were applied by women in two different protocols (supine or simulated coitus). Coating data were input to the HIV transport model. K KY jelly, R Replens. Numbers 1 and 2 represent the replicate experiments; plus sign indicates simulated coitus; minus sign indicates no simulated coitus; and the three bars represent three different values of virion diffusion coefficient in gel in relation to that in semen
Of particular note are that: (1) in Fig. 1, the probability of infection starts to increase significantly from O (0.01) as n rises above 105; and (2) in Fig. 2, the percent reduction in infectivity is invariant to n (and is close to the limiting value q) for n≤105, and drops precipitously to zero as n increases from 105 to 107 virions. Clearly, the variable n is central to the biology of HIV transmission and to the quantitative predictions of the Tuckwell et al. model, the mechanisms and sites of HIV transmission notwithstanding. The findings of the model provide a focus and quantitative frame of reference for further studies, experimental and theoretical (i.e., modeling). It is possible to create deterministic models that predict n, as based upon viral load in semen and properties of the vaginal environment. These models can be expanded to include the presence and activities of different types of APIs delivered by different types of dosage forms. Such models are considered in the following sections.
Delivery systems for microbicidal APIs with different mechanisms and sites of action
Several types of delivery systems (often termed “dosage forms”) are currently being evaluated for microbicides. These range in material properties from solid (e.g., intravaginal rings) to semi-solid (e.g., gels, dissolving films, and dissolving tablets or capsules) [23]. The time-space history of drug delivery obviously varies across these different dosage forms. So, too, does the time time-space history of the population of semen-borne virions. The physical presences of the delivery systems impede the migration of semen-borne virions to epithelial surfaces, to varying degrees. Semi-solid delivery systems offer the possibility of coating a large portion, if not all, of the vaginal epithelium. The physical presence of such coating can retard the migration of HIV virions [24,25], apart from the transport of APIs. Such slowing of HIV migration from semen to epithelial surfaces provides increased time for lumenally acting APIs, and also ambient host defense processes, to reduce the innoculum of infectious virions that contact epithelial surfaces. Intravaginal rings do not create so great an impediment to HIV transport. However, they provide the opportunity for sustained API delivery over time. In contrast, semi-solid vehicles have a finite residence time within the vagina, and are susceptible to leakage out from the introitus.
HIV transport from semen through a vaginal gel coating layer
When semen is deposited in the vagina after gel has been applied and has spread along the vaginal canal, a seminal fluid layer exists over the gel coating. If the coating is incomplete, i.e., if there are regions of the epithelial surfaces devoid of coating, then the semen layer directly contacts the epithelium exposed in those bare spots. A mathematical model was created of diffusional transport of HIV virions from semen to a vaginal surface that is partially coated by gel [26]. The model contains two types of compartment configurations: (1) semen-over-gel and (2) semen-overlying-tissue. These exist in a mosaic of side-by-side “bins” of different heights and widths to represent the entire distribution of surface coating. Data to construct this mosaic can be obtained from vaginal imaging studies [26–28]. Figure 3a (from reference [26]) illustrates vaginal coating in general, and Fig. 3b shows two side-by-side bins, one with coating and one without coating. The fraction of total surface with coating is given by the parameter ϕ ranging from (0,1). It is assumed that the semen and vaginal fluid are fully mixed and that the gel displaces any vaginal fluid initially underneath it.
The model was applied to coating data obtained by optical imaging of human vaginal coating thickness distributions of two commercial vaginal gels—KY Jelly lubricant (based on hydroxyethylcellulose) and Replens moisturizer (based on Carbopol) [26–28]. A key output of the computations was the time after which a threshold net number of virions reached the surface. This threshold number, taken as 1.7×10⁻⁴ virions, is a conservative estimate of the number of virions statistically required for infection to be likely, and is one tenth the number of virions introduced in a typical infectious ejaculate. Figure 4 shows results of the model as applied to imaging data for eight experiments, four for each gel; of those four experiments, two were for gel distribution when the woman remained in the supine position between gel application and imaging (10 min later), and two were for a protocol in which the women underwent simulated coitus with an artificial phallus prior to imaging (10 min later). Results are given for different values of the diffusion coefficient of the virions within the gel layer, which was not known. The value of the diffusion coefficient in the semen was obtained from the Stokes-Einstein equation, using rheological measurement of viscosity. As a reference, a later study by Lai et al. showed that the virion diffusion coefficients in two microbicide placebo gels are orders of magnitude lower than those that are in the semen unless the gels are diluted substantially (viz. ≥80%) [24].
This model analysis had several important conclusions: (1) the net transport of virions through a non-uniformly distributed coating—i.e., coated regions with locally varying tissue contact areas and coating thickness, and through bare spots with locally varying areas, could be accurately modeled as transport in a two-bin configuration: one bin contains coating and the other does not; the relative contact areas of the two bins are based on the net fraction of surface with coating, ϕ; the thickness of gel coating in the gel bin is the harmonic mean of the thicknesses of all the local gel-coated regions (obtained from imaging; cf. [29]); (2) for gel layer thicknessesof ≥100 μm, it is the fraction of surface coating ϕ, not gel thickness, that is the primary coating determinant of viral transport rate to the tissue surface; and (3) values of ϕ≥0.80 are necessary if the gel is to serve as a significant barrier to HIV diffusion—this is illustrated in Fig. 5. These results thus provide a guide to the interpretation of imaging studies of vaginal microbicide gel distribution: key parameters to be obtained are the fraction of surface with coating and the harmonic mean of the local coating thickness.
Fig. 5.
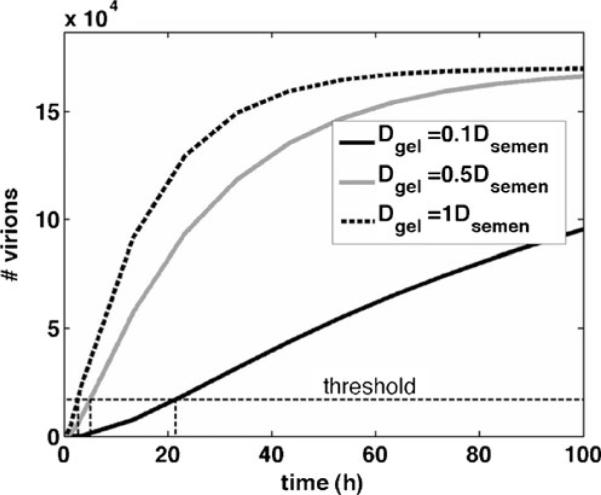
Model-predicted tradeoffs between gel layer thickness and fractional area coated in determining the time to threshold for numbers of virions transported from semen to the vaginal surface [26]. Computation is for a consolidated two-bin model, i.e., the epithelial surface has two regions, one coated by gel and one not coated, cf. [26]. For the imaging data given in the Lai et al. study [26], it has been shown that times to threshold predicted by this two-bin model are relatively close to those of the original computations, provided the height of the gel coating is the harmonic mean of the coating thickness distribution obtained from imaging, and the ϕ value is equal to that obtained from imaging [29]
Simultaneous, interacting HIV and API transport in the presence of a gel layer
An initial model of interacting, co-transport by diffusion of semen-borne HIV virions and the API Cyanovirin-N (CV-N, delivered in a gel) was developed [6]. This protein API is an entry inhibitor that functions by colliding with virions in fluids within the vaginal lumen, binding to glycan residues on their envelopes before the virions can contact vaginal epithelium, and thus acting to inhibit gp120 fusion with host cells. In this model, the gel coated the vaginal surface completely with uniform thickness. That is, it consisted of a single bin, as depicted above in Fig. 3b. Details of the kinetics of (CV-N)–virion binding and virion neutralization were incorporated into the model, which consisted of 124 simultaneous-coupled diffusion equations (to account the various states of virion binding and neutralization).
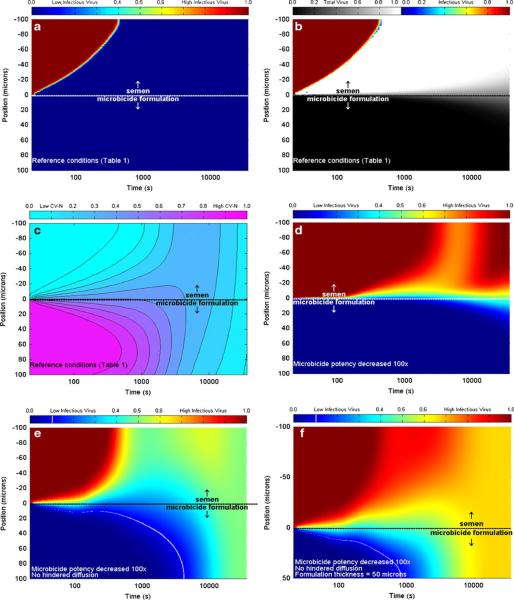
Outputs of this model are illustrated in Fig. 6, which presents the time-space concentration profiles of total and infectious virions and also of the API.
Fig. 6.
Results of the compartmental model of interacting co-transport of semen-borne HIV virions and the gel-borne API Cyanovirin-N (6). The top layer is semen (thickness, 100 μm) and the bottom layer is gel (thickness, 100 or 50 μm). Color bars denote concentration values relative to initial concentration. a Infectious virus concentration for reference conditions of layer thickness, virion diffusion coefficient (reduced by factor 10−4 vs. that in semen); b total (grayscale) and infectious (color) virus concentration for reference conditions; c API concentration for reference conditions; d infectious virus concentration when API potency is reduced by 100×; e infectious virus concentration when API potency is reduced by 100× and virion diffusion coefficient in gel not is reduced from that in semen; f infectious virus concentration when API potency is reduced by 100×, virion diffusion coefficient in gel is not reduced from that in semen, and gel layer thickness is reduced to 50 μm. White lines in (e) and (f) denote one log reduction in viral concentration vs. that in semen
The principal findings of this model analysis were that gel layers of the order of 100 μm thickness are sufficient for effective neutralization of semen-borne virions by CV-N before they migrate to the tissue surface, provided the surface is fully coated and the diffusion coefficient of virions in the gel is reduced by orders of magnitude vs. that in semen (Fig. 7). The latter is a reasonable assumption if the gel is diluted ≤80% [24], but as noted above, gel coating of the vaginal epithelium may not be complete. We discuss this further below in the “Future directions” section.
Fig. 7.
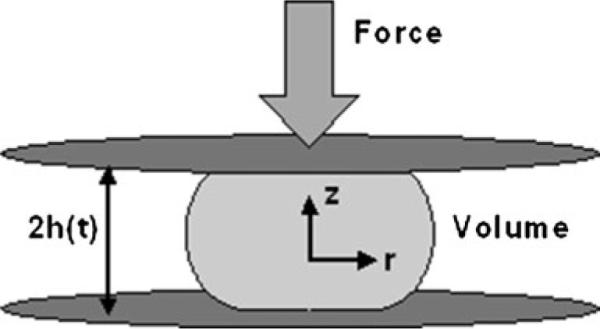
Schematic of original disk model for vaginal gel spreading [31–35]. The gel bolus is shaped like a circular disk that spreads radially, and axisymmetrically, due to application of a uniform and constant force (from the vaginal walls) to its upper and lower surfaces
Vaginal coating by microbicide gels
Distribution of a gel-borne API throughout the vaginal environment begins at the time of gel insertion and continues during the process of gel spreading and coating of the epithelial surfaces. Gel spreading influences API delivery in three primary ways: (1) it increases the surface area over which drug is released to ambient vaginal fluids and tissue surfaces; (2) it contributes a convection velocity that, together with diffusion, drives drug transport; and (3) the diminishing local thickness of the gel, as is spreads, reduces the distance that gel-borne APIs must travel before being released. In addition, as noted above, the presence of a gel layer over the vaginal surfaces creates an impediment to the transport of semen-borne HIV virions, which can slow the virions and thereby provide increased time for their contact with, and neutralization by, APIs and/or ambient host defense molecules.
Gel spreading is a biomechanical process. Forces are applied to the gel—by the vaginal walls (due to their inherent material properties, e.g., elasticity), by pressure gradients acting along the vaginal canal (that could originate from changes in intraperitoneal pressure), and by gravity. Rheological properties of a gel govern its resistance to those forces. The balance between the applied forces and gel rheological properties is manifest Newton's second law of motion. This can be expressed mathematically as a system of coupled differential equations in which the local time- and space-dependent gel velocity and the local pressure are the dependent variables (i.e., outputs of solution of the equations). From the velocity field, the distribution of gel along the vaginal canal, including the coated area and distribution of coating thickness, can be calculated.
Strictly speaking, the gel spreading processes may not culminate in a steady state because: (1) the gel may leak out from the vagina; and (2) gel properties, and therefore distribution mechanics, change over time as the gel imbibes vaginal fluids—the ambient vaginal fluid transudate, semen, and mucus that might have leaked out of the external cervical os onto the floor of the vagina [30]. These processes should be taken into account in modeling and are discussed further below.
Initial models
The original model of vaginal gel coating was introduced by Plenys [31] and elaborated by Kieweg [32], Kieweg and Katz [33,34], and Lai et al. [35]. These analyses focused upon flow driven by the squeezing force of the vaginal walls, which was taken as a constant, generally 1 lb f= 4.45 N. Scaling arguments show that this force is likely to be larger than either the body force due to gravity or any transvaginal pressure gradient force. The complex, non-Newtonian properties of the gel (viscosity is not constant, but varies with local shear strain rate; a yield stress may be present) were taken into account, and input from in vitro rheometry. It is important to emphasize that the formalism (termed the constitutive equation) in which viscosity is related to shear strain rate may be different for different gels; this is primarily manifest in viscosity behavior at low shear rates, and in the possible presence of a yield stress within the gel. For example, a log–log plot of viscosity vs. shear rate might effectively be a straight line with negative slope, for which the Power Law formalism is appropriate. Alternatively, if there is a “shoulder” in this curve at low shear rates, the Carreau model would be more accurate (cf. discussion in Lai et al. [35]). In these original models, the geometry of the gel was a circular disk that spreads between two flat walls as they squeeze against it, giving rise to an axisymmetric flow; this leads to considerable analytical simplifications in mathematical analysis (and is the archetypal geometry studied in fluid mechanical analyses of squeezing flows) [36–38].
Since gel volume V is conserved, V=2πR(t)2h(t)=A(t)h (t) where t is time, R(t) is instantaneous radius of the bolus, 2 h(t) is instantaneous height of the bolus, and A(t)=2πR(t)2 is coated area. As a general observation, gels comprised of celluloses and carrageenans do not generally exhibit yield stresses. Gels containing derivatives of polyacrylic acid (e.g., Carbopol and polycarbophil) do tend to exhibit yield stresses. The following two figures illustrate results of the initial modeling.
Figure 8 shows that spreading rate (as reflected here by the drop in h(t)) varies amongst the commercial vaginal gels, a consequence of differences in their rheological properties [33]. Figure 9 shows how varying the concentration of Carbopol—which induces changes in both gel viscosity vs. shear rate and in yield stress—leads to significant changes in rate of spreading (Fig. 10). There is clearly a nonlinear relationship between Carbopol concentration and spreading rate, and this cannot be inferred from monitoring changes in simple measures of viscosity at a fixed shear rate (which is a common approach in traditional pharmaceutics based monitoring of gel integrity). Understanding such a concentration dependency for gel rheology and spreading can be valuable in the rational design of gel with optimal properties and performance, as presented below [10].
Fig. 8.
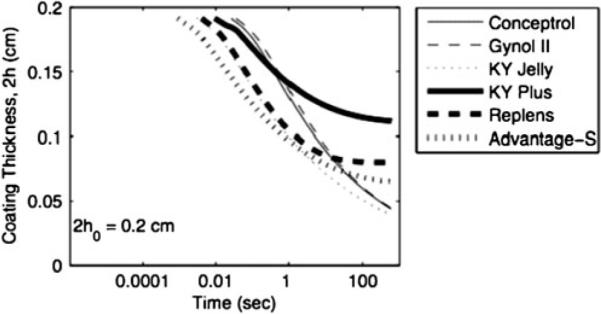
Predicted coating thickness vs. time for several undiluted commercial gels with different compositions and rheological properties, as computed by the model disk model in Kieweg and Katz [33]. Gel volume is 3 mL and vaginal squeezing force is 4.45 N
Fig. 9.
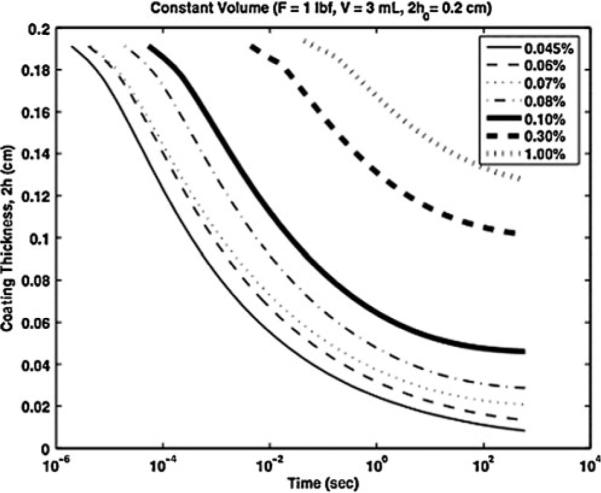
Predicted coating thickness vs. time for different concentrations of Carbopol in a prototype gel [33]. Here, gel volume is 3 mL and the squeezing force is 4.45 N
Fig. 10.
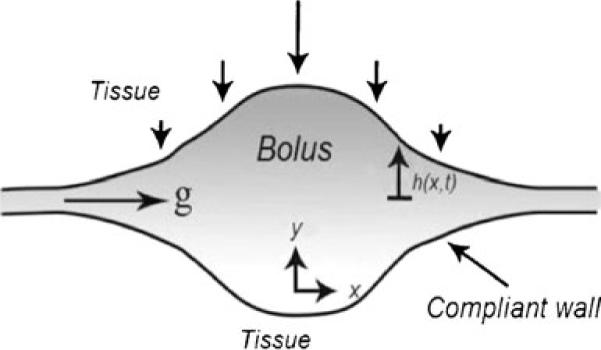
Schematic sketch for spreading of a bolus of microbicide gel between vaginal epithelial surfaces are deformed by the gel due to their elasticity. In this model, the elastic squeezing force is directly taken into account [40]. Gel height is exaggerated
More realistic geometry and vaginal force characterization
More recently, three significant improvements in the modeling of vaginal gel spreading have been introduced: (1) the geometry of the flow has been changed to become a gel bolus spreading along a channel, which more realistically characterizes the anatomy of the vaginal canal (which has a cross section that is often flat); (2) the vaginal squeezing force has been defined in relation to the measured elasticity of the vaginal walls; and (3) the force of gravity on the gel has been analyzed. Improvement (1) is of particular and not necessarily so obvious note. Shear strain rates in the channel flow are generally lower than those in the circular disk flow. This is a common phenomenon in fluid mechanics, and is a subtle consequence of the constraints of conservation of mass and how fluid disturbances propagate in two vs. three dimensions [39]. It is significant here because it means that the low shear rate behavior of the gel becomes more important in the channel flow. Consequently, rates of spreading are predicted to be lower than those computed with the disk models. In addition, it is particularly important to employ rheometry that can accurately measure such low shear strain rate behavior (viz. rates, ≤0.1 s−1), and a constitutive equation that is accurate at these lower rates.
Szeri et al. [40] introduced the channel flow geometry to the vaginal gel spreading problem, including the force of gravity, and characterized vaginal wall squeezing force directly with respect to the elasticity of the walls (Fig. 10).
It was shown that the elastic squeezing force is proportional to gel volume; consequently, studies of spreading by different gel volumes should scale the squeezing force accordingly. The theory by Szeri et al. was set up for a non-Newtonian Carreau fluid, but quantitative results were obtained primarily for a Newtonian fluid. Results show how different parameters in the problem can be combined into lumped dimensionless numbers that characterize features of the flow, cf. [41]. For example, it was found that a single dimensionless number, W, independent of viscosity, characterizes the relative influences of squeezing and gravity on the shape of spreading and extent of coating: W=8rg/εM (where ε is the ratio of height to length scales (which is small), r is the density, g is gravitational acceleration, and M is the wall compliance). A second dimensionless number, ts, involving viscosity, determines spreading rate: ts=8mo/(ε2MH), where mo is a representative viscosity and H is a height scale. Further results of this model are presented below in the section on gel dilution.
There does exist a small amount of data on the elasticity of the human vaginal walls [42]. From these data, the elastic modulus of the human vagina can be computed to be in a range of about 12–36 kPa. From this result, it can be deduced that for a gel bolus volume of 3.5 mL, the net elastic squeezing force is in the range of 2–12 N. Thus, the earlier use of a constant value of 4.45 N in vaginal squeezing flow computations is reasonable.
The elastic squeezing model, while the most biophysically accurate model of vaginal gel spreading to date, remains computationally demanding. Consequently, we have introduced a simplified approach in which channel geometry has uniform thickness, and the squeezing force is taken as proportional to gel volume, consistent with results of the elastic squeezing model (Fig. 11) [43]. Computations with this model are much faster, and suitable for practical large scale implementation in gel design and evaluation. Comparisons to date show good agreement of predictions of spreading by this simplified method and the inherently more accurate elastic squeezing model. For gels undiluted and diluted 10% with vaginal fluid simulant, results are within 3% of each other. For more diluted (20% and 30%) gels that are less viscous and less non-Newtonian, results agree within 10%. In analogy with the original circular disk model, an analytical solution for coated area vs. time can be obtained here for a non-Newtonian fluid obeying the Power Law constitutive equation; for a Herschel–Bulkley fluid (yield stress present), a corresponding nonlinear ordinary differential equation is obtained and can be integrated numerically.
Fig. 11.
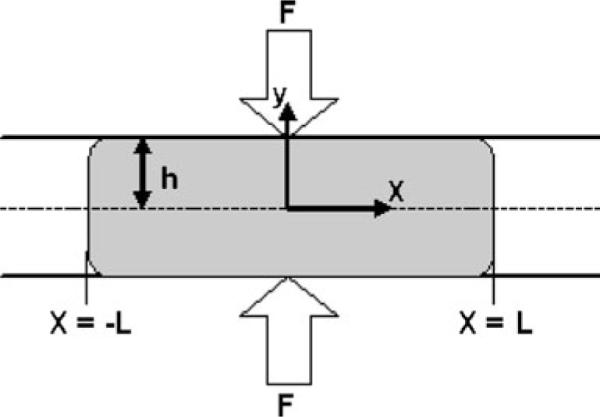
Schematic of a simplified channel flow model for spreading of a bolus of vaginal gel. This model is a simplification of the elastic channel model [40], and is more computationally practical, at present
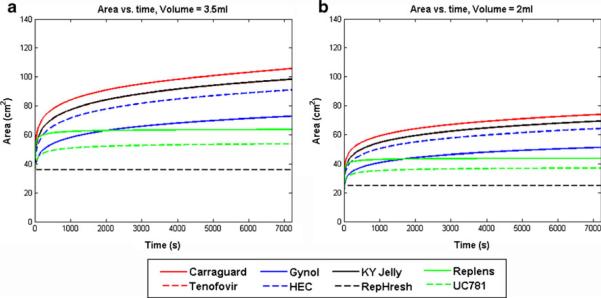
Results for this simplified channel model are given in Fig. 12 for a set of commercial vaginal gels and prototype microbicide gels and placebos, which exhibit a range of rheological properties (see the Electronic supplementary material).
Fig. 12.
Predicted coating area vs. time for the channel flow model of gel spreading, as applied to a set of gels with varying compositions and properties (see the Electronic supplementary material). Gel volumes are 3.5 and 2 mL, and the squeezing force (proportional to gel volume) is 4.45 N for the 3.5 mL volume. These computations were performed using rheological data for the gels undiluted
As seen in Fig. 12, there is a twofold range across gels in values of predicted coated area after 2 h of spreading. There is also a significant effect of gel volume on coated area. Given that the surface area of the human vaginal epithelium is about 100 cm2, we see that some gels, at 3.5 mL, coat a relatively small fraction of that surface, and others coat nearly all of it or even overcoat, which would cause gel leakage. At the smaller gel volume, none of the gels are predicted to coat the entire vaginal surface in 2 h.
Gel dilution by vaginal fluid
At any instant, the vagina contains some native fluid, which is primarily a transudate and which may contain some cervical mucus that has leaked onto the floor of the vagina (primarily during the peri-ovulatory period when mucus is most abundant). Thus, an inserted gel bolus comes in contact with this fluid as it begins to spread. There is not a great deal of information about ambient vaginal fluid (cf. the pioneering work by Masters and Johnson [44], and also [30]), in part because it is difficult to sample. The typical maximum volume at any instant was previously estimated to be about 0.75 mL [30], but this is likely to vary considerably, within and among women. A recent study obtained a median volume of 0.51 mL (interquartile range, 0.33–0.69 mL) [45].
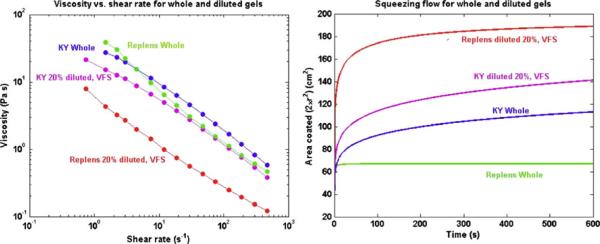
It is possible that the presence of vaginal fluid varies along the length of the vaginal canal (as suggested in figures in Masters and Johnson, [44]). Letting the range of gel volumes be 2–4 mL, and taking vaginal fluid volume as 0.51 mL, it follows that maximum net gel dilution would range from about 13% to 26% (v/v). However, if the amount of fluid varies along the canal, then local gel dilutions could be transiently higher. Dilution alters the configuration of a gel's molecular microstructure, with a concomitant change in macroscopic rheological properties. The original approach to accounting for the dilution process was to measure rheological properties after serial dilutions with stimulant fluids for vaginal fluid and semen (with thorough mixing) [46]. Spreading flow computations were then performed for whole vs. diluted gels, and conjectures were made about the effects of dilution in vivo. Figure 13 illustrates this, giving results from the study by Lai et al. [35]. Note that the effect of dilution on spreading is greater for Replens (a Carbopol emulsion) than for KY Jelly (a hydroxyethylcellulose gel). This is due to the greater loss of viscosity and the fact that there is a significant yield stress in undiluted Replens; the yield stress is largely eliminated by dilution. There is no yield stress in KY Jelly, and we have found that the absence of a yield stress is common for cellulosic gels that do not contain cross-linking components such as Carbopol or polycarbophil (Fig. 14).
Fig. 13.
Rheological data for viscosity vs. shear rate, and spreading flow computations for KY Jelly and Replens [35]. Effects of dilution by 20% with vaginal fluid simulant (VFS) are shown. Note the differential response in the viscosity vs. shear rate data, and computations of coated area, for the two gels vs. dilution
Fig. 14.
Schematic of the configuration of the model in which vaginal fluid at the epithelial surface is transported into a spreading gel [50]
In actuality, gel dilution is a dynamic physiochemical process, in which fluid contacting the gel is imbibed by the gel, due to mechanisms such as water diffusion and convection, and osmotic pressure differences. Such dilution is not uniform, and its extent (expressible as the local volume fraction of imbibed water) varies as a function of time and location within the gel. There is a literature of mechanistic analyses of dilution of stationary gels [47–49]. Recently, a mechanistic model was created of dilution during gel spreading due to squeezing along the vaginal canal [50]. This model simultaneously computes water uptake by the gel, and time-dependent gel spreading. The latter takes into account local time-dependent changes in gel rheological properties due to dilution; data on these are input from serial dilutions of the gel with the diluting fluid. That is, local gel rheology is a mosaic that depends upon instantaneous dilution.
The model characterizes water transport into the gel using a convection-diffusion equation in which the diffusion coefficient depends upon local water volume fraction within the gel and also a parameter that characterizes the physicochemical interaction of the water with the gel network. Gel flow is modeled using the full elastic squeezing theory introduced earlier for undiluted gels [40].
The new theory is this model was initially applied, in conjunction with detailed data on rheology vs. dilution, to a HEC gel that is similar to the universal placebo used in microbicide gel trials. Figure 15 shows coated area vs. time for varying values of the flux of vaginal fluid at the gel-tissue surface interface.
Fig. 15.
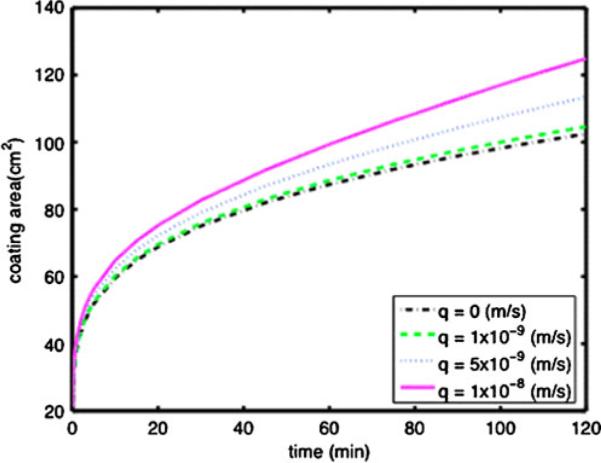
Coated area vs. time for a 3.5 mL volume of a HEC gel, for varying values of the flux, q, of fluid at the gel-tissue interface, as computed using the new model that incorporates the dynamics of gel dilution into the gel spreading model [71]
These results show that local gel dilution is clearly non-uniform. Close to the gel-tissue interface there is a thin layer of more highly diluted gel vs. that in the gel interior, and this acts to lubricate the overall, bulk coating flow. As seen in Fig. 15, the net area coated at 2 h is about 20% higher than that if there were no gel dilution. Net dilution of the gel is about 10%. The increase is gel spreading is slightly higher than that which would be predicted from a computation of spreading of a gel homogeneously diluted by 10%. These initial modeling results are clearly a starting point for increased attention to affects of dilution on microbicide gel distribution and drug delivery. They also relate to recent work on fluid uptake and drug release by intravaginal films [51].
Gravity-driven sliding of a gel with an upper free surface
It is possible that there are conditions in which at least a portion of an inserted gel does not contact both vaginal walls, but deploys as a coating over one of them. The opposite gel surface is termed a “free surface.” If the orientation of the local vaginal axis is not horizontal, gravity will tend to push the gel downward, a process termed “sliding” [52]. Kieweg introduced a model of free surface gel flow due to gravity [32], and more recently has elaborated the analysis [53], cf. Fig. 16. This modeling is highly detailed with respect to the shape of the leading edge of the gel and the local velocity distribution within the gel. It has not yet been applied in comparisons of spreading across contemporary commercial and microbicide-related vaginal gels.
Fig. 16.
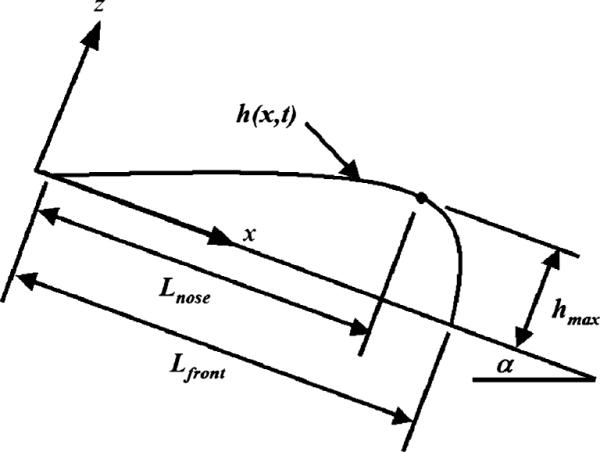
Coordinate system and parameters for model of spreading of gel due to gravity [72]. The upper gel surface is a free surface, and the gel slides down a flat surface due to the force of gravity [53]. This is a two dimensional channel-like model, akin to that in Fig. 11
Comparison of modeling results with in vivo imaging data
Although the models of vaginal gel spreading are mechanistic, and in the spirit of a very large body of modeling of biomedical fluid flows, comparison of their predictions vs. experimental in vivo data is important—to provide credibility and to inform the improvement of the models. Of course, the conditions of actual gel application in vivo are far more complex than the simplified, idealized ones in the models. For example: (1) the elasticity of the vaginal wall is not likely to be constant along the length of the canal [42]; (2) the distribution of vaginal fluid is likely not constant along the vaginal canal [44], and this exacerbates the spatial heterogeneity as well as time-dependence of gel dilution; (3) a women's posture (and therefore the gravitational and possibly the squeezing force) changes over the time course of gel residence in the vagina; and (4) the geometry of the vaginal canal is not exactly that of a straight channel of rectangular cross section, containing a bend, or “flexion” [54]. Notably, analogous differences between details of computational models and actual conditions of the biological and physiological flow systems which they depict are commonplace in biomedical fluid dynamical modeling [39,55]. What these models do seek to capture are the primary factors that govern the flow characteristics of importance. For example, in the modeling of blood flow in the cardiovascular system, an essential relationship involves the collective effects of the pressure gradient (and, therefore, blood pressure), the diameter of a vessel, and the elasticity of the vessel walls on blood flow rate through the vessel [56,57]. That the geometry and forces in the models of this flow system are not identical to those in vivo, does not obviate the value of the models in understanding the physiology of the system. Although their quantitative outputs may not exactly predict phenomena in vivo, they can provide valuable guidance to the interpretation of measurements of blood pressure, vessel size and vessel elasticity, especially contrasts or changes in them.
The value of models of microbicide-related transport processes, e.g., API distribution and gel spreading, is analogous. Validation of the former is challenged by differences between in vitro and in vivo measurements of API release and distribution. The models of gel spreading embody gel volume and properties and how they change in vivo, the principal forces that drive spreading, and the basic shape and size of the lumen of the vaginal canal. The models predict the distance that the leading edge of the gel has spread from its initial position, the coating thickness distribution and the coated area of the gel over the vaginal tissue, as functions of time after gel insertion. Adaptation of modeling to specific studies of in vivo gel distribution must be undertaken carefully, in order to simulate as best as possible the conditions of gel use in those studies.
In principle, gel-coated tissue surface area and gel flow rate along the vaginal canal are quantities that can be measured by imaging studies. When results of imaging studies and modeling are compared, it is important that all related experimental measurements (in vitro and in vivo) be performed on the same lots of gels and as close as possible in time. Rheological testing has shown that there can be lotto-lot variability in gel properties, enough to potentially alter the extent of gel spreading (unpublished data); and gel aging can also lead to a change in properties, typically a loss of viscosity and yield stress. There does exist a limited amount of data for gel distributions in the human vagina, primarily by MRI but also by optical imaging [27,28,58–61]. A small amount of data exists for imaging by gamma scintigraphy [28]. The MRI data are the most directly relevant to the gel flow modeling to date (because the optical method, while much higher in resolution, involves insertion of a penis-sized probe into the vaginal canal—this has not yet been modeled in the flow analyses). These studies have been conducted for multiple gels over a range of conditions of application. Those conditions include different gel volumes, different postures of a woman after application (including simulated coitus) and measurements at different times after gel insertion. In each study, logical contrasts were addressed, e.g.: effects of differences in applied volume (2.5 vs. 3.5 mL) and differences in posture (ambulation vs. no ambulation) for a single gel (cellulose sulfate) [60]; and differences in a woman's posture (no ambulation vs. ambulation) after application of a 3.5 mL volume for two gels (KY Jelly and Replens) [28]. Two principal measures of gel distribution reported in the MRI imaging to date are: (1) distance of migration of gel along the vaginal canal—termed “linear spread”; and (2) a “surface contact” variable which is an average, over five stations along the canal, of the lateral extent to which gel is seen to fill the lumen. The first measure has obvious geometric soundness, and corresponds to model predictions of gel distance spread. Interpretation of the second measure is more problematic. The intent is for it to relate to net vaginal surface area coated by a gel [58]. The lateral spreading of gel across the vaginal lumen, together with distance of gel migration along the canal, governs net surface area coated. However, lateral gel spreading across the lumen is not a random variable, and differences in it across different regions of the vaginal canal have been discussed in the MRI studies. Weighting all five measurements of lateral gel spreading equally may not capture any systematic changes in coating, e.g., between the proximal and distal regions of the vaginal canal. Multiplying a measure of lateral gel spreading by the longitudinal distance spread could provide an improved measure of net surface area with coating. In the absence of this, comparison of modeling results and the MRI results will focus here on the distance of gel spreading along the vaginal canal. The MRI results are generally presented as a percentage of coated distance along the entire length of the canal. The improved, channel flow modeling presented here (e.g., Fig 12) can easily be adapted to this. The model computes the net distance that the leading edge of coating has spread from the site of gel application towards the introitus. [Coated area is this distance of spreading multiplied by the width of the vaginal canal.] It follows that the MRI-derived percentage of linear spread is comparable to the percentage of total vaginal area coated as derived from the modeling (we take vaginal surface area as 100 cm2).
We now consider results presented in Table 1 of reference [60], for comparison of two volumes of a cellulose sulfate gel (n=6 women, each imaged four times). Coefficients of variation were high (48–60%), and there are no statistically significant differences in comparing the two volumes or the effects of ambulation. However, the trend is for greater spreading of 3.5 vs. 2.5 mL if the woman ambulated (85% vs. 69%; relative difference is 21%), and for ambulation to increase spreading for both volumes. No rheological data exist for the cellulose sulfate gel at the time of its application in the imaging study, and thus no direct comparisons of model predictions with the imaging results are possible. However, the measured contrast for 3.5 vs. 2.5 mL after 50 min of spreading with ambulation can be compared to model predictions for the set of test gels considered above (cf. Table 2; Fig. 12). Results are tabulated in Table 2. We see that percent linear spreading varies across the gels but that the results for imaging of the cellulose sulfate gel fall comfortably within the range of model results, being closest to those for the HEC placebo gel and the 1% tenofovir gel. Moreover, the relative difference in spreading between the two gel volumes is remarkably invariant across the gels modeled and virtually identical to the imaged value for the cellulose sulfate gel (21%). Thus, this comparison of MRI imaging and model predictions shows excellent agreement.
Table 1.
Summary of different classes of microbicide vehicles and APIs
| Vehicle | Semi-solid (e.g., gel) | Solid (e.g., IVR) |
|---|---|---|
| API site of action | Fluids | Tissue |
| Dosage regimen | Episodic (coitus) | Periodic |
Here, we have noted that the dosing schedule for the different vehicles may be different
Table 2.
Computed percent distance spread along the vaginal canal for a set of test gels
| Percent linear spreading |
% difference | ||
|---|---|---|---|
| 2.5 mL | 3.5 mL | ||
| Gel | |||
| KY Jelly | 72 | 88 | 20.99 |
| Replens | 80 | 99 | 21.41 |
| Gynol II | 53 | 66 | 21.09 |
| Carraguard | 77 | 95 | 21.09 |
| HEC placebo | 66 | 82 | 20.99 |
| 1% tenofovir gel | 72 | 88 | 20.98 |
| RepHresh | 62 | 77 | 22.34 |
Two volumes are compared (2.5 and 3.5 mL) and results are computed at 50 min after the onset of gel spreading
Two MRI papers are relevant for comparisons across different gels between modeling and measurement of vaginal distributions. In one study, KY Jelly and Replens were imaged in six women, at 1 and 4 h after insertion of a 3.5 mL bolus of gel [28]. In separate experiments the woman either ambulated or did not between gel application and imaging. Here, it was concluded that there were no statistically significant differences in coating between the two gels. Notably, in Fig. 1 of this paper, there appears to be a trend for coating to rank as:
[KY Jelly-ambulation]>[Replens-ambulation]~[Replensno ambulation]>[KY Jelly-no ambulation].
However, it is difficult to interpret this result biophysically.
A meta-analysis was performed for the MRI data from several studies, including gel-to-gel comparisons [58]. A range of volumes and conditions of gel use were included. Statistical modeling investigated the significance of factors such as gel type, volume, ambulation and time after gel insertion to gel spreading. It is stated that gel type, volume and time after insertion were independently and significantly associated with spreading. Ambulation was associated with spreading in some areas of the vagina (apparently with respect to the surface contact variable) but not all. This meta-analysis included three commercial gels: Gynol (a sodium carboxymethylcellose spermicidal gel); KY Jelly (a hydroxyethylcellulose lubricant), and Replens (a polycarbophil and Carbopol-based vaginal moisturizer). Table 3 of reference [58] provides a collective finding that linear spreading of these three gels ranked as: [Replens]>[KY Jelly]≫[Gynol] over all conditions. This is a frame of reference for comparing modeling outputs. However, because it encompasses a range of conditions of gel use, no single set of conditions in a model can be expected to correspond to the collective in vivo result.
Table 3.
Values of the predicted coated area and the scoring function (the “score” ) for the set of test gels: undiluted, after dilution by 20% with vaginal fluid simulant, and the average of those two values [10]
| Undiluted gel |
Diluted gel |
Average of undiluted and diluted scores |
|||||
|---|---|---|---|---|---|---|---|
| Gel | Area at 2 h (cm2) | Score | Gel | Area at 2 h (cm2) | Score | Gel | Score |
| KY Jelly | 98.43 | 0.9688 | Replens | 101.83 | 0.9756 | 1% TFV | 0.8971 |
| 1% TFV | 98.31 | 0.9664 | HEC placebo gel | 110.09 | 0.8655 | HEC placebo gel | 0.8467 |
| Carraguard | 105.03 | 0.9329 | 1% TFV | 112.92 | 0.8277 | Carraguard | 0.7535 |
| HEC placebo gel | 90.99 | 0.8279 | Gynol II | 83.36 | 0.6949 | Replens | 0.6895 |
| Gynol II | 72.71 | 0.5287 | Carraguard | 131.94 | 0.5741 | KY Jelly | 0.6418 |
| Replens | 63.51 | 0.4033 | RepHresh | 72.58 | 0.5268 | Gynol II | 0.6118 |
| UC781 clinical | 53.57 | 0.287 | KY Jelly | 151.39 | 0.3148 | RepHresh | 0.3281 |
| RepHresh | 35.98 | 0.1294 | UC781 clinical | 260.95 | 0 | UC781 clinical | 0.1435 |
The computations are based upon a 3.5-mL gel volume, and an upper bound on gel leakage VL =1.5 mL. Coated area is computed at 2 h after the onset of gel spreading
Model results indicate that if the gels are undiluted, the rank orders of coated area and distance spread are [KY]>[Gynol]>[Replens]. However, if the gels are diluted by as little as 10%, the rank order is [Replens]>[KY]≫[Gynol]. The latter result is the same rank order as that presented in the imaging study. This suggests that the gels are, indeed, being diluted during the time course of imaging in vivo. As noted above, the reason for the shift in computed spreading of Replens with dilution is that its yield stress (which acts to limit the onset of spreading; its value is about 20 Pa) drops to nearly zero with even this small dilution. In contrast, Gynol and KY Jelly are cellulose based gels that do not have yield stresses, and small degrees of dilution have relatively less impact on their properties and spreading. Overall, rank ordering of model results for 10% dilutions of the three gels is the same as the rank ordering given for the MRI results for percent linear spread [58].
As a practical consideration, the cost of imaging studies has substantially limited their sample sizes, so that they have been inherently underpowered. The largest sample size was n=6 for the two factor design (if we consider each time point as a separate experiment) that compared KY Jelly and Replens [28]. Many factors beyond gel type and volume, and a woman's activity after gel application, likely contribute to details of vaginal spreading. The imaging studies have considered effects of age, parity, body mass index, etc. However, we are limited in our ability to draw contrasts from any imaging studies with such small sample sizes, i.e. results are prone to type two statistical errors. That is, it can be surmised that if significant differences are found in imaging measures of in vivo gel distribution, they are likely to exist; but if differences are not found we should not rule them out altogether—this might be due to lack of statistical power. For example, the meta-analysis [58] did find the general result that gel was a significant factor in measures of vaginal spreading However, the comparison of KY Jelly and Replens [28] found no difference in spreading between those two specific gels. Clearly, there is much to be done to improve both the methodology and execution of vaginal imaging studies and the development of models that seek to predict their results.
Summary performance evaluation of a vaginal microbicide gel—practical application of modeling in microbicide development
The preceding models (excepting the infectivity analysis) are all deterministic, expressing the mechanisms of various transport processes involved in microbicide delivery system deployment and drug release. Model outputs are quantitative, and the fundamental understandings provided by them are useful in the practical process of product development. However, none of these models, unto themselves, are sufficient to summarize the performance of a test product. They do not translate directly into algorithms for gel design. There are multiple performance criteria for a microbicide gel, which are behavioral as well as biological. Behavioral criteria relate to user perceptions and preferences for products [62,63]. Recently, a modeling approach was introduced to summarize microbicide gel performance, for use in determination of an optimal composition for a new gel [10]. The algorithm employs a single function, termed the “scoring function,” which is computed. The value of the scoring function (the “score”) places merit on gel performance. That is, the higher the score the better the performance. Gel performance is summarized with respect to the amount of drug released to vaginal tissue and the extent/lack of gel leakage from the introitus after application. The mathematical expression for this scoring function (SF) is:
| (4) |
Here, A is the model-predicted vaginal surface area coated by gel, Amax is the total surface area of the vagina, V is gel volume and VL is a limit on the amount of gel that has leaked out from the introitus. Thus VL is a parameter which is set by the user. Figure 17 illustrates the shape of the scoring function.
Fig. 17.
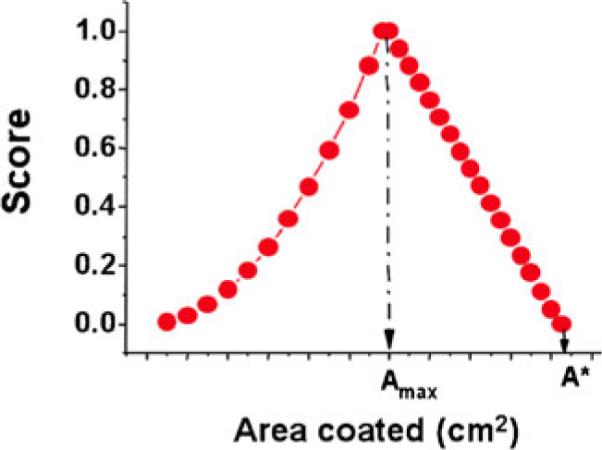
Shape of the scoring function, the value of which (the score) gives merit to gel spreading performance [10]. In this model, the score is a function of predicted coated area A. Amax is the target coated area, which is the surface area of the vagina. A* is a limiting predicted value of A, which is equal to Amax/[1−VL/V] where V is gel volume, and VL is an upper limit on leaked volume. That is, VL is a maximal value of V at which the value of the score drops to zero. This is set by the user of the model
Accurate fluid mechanical computation of the value of the Scoring Function requires that the effects of dilution be taken into account. As described above, our understanding of the dynamics of intravaginal gel dilution is a work in progress. Here we shall apply the algorithm used in the original development of the Scoring Function [10], including the manner in which dilution is taken into account. Table 3 gives values of the score for the gels depicted in Fig. 12. Results are presented for each gel undiluted and diluted 20% with vaginal fluid simulant. Then, the average value of the two scores is given; this is the summary result implemented in [10] for a different set of gels.
We see that the computed areas coated and values of the score depend upon gel properties which, in turn, depend upon the dilution status of the gels. The shifts in scores and in gel rank order after dilution reflect the fact that some gels, when diluted, overspread (and thus their scores decrease). In contrast, those diluted gels that have not overspread now have coated areas closer to the target area, so their scores increase. We emphasize that taking the average value of the two scores (undiluted and diluted) is an interim approach. The next step will be to incorporate the model of gel dilution (given above) into the computation of the score.
It is noteworthy, as well, that a second type of modeling was employed in the gel design work of Mahalingam et al. [10]. Mixture design of experiments theory was used to establish a semi-empirical relationship that linked gel composition-property and property-performance relationships, for varying concentrations of hydroxyethylcellulose and Carbopol 974P. These analyses lead to selection of a 3% HEC gel, when applied at a 3.5 mL volume.
API delivery by an intravaginal ring
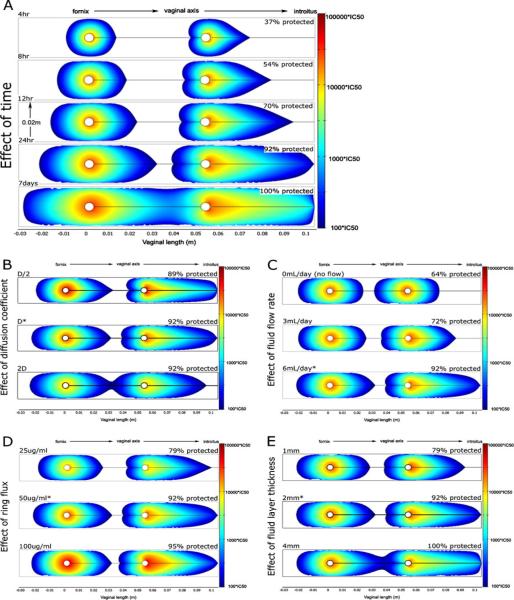
An initial compartmental model has been created of API delivery by an IVR [8]. This model includes both diffusion of drug out from the IVR surface and convection within vaginal fluid. Here, convection is taken into account directly, using a fluid mechanical model of the slow flow of vaginal fluid within the lumen of the canal. Output is the concentration distribution of API within the vaginal canal and tissue. The model was applied quantitatively to the microbicide API dapivirine, for which data on tissue permeability could be translated into an effective diffusion coefficient. Drug release flux was taken as following zero-order release kinetics, as demonstrated in microbicide IVRs currently in development. The prophylactic capability of this drug can also be estimated with respect to IC50 values obtained from in vitro experiments. These are referenced in Fig. 18 which gives results for a range of conditions, including time after IVR insertion, drug release flux, and vaginal fluid flow rate. Details of the results are summarized in the figure caption.
Fig. 18.
Computational model predictions of dapivirine concentrations in the human vagina delivered by an intravaginal ring (IVR) [8]. Each figure is a view in a sagittal plane through the IVR, in the centerline of the vaginal canal. The IVR body is seen as two white circles, and the direction of the axis of the vaginal canal is shown. Colored regions denote dapivirine levels >100×IC50 (IC50=0.33 ng/mL); actual concentrations are given by the scale bars on the right. As a quantitative measure, the percentage of vaginal epithelium with inhibitory concentrations of dapivirine is shown above each plot. Unless otherwise stated, all plots show dapivirine concentrations 24 h post-insertion using an IVR with release flux of 50 μg m/day, a fluid thickness of 2 mm, and vaginal fluid production rate of 6 mL/day. Effects of several factors are shown: a Time. Protection is not instantaneous. Approximately 24 h is needed for most of the vulnerable epithelium to be protected. At 4 h, only about 37% of tissue is protected; after 24 h almost all (92%) tissue is exposed to inhibitory concentrations. b Diffusion coefficient. The coefficient was increased and decreased by 2×. Changes had minimal effect on the range of inhibitory drug concentrations after 24 h. c Vaginal fluid production rate. Greater fluid flow rates allow the IVR to protect a greater amount of vaginal epithelium after 24 h. d API release flux. The fraction of vaginal tissue protected by inhibitory concentrations of drug is only slightly influenced by a twofold increase or decrease of dapivirine flux from the ring. All doses provided significant protection along the entire vaginal canal at 24 h. e Vaginal fluid layer thickness. Twofold differences in fluid layer thickness also had minor effects on overall protection
A key result of this analysis is the importance of the presence of vaginal fluid to drug delivery to the vaginal surfaces. The convection effects of vaginal fluid flow (resulting in increased Peclet number for the API transport process) cause relatively rapid distribution over the vaginal surfaces, as compared to diffusion within both fluids and tissue. The amount of vaginal fluid likely varies with the phase of the menstrual cycle, and with other factors such as age and hormonal irregularities. Results here suggest that the time interval following IVR insertion that leads to protective concentrations of delivered API will vary: it strongly depends upon the presence of vaginal fluid. This should be taken into account in defining dosage regimens for microbicide IVRs.
Future directions
Topical microbicides offer promise as an important component of the armamentarium of modalities to reduce the sexual transmission of HIV and other pathogens [7,62,64]. Mathematical modeling—deterministic, stochastic, and hybrids of the two—offers promise as an important component of the cohort of methods that can be applied in the research and development of successful microbicide products. This paper has illustrated several types of models that contribute to microbicide R&D. But we emphasize that the examples here are neither all-inclusive nor finalized in their scope, their biophysical details, and their accuracy. There is much to be done in the validation and diversification of the models. As the microbicides field progresses, it will benefit from modeling that addresses a number of phenomena, including those summarized in the following paragraphs.
From a basic science perspective, microbicide pharmacokinetics, and pharmacodynamics are key processes in product functionality, to which the modeling can be focused. These two processes are inextricably linked. PD model analysis can only be fully realized once the PK modeling has been created. Microbicide PK analyses should be expanded to multiple dosage forms. Results were presented here that relate to vaginal gels and rings. In addition, dissolving vaginal films and tablets are being developed as alternative dosage forms that might enjoy greater acceptability in at least some cohorts of users [23]. Recently, the first deterministic analysis of deployment and drug release by a vaginal microbicide film was created [51]. A closely related model describes drug release by a vaginal gel during the course of spreading [43]. Both these models embody coupled convection and diffusion processes that govern both dosage form deployment and transport of its API.
Clearly, more work is needed on the interactions of various dosage forms with fluids in the vagina (or rectum), especially vehicles that may imbibe fluid and undergo a mixing process (viz. gels, films, and dissolving tablets). In general, fluid contact reduces the mechanical integrity of these dosage forms. Depending upon the extent of this change, and the original volume of the dosage form, leakage out from the vagina may occur. This reduces the amount of API that remains available for delivery to the vagina. Gel leakage and its consequences for vaginal drug delivery are being taken into account in the next generation of models of vaginal spreading and API release [43].
Given the current emphasis on tissue-acting antiviral drugs as microbicide APIs, modeling should be expanded to greater characterization of drug distribution within target vaginal tissues. For example, several antiviral drugs currently in microbicide trials (viz. tenofovir, dapivirine, and MIV150) act within the stroma of the vagina and thus must be transported many millimeters “down” from the surface of the vaginal epithelium. Notably, drug diffusion within the vaginal epithelium (that overlies the stroma) may be anisotropic, due to the stratified squamous nature of its cellular structure. To date, only the model of dapivirine delivery by an IVR, mentioned above, has characterized drug transport into and distribution within the tissue compartment [8].
Future modeling should place increased emphasis upon microbicide pharmacodynamics. An initial example of this was the model, described above, of HIV neutralization by Cyanovirin-N delivered in a gel [6]. In the model, vaginal coating by the gel was complete and of uniform thickness. The logical extension of this model is to broaden it to APIs with different viral neutralization mechanisms, and to apply it to realistic incomplete vaginal coating by a gel, as analyzed in the model of HIV transport alone by Lai et al. [26]. A more advanced PD model of this kind is now under development [65]. Biological questions remain about the infectivity of cell-associated HIV. As our understanding of this improves, there will be a role for PD modeling in understanding the benefits of microbicide actions against cell-associated virus.
There is now increasing attention to microbicide products that deliver multiple APIs. In principle, co-delivery from a vehicle of APIs that act within luminal fluids and in tissue could have a synergistic effect. Entry inhibitors would reduce the infectious inoculums introduced by semen, and tissue active APIs (e.g., NNRTIs) would provide an enduring prophylactic reservoir against remaining infectious virions that reach the vaginal epithelium. Indeed, there are candidate microbicide APIs, e.g., pyrimidinediones that exhibit both these types of activities [66,67]. Models of infectivity, such as the Tuckwell et al. model, summarized above [11], can be adapted to take into account these types of mechanisms of anti-HIV action. Indeed, pharmacodynamic modeling should, in principle, be relatable to stochastic modeling of the probability of infection.
The microbicide-related models presented here have addressed API application to the vagina, as a site of potential HIV transmission. A growing amount of research is now being conducted on rectal microbicides [64,68,69]. Much of the modeling methodology summarized here can, in principle, be adapted to the context of rectal microbicides. Physiological, anatomical, biophysical, and other biological differences exist to varying degrees between the vaginal and rectal microbicide compartments. Nonetheless, the principles that underlie creation of models—both deterministic and stochastic—are equally applicable to the rectal context.
From a translational and product development perspective, modeling can help foster and improve the rational design and optimization of new microbicide products, and the evaluation and application of existing ones. For example, development of a microbicide gel would include specification of: (1) the API (s), (2) the gel composition (and, therefore, properties), (3) gel volume, (4) API concentration in the gel, and (5) the dosage regimen. Modeling can inform the understanding of the tradeoffs amongst (2)–(5) in achieving good performance—as embodied in the extent of vaginal coating and the delivery of API(s) to the vaginal environment. Oftentimes, API concentration in the gel is not a variable, but is the maximum that is deemed safe (from other studies) and that can be loaded into the gel. Even if API concentration is predetermined, there still remain tradeoffs amongst gel properties and volume that govern the optimal dosage regimen and the extent to which failure to adhere to this will compromise the maintenance of adequate API concentrations in vivo. These are precisely the tradeoffs that modeling can help explain, to complement and inform more costly in vivo studies.
Contributing to the rational design of new products is a nascent modeling focus, and has been initially applied in creation of an optimal microbicide gel [10]. The algorithm in that study focused upon optimizing gel composition to achieve property sets that maximized an objective function (the scoring function) that gave merit to gel spreading and drug delivery performance (as a single number ranging from 0 to 1). Here, the optimization of gel composition applied design of experiments methods to define the composition space that was evaluated. This approach offers great promise, and will benefit from recent improvements in the models of gel deployment and drug delivery, mentioned above [43]. Those improvements involve the biomechanics of gel spreading, the release mechanism of drug to epithelial surfaces, the dynamics of gel dilution, and the leakage of gel out from the introitus. In principle, it should be possible to create analogous optimization algorithms for multiple microbicide dosage forms and types of APIs.
As modeling in the microbicides field evolves, it will benefit from several types of data, from both in vitro and in vivo studies. In order to include the tissue compartment in modeling of API distribution, accurate data on transport properties of the APIs must be obtained, e.g., partition and diffusion coefficients. Currently, a number of in vitro systems are employed to measure tissue permeability to microbicide APIs [67]. Further elaboration of these techniques could help translate those measurements at a derived quantity–permeability (that is dependent upon the thickness of the tissue specimen utilized), to fundamental material transport properties—diffusion and partition coefficients. In the longer term, confocal in vivo imaging could also help generate needed data on concentration distributions of APIs in vaginal fluids and tissues in women and animal models [70]. More comprehensive data are also needed on the in vivo deployment of semi-solid dosage forms, e.g., gels and films. Such data should map the local luminal coating thickness and, ideally, the local dilution of these vehicles.
In summary, mathematical modeling, both deterministic and stochastic, can positively impact microbicide research and development. Application of models is inherently cheaper and generally more rapid than conducting experiments, in vivo and in vitro. Model outputs inform our understanding of the fundamental science of microbicide functionality, as influenced not just by the API, but also by details of its dosage form and application regimen. The challenge to the modeling and the modelers is: (1) to pay strict attention to the rapidly evolving biological understanding of HIV transmission and its inhibition, (2) to incorporate rigorous principles in defining the models, (3) to validate the models experimentally to the extent possible; and, consequently, (4) to create computational methods which are suitable for practical implementation in the microbicides pipeline.
Supplementary Material
Acknowledgments
We gratefully acknowledge the contributions of our co-workers Meredith Clark, David Friend, Anthony Geonnotti, Alex Gorham, Marcus Henderson, Sarah Kieweg, Patrick Kiser, Bonnie Lai, Alamelu Mahalingam, Derek Owen, Su Chan Park, Jennifer Peters, Audra Plenys, Andrew Szeri, Savas Tasoglu, and Stephane Verguet in the creation of the models described here. Support is gratefully acknowledged from the CONRAD Program MC-08-498, NIH U19 AI 077289, and NIH R21 AI 076019
Footnotes
Electronic supplementary material The online version of this article (doi:10.1007/s13346-011-0029-z) contains supplementary material, which is available to authorized users.
References
- 1.Karim QA, Karim SSA, Frohlich JA, Grobler AC, Baxter C, Mansoor LE, et al. Effectiveness and safety of tenofovir gel, an antiretroviral microbicide, for the prevention of HIV infection in women. Science. 2010;329(5996):1168–74. doi: 10.1126/science.1193748. [DOI] [PMC free article] [PubMed] [Google Scholar]
- 2.Nestorov I. Whole body pharmacokinetic models. Clin Pharmacokinet. 2003;42(10):883–908. doi: 10.2165/00003088-200342100-00002. [DOI] [PubMed] [Google Scholar]
- 3.Pang KS, Weiss M, Macheras P. Advanced pharmacokinetic models based on organ clearance, circulatory, and Fractal concepts. AAPS J. 2007;9(2):E268–83. doi: 10.1208/aapsj0902030. [DOI] [PMC free article] [PubMed] [Google Scholar]
- 4.Saltzman W. Drug delivery: Engineering principles for drug therapy. 1st ed Oxford University Press; New York: 2001. [Google Scholar]
- 5.Avrett S, Harrison P, McGrory E. Mapping the microbicide effort. Alliance for Microbicide Development; Silver Spring: 2007. [Google Scholar]
- 6.Geonnotti AR, Katz DF. Dynamics of HIV neutralization by a microbicide formulation layer: biophysical fundamentals and transport theory. Biophys J. 2006;91(6):2121–30. doi: 10.1529/biophysj.106.086322. [DOI] [PMC free article] [PubMed] [Google Scholar]
- 7.Stone A, Harrison PF. Microbicides—ways forward. Alliance for Microbicide Development; Silver Spring: 2010. [Google Scholar]
- 8.Geonnotti AR, Katz DF. Compartmental transport model of microbicide delivery by an intravaginal ring. J Pharm Sci. 2010;99(8):3514–21. doi: 10.1002/jps.22120. [DOI] [PMC free article] [PubMed] [Google Scholar]
- 9.Hendrix CW, Cao YJ, Fuchs EJ. Topical microbicides to prevent HIV: clinical drug development challenges. Annu Rev Pharmacol Toxicol. 2009;49:349–75. doi: 10.1146/annurev.pharmtox.48.113006.094906. [DOI] [PubMed] [Google Scholar]
- 10.Mahalingam A, Smith E, Fabian J, Damian FR, Peters JJ, Clark MR, et al. Design of a semisolid vaginal microbicide gel by relating composition to properties and performance. Pharm Res. 2010;27(11):2478–91. doi: 10.1007/s11095-010-0244-1. [DOI] [PubMed] [Google Scholar]
- 11.Tuckwell HC, Shipman PD, Perelson AS. The probability of HIV infection in a new host and its reduction with microbicides. Math Biosci. 2008;214(1–2):81–6. doi: 10.1016/j.mbs.2008.03.005. [DOI] [PubMed] [Google Scholar]
- 12.Essunger P, Perelson AS. Modeling HIV-infection of CD4(+) T-cell subpopulations. J Theor Biol. 1994;170(4):367–91. doi: 10.1006/jtbi.1994.1199. [DOI] [PubMed] [Google Scholar]
- 13.Kamina A, Makuch RW, Zhao HY. A stochastic modeling of early HIV-1 population dynamics. Math Biosci. 2001;170(2):187–98. doi: 10.1016/s0025-5564(00)00069-9. [DOI] [PubMed] [Google Scholar]
- 14.Merrill SJ. The stochastic dance of early HIV infection. J Comput Appl Math. 2005;184(1):242–57. [Google Scholar]
- 15.Perelson AS. Modelling viral and immune system dynamics. Nat Rev Immunol. 2002;2(1):28–36. doi: 10.1038/nri700. [DOI] [PubMed] [Google Scholar]
- 16.Perelson AS, Essunger P, Cao YZ, Vesanen M, Hurley A, Saksela K, et al. Decay characteristics of HIV-1-infected compartments during combination therapy. Nature. 1997;387(6629):188–91. doi: 10.1038/387188a0. [DOI] [PubMed] [Google Scholar]
- 17.Perelson AS, Neumann AU, Markowitz M, Leonard JM, Ho DD. HIV-1 dynamics in vivo: virion clearance rate, infected cell life-span, and viral generation time. Science. 1996;271(5255):1582–6. doi: 10.1126/science.271.5255.1582. [DOI] [PubMed] [Google Scholar]
- 18.Phillips AN. Reduction of HIV concentration during acute infection: independence from a specific immune response. Science. 1996;271(5248):497–9. doi: 10.1126/science.271.5248.497. [DOI] [PubMed] [Google Scholar]
- 19.Tan WY, Wu HL. Stochastic modeling of the dynamics of CD4(+) T-cell infection by HIV and some Monte Carlo studies. Math Biosci. 1998;147(2):173–205. doi: 10.1016/s0025-5564(97)00094-1. [DOI] [PubMed] [Google Scholar]
- 20.Tuckwell HC, Le Corfec E. A stochastic model for early HIV-1 population dynamics. J Theor Biol. 1998;195(4):451–63. doi: 10.1006/jtbi.1998.0806. [DOI] [PubMed] [Google Scholar]
- 21.Murray JD. Mathematical biology: I. An introduction. 3rd ed Springer; New York: 2002. [Google Scholar]
- 22.Perelson AS, Kirschner DE, Deboer R. Dynamics of HIV-infection of CD4+ T-cells. Math Biosci. 1993;114(1):81–125. doi: 10.1016/0025-5564(93)90043-a. [DOI] [PubMed] [Google Scholar]
- 23.Rohan LC, Sassi AB. Vaginal drug delivery systems for HIV prevention. AAPS J. 2009;11(1):78–87. doi: 10.1208/s12248-009-9082-7. [DOI] [PMC free article] [PubMed] [Google Scholar]
- 24.Lai BE, Geonnotti AR, Desoto MG, Montefiori DC, Katz DF. Semi-solid gels function as physical barriers to human immunodeficiency virus transport in vitro. Antiviral Res. 2010;88(2):143–51. doi: 10.1016/j.antiviral.2010.08.006. [DOI] [PMC free article] [PubMed] [Google Scholar]
- 25.Jay JI, Shukair S, Langheinrich K, Hanson MC, Cianci GC, Johnson TJ, et al. Modulation of viscoelasticity and HIV transport as a function of pH in a reversibly crosslinked hydrogel. Adv Funct Mater. 2009;19(18):2969–77. doi: 10.1002/adfm.200900757. [DOI] [PMC free article] [PubMed] [Google Scholar]
- 26.Lai BE, Henderson MH, Peters JJ, Walmer DK, Katz DF. Transport theory for HIV diffusion through in vivo distributions of topical microbicide gels. Biophys J. 2009;97(9):2379–87. doi: 10.1016/j.bpj.2009.08.010. [DOI] [PMC free article] [PubMed] [Google Scholar]
- 27.Henderson MH, Couchman GM, Walmer DK, Peters JJ, Owen DH, Brown MA, et al. Optical imaging and analysis of human vaginal coating by drug delivery gels. Contraception. 2007;75(2):142–51. doi: 10.1016/j.contraception.2006.08.014. [DOI] [PMC free article] [PubMed] [Google Scholar]
- 28.Mauck CK, Katz D, Sandefer EP, Nasution MD, Henderson M, Digenis GA, et al. Vaginal distribution of Replens and K-Y Jelly using three imaging techniques. Contraception. 2008;77(3):195–204. doi: 10.1016/j.contraception.2007.11.016. [DOI] [PubMed] [Google Scholar]
- 29.Lai BE. Reduction of HIV-virion transport for prevention of HIV transmission. Duke University; Durham: 2010. [Google Scholar]
- 30.Owen DH, Katz DF. A vaginal fluid simulant. Contraception. 1999;59(2):91–5. doi: 10.1016/s0010-7824(99)00010-4. [DOI] [PubMed] [Google Scholar]
- 31.Plenys AM. Mechanical analysis of topical drug delivery gels for women's reproductive health. Duke University; Durham: 2000. [Google Scholar]
- 32.Kieweg SL. Mechanical analysis of vaginal gels intended for microbicide application. Duke University; Durham: 2005. [Google Scholar]
- 33.Kieweg SL, Katz DF. Squeezing flows of vaginal gel formulations relevant to microbicide drug delivery. J Biomech Eng Trans ASME. 2006;128(4):540–53. doi: 10.1115/1.2206198. [DOI] [PubMed] [Google Scholar]
- 34.Kieweg SL, Katz DF. Interpreting properties of microbicide delivery gels: analyzing deployment due to squeezing. J Pharm Sci. 2007;96(4):835–50. doi: 10.1002/jps.20774. [DOI] [PubMed] [Google Scholar]
- 35.Lai BE, Xie YQ, Lavine ML, Szeri AJ, Owen DH, Katz DF. Dilution of microbicide gels with vaginal fluid and semen simulants: effect on rheological properties and coating flow. J Pharm Sci. 2008;97(2):1028–36. doi: 10.1002/jps.21132. [DOI] [PubMed] [Google Scholar]
- 36.Bird RB, Armstrong RC, Hassager O. fluid mechanics. 2nd ed Volume 1. Wiley; New York: 1987. Dynamics of poylmeric liquids. [Google Scholar]
- 37.Leider PJ, Bird RB. Squeezing flow between parallel disks. 1. Theoretical analysis. Ind Eng Chem Fund. 1974;13(4):336–41. [Google Scholar]
- 38.Sherwood JD, Durban D. Squeeze-flow of a Herschel–Bulkley fluid. J Non-Newtonian Fluid Mech. 1998;77(1–2):115–21. [Google Scholar]
- 39.Lighthill J. Regional Conference Series in Applied Mathematics. Society for Industrial Mathematics; Philadelphia: 1975. Mathematical biofluiddynamics; pp. 1–281. [Google Scholar]
- 40.Szeri AJ, Park SC, Verguet S, Weiss A, Katz DF. A model of transluminal flow of an anti-HIV microbicide vehicle: combined elastic squeezing and gravitational sliding. Phys Fluids. 1994;20(8):83101. doi: 10.1063/1.2973188. 2008 August. [DOI] [PMC free article] [PubMed] [Google Scholar]
- 41.Leal LG. Laminar flow and convective transport processes: scaling principles and asymptotic analysis. Butterworth-Heinemann; Boston: 1992. [Google Scholar]
- 42.Minoguchi R, Osborn TW, III, Hong H, Owens SJ, Haridas B. Reverse finite element analysis and modeling of biomechanical properties of internal tissues. US patent 2007/0016391. 2007 Jan 18; inventors.
- 43.Katz D, Peters J, Clark M, Friend D, Kiser P. Multivariate computational model to help rate microbicide gel performance: combining vaginal distribution, drug deliver and acceptability. Microbicides; Pittsburgh: 2010. [Google Scholar]
- 44.Masters WH, Johnson VE. Human sexual response. Little Brown; Boston: 1966. [Google Scholar]
- 45.Mitchell C, Paul K, Agnew K, Gaussman R, Coombs RW, Hitti J. Estimating volume of cervicovaginal secretions in cervicovaginal lavage fluid collected for measurement of genital HIV-1 RNA levels in women. J Clin Microbiol. 2011;49(2):735–6. doi: 10.1128/JCM.00991-10. [DOI] [PMC free article] [PubMed] [Google Scholar]
- 46.Owen DH, Peters JJ, Katz DF. Rheological properties of contraceptive gels. Contraception. 2000;62(6):321–6. doi: 10.1016/s0010-7824(00)00184-0. [DOI] [PubMed] [Google Scholar]
- 47.Crosby BJ, Mangnus M, de Groot W, Daniels R, McLeish TCB. Characterization of long chain branching: dilution rheology of industrial polyethylenes. J Rheol. 2002;46(2):401–26. [Google Scholar]
- 48.Peppas NA. Physiologically responsive hydrogels. Journal of Bioactive and Compatible Polymers. 1991;6(3):241–6. [Google Scholar]
- 49.Podual K, Doyle F, Peppas NA. Modeling of water transport in and release from glucose-sensitive swelling-controlled release systems based on poly(diethylaminoethyl methacrylate-gethylene glycol) Ind Eng Chem Res. 2004;43(23):7500–12. [Google Scholar]
- 50.Szeri A, Tasoglu S, Park S, Gao Y, Katz D. Biophysical computation of vaginal dilution and distribution of microbicide gels. Microbicides; Pittsburgh: 2010. [Google Scholar]
- 51.Szeri AJ, Tasoglu S, Katz DF. Transport processes in vaginal films that release anti-HIV microbicide molecules. Annual meeting of the Biophysical Society; Baltimore. 2011. [Google Scholar]
- 52.Katz DF, Henderson MH, Owen DH, Plenys AM, Walmer DK. What is Needed to Advance Vaginal Formulation Technology? In: Rencher WF, editor. Vaginal microbicide formulations workshop. Lippincott-Raven; Philadelphia: 1998. pp. 90–9. [Google Scholar]
- 53.Kheyfets VO, Kieweg SL. Free-surface coating flows of non-Newtonian gels: 3-D numerical simulation of gravity-induced flow. Proceeding of the Asme Summer Bioengineering Conference.2007. pp. 531–532. [Google Scholar]
- 54.Barnhart KT, Izquierdo A, Pretorius ES, Shera DM, Shabbout M, Shaunik A. Baseline dimensions of the human vagina. Hum Reprod. 2006;21(6):1618–22. doi: 10.1093/humrep/del022. [DOI] [PubMed] [Google Scholar]
- 55.Skalak R, Ozkaya N, Skalak TC. Biofluid mechanics. Annu Rev Fluid Mech. 1989;21:167–204. [Google Scholar]
- 56.Grotberg JB, Jensen OE. Biofluid mechanics in flexible tubes. Annu Rev Fluid Mech. 2004;36:121–47. [Google Scholar]
- 57.Pedley TJ. The fluid mechanics of large blood vessels. Cambridge University Press; New York: 1980. [Google Scholar]
- 58.Barnhart KT, Pretorius ES, Shera DM, Shabbout M, Shaunik A. The optimal analysis of MRI data to quantify the distribution of a microbicide. Contraception. 2006;73(1):82–7. doi: 10.1016/j.contraception.2005.07.005. [DOI] [PubMed] [Google Scholar]
- 59.Barnhart KT, Pretorius ES, Timbers K, Shera D, Shabbout M, Malamud D. In vivo distribution of a vaginal gel: MRI evaluation of the effects of gel volume, time and simulated intercourse. Contraception. 2004;70(6):498–505. doi: 10.1016/j.contraception.2004.06.013. [DOI] [PubMed] [Google Scholar]
- 60.Barnhart KT, Pretorius ES, Shaunik A, Timbers K, Nasution M, Mauck C. Vaginal distribution of two volumes of the novel microbicide gel cellulose sulfate (2.5 and 3.5 mL) Contraception. 2005;72(1):65–70. doi: 10.1016/j.contraception.2005.02.006. [DOI] [PubMed] [Google Scholar]
- 61.Barnhart KT, Pretorius ES, Timbers K, Shera D, Shabbout M, Malamud D. Distribution of a 3.5-mL (1.0%) C31G vaginal gel using magnetic resonance imaging. Contraception. 2005;71(5):357–61. doi: 10.1016/j.contraception.2004.11.005. [DOI] [PubMed] [Google Scholar]
- 62.Buckheit RW, Watson KM, Morrow KM, Ham AS. Development of topical microbicides to prevent the sexual transmission of HIV. Antivir Res. 2010;85(1):142–58. doi: 10.1016/j.antiviral.2009.10.013. [DOI] [PMC free article] [PubMed] [Google Scholar]
- 63.Tolley EE, Harrison PF, Goetghebeur E, Morrow K, Pool R, Taylor D, et al. Adherence and its measurement in phase 2/3 microbicide trials. AIDS Behav. 2010;14(5):1124–36. doi: 10.1007/s10461-009-9635-x. [DOI] [PMC free article] [PubMed] [Google Scholar]
- 64.McGowan I. Microbicides for HIV prevention: reality or hope? Curr Opin Infect Dis. 2010;23(1):26–31. doi: 10.1097/QCO.0b013e328334fe70. [DOI] [PubMed] [Google Scholar]
- 65.Chen J, Katz DF. Compartmental analysis of intravaginal HIV transport and neutralization by microbicides. Annual meeting of the Biophysical Society; Baltimore. 2011. [Google Scholar]
- 66.Buckheit RW, Watson K, Fliakas-Boltz V, Russell J, Loftus TL, Osterling MC, et al. SJ-3366, a unique and highly potent nonnucleoside reverse transcriptase inhibitor of human immunodeficiency virus type 1 (HIV-1) that also inhibits HIV-2. Antimicrob Agents Chemother. 2001;45(2):393–400. doi: 10.1128/AAC.45.2.393-400.2001. [DOI] [PMC free article] [PubMed] [Google Scholar]
- 67.Mahalingam A, Simmons AP, Ugaonkar SR, Watson KM, Dezzutti CS, Rohan LC, et al. Vaginal microbicide gel for the delivery of IQP-0528, a pyrimidinedione analog with a dual mechanism of action against HIV-1. Antimicrobial Agents and Chemotherapy. 2011 doi: 10.1128/AAC.01368-10. in press. [DOI] [PMC free article] [PubMed] [Google Scholar]
- 68.International Rectal Microbicide Advocates From promise to product: advancing rectal microbicide research and advocacy. The 2010 International Microbicides Conference.2010. [Google Scholar]
- 69.Minces LR, McGowan I. Advances in the development of microbicides for the prevention of HIV infection. Current Infectious Disease Reports. 2010;12(1):56–62. doi: 10.1007/s11908-009-0076-5. [DOI] [PMC free article] [PubMed] [Google Scholar]
- 70.Drake T, Rinehart M, Kim KH, LaCroix J, Henderson M, DeSoto M, et al. Simultaneous optical detection of intravaginal gel coating, dilution, drug distribution and tissue integrity in women. Microbicides; Pittsburgh: 2010. [Google Scholar]
- 71.Szeri A, Tasoglu S, Park S, Gao Y, Katz D, editors. Biophysical computation of vaginal dilution and distribution of microbicide gels. Microbicides; Pittsburgh: 2010. [Google Scholar]
- 72.Kieweg SL, Witelski TP, Katz DF, editors. Free-surface coating flows of non-Newtonian vaginal gels: numerical and experimental simulations of gravity-induced flow. American Society of Mechanical Engineering Summer Bioengineering Conference; Amelia Island. 2006. [Google Scholar]
Associated Data
This section collects any data citations, data availability statements, or supplementary materials included in this article.


