

Abstract
Altered branching and aberrant expression of N-linked glycans is known to be associated with disease states such as cancer. However, the complexity of determining such variations hinders the development of specific glycomic approaches for assessing disease states. Here, we examine a combination of ion mobility spectrometry (IMS) and mass spectrometry (MS) measurements, with principal component analysis (PCA) for characterizing serum N-linked glycans from 81 individuals: 28 with cirrhosis of the liver; 25 with liver cancer; and 28 apparently healthy. Supervised PCA of combined ion-mobility profiles for several, to as many as ten different mass-to-charge ratios for glycan ions, improves the delineation of diseased states. This extends an earlier study [J.Proteome Res. 2008, 7, 1109-1117] of isomers associated with a single glycan (S1H5N4) in which PCA analysis of the IMS profiles appeared to differentiate the liver cancer group from the other samples. Although performed on a limited number of test subjects, the combination of IMS-MS for different combinations of ions and multivariate PCA analysis shows promise for characterizing disease states.
Keywords: ion mobility, ESI mass spectrometry, glycans, cancer, principal component analysis
Introduction
A significant bottleneck associated with the development of biomarkers for the characterization of disease states involves the analysis of complex molecular mixtures.1,2 Even after the complexity of the mixture is minimized by purification and separation procedures, it is not uncommon to encounter samples that exceed the peak capacity and dynamic range of the analytical approach.3,4 Additionally, there is increased interest to speed up multidimensional analyses of biological samples and to develop new resources in order to analyze acquired data.5,6 High-throughput condensed-phase separations techniques such as reversed-phase liquid chromatography and capillary electrophoresis (CE) are often coupled into multidimensional platforms that are used in combination with mass spectrometry to analyze a wide range of protemic and glycomic samples.5-8 As analyses are extended to include multiple samples from many individuals (or transitioned into a clinical setting where sample turnaround may affect patient outcome) tremendous resources will be required. New methods that could increase the speed of analysis, or provide new information about complex molecular systems are likely to be widely adopted.
With this in mind, several laboratories have worked to combine gas-phase ion mobility spectrometry (IMS) with MS for the analysis of mixtures.9-15 In the nested IMS-MS approach10 a mixture of ions is produced by electrospray ionization (ESI)16 and is introduced into a drift tube containing an inert buffer gas. As ions drift through the instrument they separate according to differences in their mobilities through the gas.17,18 Because the number density of the gas is much less than that for condensed phases this separation can be carried out very rapidly (usually in only a few ms). Additionally, the mobility of an ion depends on its shape, such that it is sometimes possible to distinguish different isomers prior to MS analysis (an approach that involves comparisons of experiment with theoretical calculations). 19-26
This approach has now been used to investigate many types of biomolecular mixtures, including proteins, peptides, and small molecules.10,15,17,27-29 Especially topical for the development of biomarkers is the analysis of glycans.30-35,36 Unlike the linear chains of nucleic or amino acids found in oligonucleotides and peptides, glycans exist as a range of complex branched moieties.37 Thus, in addition to isomers that arise from differences in sequence, variations in branching may also exist. Glycosylation patterns for cancerous and healthy cells are known to exhibit significant differences, including: variability associated with the range of expression; the appearance of incomplete (i.e., truncated) structures; accumulation of precursors; and, albeit less frequently, the appearance of novel glycans.38 In the case of N-linked glycans, a number of studies have shown that glycopeptides are larger in tumor cells because of increased branching and fucosylation.39 In addition, N-linked glycans from cancer cells are also characterized by changes in the linkage, amount, and acetylation of sialic acid.39-45
Mass spectrometry is particularly useful to characterize truncated glycan structures appearing in glycosylation disorders.37,46,47 Alterations in the serum glycome associated with ovarian, prostate, pancreatic, breast, and liver cancer have been also analyzed by both ESI-MS and matrix assisted laser desorption ionization MS. 30,39,48-54 It is becoming clear that MS may play a powerful role in many types of glycomic studies that aim to find serological biomarkers for early diagnosis, prognosis, and treatment of a disease.55
Many experimental factors affect outcome. What would appear to be relatively obvious aspects of analyses become critical when biological (human) samples are involved.56 Glycomic studies require sample collection, processing, and handling, as well as glycome purification, MS and statistical analysis (important for interpretation). Hence, there are stringent constraints on protocols required to reach reliable outcomes.
Recently, we combined IMS with MS to analyze serum glycans associated with liver cancer and cirrhosis. In this previous study, we demonstrated that a PCA analysis of a single IMS profile for the [S1H5N4+3Na]3+ glycan ion was sufficient in some cases to distinguish among diseased states.30 Here, we extend these studies by combining and analyzing IMS distributions for numerous glycans with the goal to investigate if such approach could increase our capabilities of distinguishing samples related to different disease states. We find this improves resolution of diseased from healthy individuals. In addition to advantages in delineating physiological states, the use of multiple IMS profiles offers the chance to provide deeper insight into the biochemical origins associated with a disease.
Materials and methods
Materials
Red top vacutainer blood collection tubes (BD 366430) were obtained from Becton Dickinson (Franklin Lakes, NJ). The Peptide-N-Glycosidase F (PNGaseF; EC3.5.1.52), isolated from Escherichia coli, was purchased from Associates of Cape Cod Inc. (East Falmouth, MA). Trifluoroethanol (TFE), 2,5-dihydroxy-benzoic acid (DHB), and sodium hydroxide were received from Aldrich (Milwaukee, WI). Chloroform, iodomethane, and sodium chloride were from EM Science (Gibbstown, NJ). Dithiothreitol (DTT) and iodoacetamide (IAA) were the products of Bio-Rad Laboratories (Hercules, CA). Ammonium bicarbonate was from Mallinckrodt Chemical Company (Paris, KY), while acetonitrile (ACN) was from Fisher Scientific (Fair Lawn, NJ). All other common chemicals of analytical-grade quality were purchased from Sigma (St. Louis, MO).
Study population and sample collection
Hepatocellular carcinoma (HC) cases and controls were enrolled in collaboration with the National Cancer Institute of Cairo University, Egypt, from 2000 to 2002, as described previously.57 Briefly, adults with newly diagnosed HC, aged 17 and older, without a previous history of cancer, were eligible for the study. Diagnosis of HC was confirmed by pathology, cytology, imaging (CT, ultrasound), and serum alpha-fetoprotein (AFP) levels. Controls were recruited from the orthopedic department of Kasr El Aini Faculty of Medicine, Cairo University.30,58,59 The patients with chronic liver disease, fibrosis and cirrhosis, were recruited from Ain Shams University Specialized Hospital and Tropical Medicine Research Institute, Cairo, Egypt, during the same period. The diagnosis of liver disease in this group of controls was confirmed by ultrasound-guided liver biopsy. The patients negative for hepatitis B viral infection but positive for HCV RNA and with AFP less than 100 ng/ml were selected for the study. All participants signed informed consent, provided a blood sample, and answered a questionnaire with demographic information, personal habits, medical history, and occupational history. The study protocol was approved by the institutional review committee and conformed to the ethical guidelines of the 1975 Helsinki Declaration.
Blood samples were collected by a trained phlebotomist each day around 10 a.m. and processed within a few hours according to a standardized protocol. Aliquots of sera were frozen immediately after collection and kept at -80°C until analysis; all IMS measurements were performed on twice-thawed sera.
Experimental IMS-MS analysis of glycans
Release of N-glycans from glycoproteins
Ninety human serum samples [30 controls (NC), 30 from individuals with hepatocellular carcinoma (HC), and 30 from individuals with cirrhosis (QT)] were reduced and alkylated as described previously.39,53 Briefly, a 10-μl aliquot of serum was added to 150 μl of 25 mM ammonium bicarbonate and 2.5 μl of 200 mM DTT prior to incubation at 60 °C for 45 min. A 10-μl aliquot of 200 mM IAA was added and the reaction was allowed to proceed at room temperature in the dark for 1 h. Subsequently, a 2.5-μl aliquot of DTT was added to react with the excess IAA. The reaction mixture was diluted with 100 μl of ammonium bicarbonate to adjust the pH to 7.5 - 8.0 for the enzymatic release of N-glycans using PNGase F. Next, a 5 mU aliquot of PNGase F was added to the mixture prior to incubation overnight (18-22 h) at 37 °C.
Solid-phase extraction of N-glycans
The volume of enzymatically released glycans was adjusted to 1 ml with deionized water and applied to a C18 Sep-Pak® cartridge (Waters, Milford, MA), which was preconditioned with ethanol and deionized water as described previously.39,53 The reaction mixture was circulated through the cartridge 5-times to retain peptides and O-linked glycopeptides. Glycans were present in the pass-through and the 0.25 ml deionized water washes. The combined eluents were then passed over activated charcoal microcolumns (Harvard Apparatus, Holliston, MA) pre-conditioned with 1 ml of ACN and 1 ml aqueous solution of 0.1% trifluoroacetic acid (TFA). The microcolumn was washed with 1 ml of 0.1% TFA and samples were eluted with 1-ml of 50% aqueous ACN with 0.1% TFA. The purified N-glycans were evaporated to dryness using vacuum CentriVap Concentrator (Labconco Corporation, Kansas City, MO) prior to solid-phase permethylation.
Solid-phase permethylation
Permethylation of N-linked glycans stabilizes the structure of sialylated glycans and prevents loss of sialic acid during MS experiments. 60 It also enables simultaneous analysis of acidic (i.e., sialic acid-containing glycans) and non-acidic glycans in the positive ionization MS mode. Permethylation was performed according to our described procedure.60,61 Tubes, nuts and ferrules from Upchurch Scientific (Oak Harbor, WA) were used to assemble the sodium hydroxide capillary reactor. Sodium hydroxide powder was suspended in ACN and packed into Peek tubes (1 mm i.d.; Polymicro Technologies, Phoenix, AZ) using a 100-μl syringe from Hamilton (Reno, NV) and a syringe pump from KD Scientific, Inc. (Holliston, MA). The sodium hydroxide reactor was conditioned with 60 μl of dimethyl sulfoxide (DMSO) at a 5 μl/min flow rate. Purified N-glycans were resuspended in a 50-μl aliquot of DMSO with 0.3 μl of water and 22 μl methyl iodide. This permethylation procedure has been shown to minimize oxidative degradation and peeling reactions and to eliminate excessive clean-up. The sample was infused through the reactor at 2 μl/min and washed with 230 μl of ACN at 5 μl/min. All eluents were combined while permethylated N-glycans were extracted using 200 μl of chloroform and washed 3 times with 200 μl of water prior to drying.
IMS-MS analysis and data evaluation
Nested-IMS-MS datasets for 90 glycan samples were recorded using a home-built instrument that has been described in detail previously.18,62 The specific conditions used in these studies are similar to those reported in our recent study of glycans.30 General descriptions of theory and experiment that are valuable for understanding the concepts in this paper can be found elsewehere.9-15,19-22,63-69 Briefly, experiments are performed as follows. Glycan ions (usually the +2 and +3 sodiated charge states) are produced by electrospray ionization using a NanoMate (TriVersa, Advion, Ithaca, NY) auto injection system that has been modified to perform the present experiments. The beam of electrosprayed ions is accumulated in an hour glass ion funnel14,70 and periodically an electrostatic gate is lowered, releasing a packet of ions into the drift tube that is filled with ∼2.5 torr of 300 K He buffer gas. Under these conditions, the drift tube device affords a resolving power of ∼80 to 120. As ions travel through the drift tube they separate based on differences in their mobilities, which are largely defined by the shape and charge state of the ion.9,66 Thus, the IMS analysis is sensitive to the isomeric configuration (the covalently bonded configuration) as well as the conformation that the ion adopts upon entering the gas phase. Upon exiting the drift tube ions are focused into the source region of a time-of-flight mass analyzer and detected using microchannel plates. All of the components, electronics, and computer programs that are used in these experiments have been discussed previously.18,30
Principal component analysis (PCA) of IMS distributions was done by using MarkerView software (ABI/Sciex, Framingham, MA). Ion mobility profiles were combined by addition of ion mobility profiles to an extended drift time axis. This procedure was done in the same manner for all samples analyzed, i.e. ion mobility profiles of the same glycan structures fall across the same range of the drift time index scale. The PCA was done on a total of 81 samples, that is, 25 samples from serum of patients with liver cancer (HC), 28 samples from healthy patients (NC), and 28 samples from patients with the liver cirrhosis (QT). 9 samples were not included in the PCA analysis due to changes of the NanoMate chip nozzles during the analysis. Essentially, these 9 samples did not appear to electrospray correctly. Supervised PCA was employed. That is, by definition, we used prior knowledge about which sample groups were healthy or diseased. IMS data were weighted using either square root or the natural logarithm of ion intensities across the drift time distributions. Before PCA analysis, intensities were scaled using either autoscaling (each intensity value is subtracted by the average response from all samples and divided by the standard deviation) or the pareto option (each intensity value is subtracted by the average response from all samples and divided by the square root of the standard deviation).
Statistical analysis
The intensity values at 4927 time points were collected from the total sample populations consisting of three groups: liver cancer (HC), no cancer (NC) and liver cirrhosis (QT). Due to the large variations of the total intensities across individuals, relative intensity was calculated and utilized for the statistical analysis. We note that the variability must result from sample-to-sample differences as the reproducibility (≤4% variation) of IMS peak intensities for sample components in complex mixtures is quite good.71 Because neither the original data nor the logarithm transformed data satisfy the assumptions of normality and constant variance, we employed a non-parametric approach, Kruskal-Wallis test,72 to test the equality of population medians among the three groups. Statistical significance at each time point was determined by first comparing p values obtained from Kruskal-Wallis test with the threshold 1.005632e-05 given by Bonferroni method for multiple comparison adjustment. Then the false discovery rate (FDR)73 procedure was also used to correct for multiple comparisons and evaluate significance. All statistical analyses were carried out using R 2.5.0 software.
Results and discussion
IMS-MS distribution of glycans from serum
Figure 1 shows an example portion of a two-dimensional (2D) nested-IMS-MS dataset (referred to as a td(m/z) plot) for one of the samples. IMS separation reduces spectral congestion by separating components into mobility families. In the data shown in Figure 1, glycans are found in the families corresponding to doubly- and triply-charged ions. Glycan ions are clearly separated from background ions that are commonly observed at m/z values lower than 900. Therefore, integrating the data over narrow regions, where peaks appear, makes it possible to reduce contributions originating from background noise.
Figure 1.
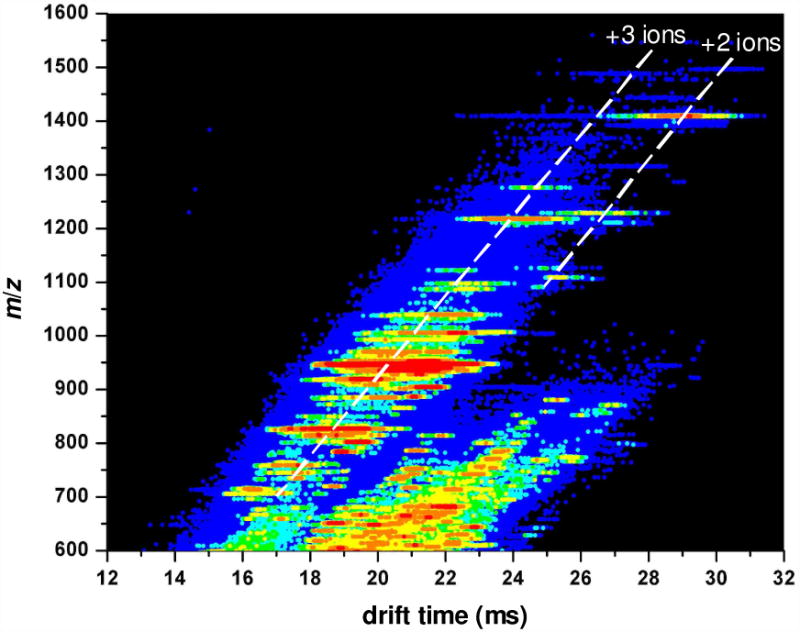
Two-dimensional tD(m/z) plot of mobility-dispersed glycan ions originating from human serum.
Peaks in the spectra are assigned to specific ions (or a range of possible glycan isomers) by comparing the experimental m/z values with theoretical values that are calculated for expected glycans. Over the m/z range between 700 and 1500, the primary peaks correspond to multiply-sodiated glycan ions. Many of the peaks are assigned to the known bi-, tri-, and tetra-antennary glycan structures, with varying degrees of sialylation and fucosylation.74 Table 1 provides a list of 22 ions (including charge states and assignments) that are observed in this sample as major peaks and correspond to 17 glycan structures. A greater number of glycan ions have been assigned in similar samples using a commercial MALDI-MS instrument.39 However, the present ESI-IMS-MS analysis has been conducted using an acquisition time of 2 min per sample in order to achieve the high throughput that is required to reproducibly analyze a large number of glycan samples. The trade-off in the high throughput analysis is the limited number of glycan ions that can be compared across all datasets. That said, the additional information on gas phase conformations of glycan ions obtained from the drift time distributions of these species is sufficient to distinguish the various phenotypes in the study (see discussion below).
Table 1.
Structures of glycans observed in all serum samples.
| glycan compositiona,b | m/z measured | charge | m/z calculated | Tentative structure |
|---|---|---|---|---|
| H5N4 | 705.3 | 3+ | 705.3 |  |
| H8N2 | 746.0 | 3+ | 746.0 |  |
| 1108.0 | 2+ | 1107.5 | ||
| F1H5N4 | 763.6 | 3+ | 763.4 |  |
| H5N2 | 801.6 | 2+ | 801.4 |  |
| H9N2 | 814.0 | 3+ | 814.1 |  |
| 1209.5 | 2+ | 1209.6 | ||
| S1H5N4 | 826.0 | 3+ | 825.7 |  |
| 1227.4 | 2+ | 1227.1 | ||
| S1F1H5N4 | 884.1 | 3+ | 883.8 |  |
| 1314.5 | 2+ | 1314.1 | ||
| H6N2 | 903.7 | 2+ | 903.4 |  |
| S1H5N5 | 907.8 | 3+ | 907.4 | 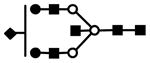 |
| S2H5N4 | 946.7 | 3+ | 946.1 | 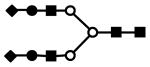 |
| 1407.9 | 2+ | 1407.7 | ||
| S2F1H5N4 | 1004.8 | 3+ | 1004.2 | 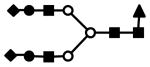 |
| H7N2 | 1005.8 | 2+ | 1005.5 | 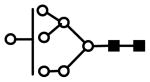 |
| S2F1H5N5 | 1086.5 | 3+ | 1085.9 |  |
| S2H6N5 | 1096.4 | 3+ | 1095.9 |  |
| S3H6N5 | 1216.9 | 3+ | 1216.3 |  |
| S3F1H6N5 | 1275.0 | 3+ | 1274.3 |  |
| S3H7N6 | 1366.3 | 3+ | 1366.0 |  |
S represents sialic acid (diamonds); F represents fucose (triangles); H represents hexose (mannose open circles, galactose solid circles); N represents N-acetyl glucosamine (solid squares).
N-linked glycans have been assigned by comparison of measured molecular weights of glycans to those of glycans found in the Consortium for Functional Glycomics database (Functional Glycomics Gateway, available at www.functionalglycomics.org)
Examples of glycan IMS profiles
Figure 2 shows average IMS profiles of glycan ions [S1H5N4+3Na]3+ (m/z = 825.9) and [S1F1H5N4+3Na]3+ (m/z = 884.9). The former ion, [S1H5N4+3Na]3+, is one of the glycans that is expected (based on our prior work)30 to be altered as consequence of disease progression, whereas the latter distribution, corresponding to [S1F1H5N4+3Na]3+, is a fucosylated glycan which has been implicated in cancer.38 Interestingly, the IMS distributions for both of these ions show four major features in IMS profiles, in addition to other minor features. The [S1H5N4+3Na]3+ distribution shows a main peak at 19.50 ms, and three other features at 17.42 ms, 18.32 ms and 19.17 ms; the [S1F1H5N4+3Na]3+ ion shows peaks at 18.66 ms, 19.20 ms, 19.99 ms, and 20.35 ms, respectively. As explained in our previous studies,30,75 the observation of multiple peaks in the IMS data could be due to the existence of multiple isomeric forms, and (or) the separation of different conformations (possibly arising from different charge site configurations) of the glycan ions that are stable in the gas phase during the ms timescale of the mobility separation.
Figure 2.
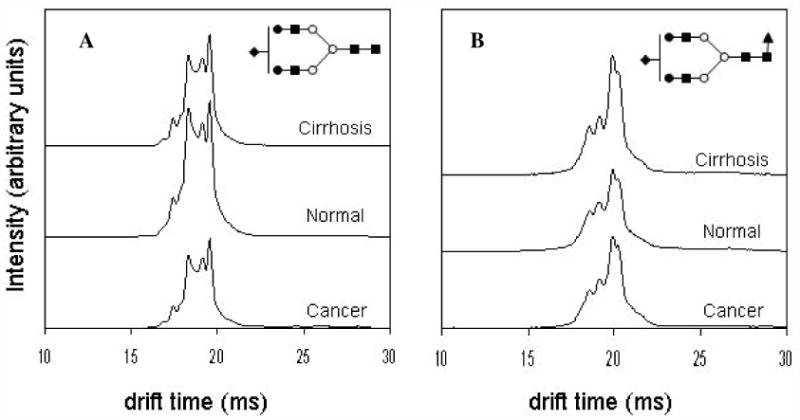
Average drift time profiles of [S1H5N4+3Na]3+ (A) and [S1F1H5N4+3Na]3+ (B) glycans showing both conformational and intensity differences with respect to disease state. Note that in the case of S1H5N4, the disease states exhibit lower overall intensities than the healthy state, while S1F1H5N4 shows higher overall drift time intensities in the case of diseased states than in the healthy state. This might be due to increased fucosylation of glycans with cancer and cirrhosis. Additionally, for both ions, careful inspection of drift time profiles show variances in intensities of finer features between the three groups.
It is interesting to plot the data such that it is possible to observe variations in intensities for distributions acquired for individuals. Figure 3 shows this type of representation as dot plots of the intensity observed in IMS for the same structures ([S1H5N4+3Na]3+ (m/z = 825.9) and [S1F1H5N4+3Na]3+ (m/z = 884.9)) for the three sample types across all individuals. Clearly there is substantial variability in peak intensity (a range of about a factor of 2 to 5 times) for different individuals within a group.
Figure 3.

Dot plots of the drift time intensities of [S1H5N4+3Na]3+ (top) and [S1F1H5N4+3Na]3+ (bottom) glycans for all samples analyzed in this study Glycans from serum of individuals with liver cancer (HC, 25 samples) and liver cirrhosis (QT, 28 samples), and glycans originating from serum of healthy individuals (NC, 28 samples) were analyzed. The spacing between the individual samples on the x-axis has been arbitrarily selected in order to display the range in integrated intensities (y-axis) for all samples within a phenotype group. The stars represent minimum and maximum values of drift time intensities and squares represent the average values of drift time intensities in particular sample groups.
Another important feature of the present data is that IMS distributions of these and other glycan ions from three groups of samples are highly reproducible. Thorough inspection of glycan IMS profiles shows that there are differences in the relative intensities of specific features. For example, relative intensities of peaks across the IMS profile of [S1H5N4+3Na]3+ are changing between the sample groups (Figure 2). Since this glycan might exist as a mixture of two positional structural isomers47,74 (linkage isomers are not considered) each having multiple conformations, changes in the drift time profiles might be attributed to the differences in isomeric composition of this glycan that are related to the disease state. Comparison of IMS profiles in Figure 2 shows that the amount of sialylated glycan ion [S1H5N4+3Na]3+ is the highest in the control samples while the amount of fucosylated glycan ion [S1F1H5N4+3Na]3+ is the highest in cirrhosis samples and appears to be slightly higher in the liver cancer sample compared to the control samples. Although MS can measure intensities of ions, IMS-MS provides another level of specificity which in particular cases supports the previous finding that fucosylation is increased in a disease. Because glycosylation is a complex biochemical process, the increase in the concentration of particular glycan structures can be accompanied with the decrease in the amount of other structures and vice versa.
PCA
We began by using PCA to examine the ion mobility profiles of the glycan [S3F1H6N5+3Na]3+ ion (m/z = 1275.0) from the serum. Figure 4A shows a plot of principal component scores for the different samples. Data are clustered according to sample groups, but some of the samples from the QT and NC groups are intermixed. Upon combining IMS profiles of multiple ions such as [S3F1H6N5+3Na]3+ and [S3H6N5+3Na]3+ (m/z = 1216.9) improves the separation of sample groups (Figure 4B). Group clustering is better when using two glycans rather than a single glycan because there are more differences in the variables of IMS profiles of both glycans. This in effect allows us to more easily distinguish patients having liver cancer from the healthy and liver cirrhosis groups (Figure 4B).
Figure 4.

A. Supervised PCA of drift time profiles of [S3F1H6N5+3Na]3+. B. Supervised PCA of combined drift time profiles of [S3F1H6N5+3Na]3+ and [S3H6N5+3Na]3+. 81 samples are shown in total (9 samples removed due to nozzle changes).
According to the previous analysis, we would expect that including other ions in the PCA would allow sample to fall into more distinct cluster regions. The mobility profiles for 9 glycans within the three sample groups are shown in Figure 5. For each of the 81 samples, ion mobility distributions of the 9 selected glycans are sequentially spliced on an arbitrary drift time index axis. The scheme requires that for all datasets, the extracted drift time distributions of a given glycan begin and end at the same drift time (from a total range of 31.5 ms). These times are assigned identical index numbers such that the same mobilities are compared for all datasets. The separation of different species for each of the 9 m/z values that are chosen is relatively small on this scale. However, as shown in Figure 6, PCA of combined IMS profiles of 10 glycan ions (some of which could exist as multiple isomers) shows distinct separation between sample groups. In contrast, supervised PCA analysis of raw mass spectra of analyzed glycans failed to show any clustering (data not shown). This implies that the ion mobility profiles of glycans can be used to distinguish patient groups in a way that may be more specific than analysis of mass spectra alone. This finding is interesting because it suggests additional evidence that altered expression of glycans is a global cellular process in which multiple glycan structures as well as their conformers and isomers change simultaneously.
Figure 5.
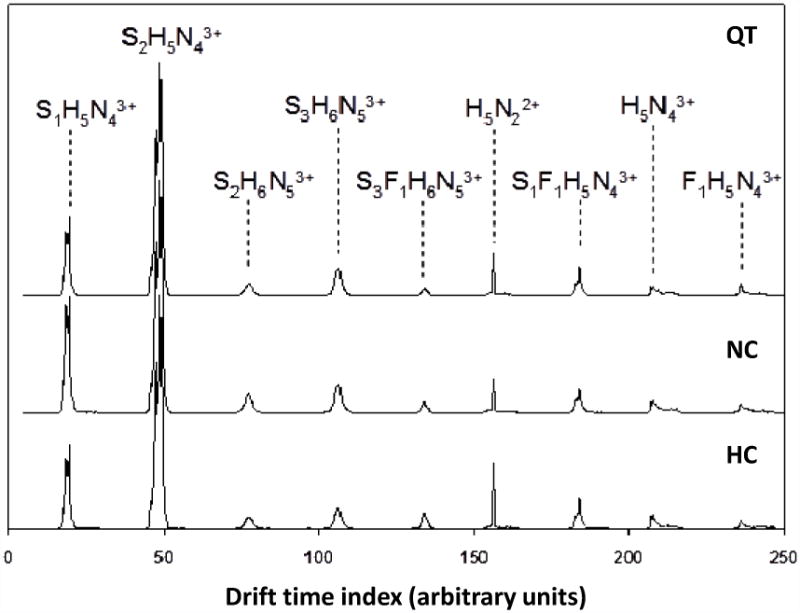
Combined drift time profiles of the 9 glycans that have demonstrated statistical significance between them (F1H5N4 3+; S1H5N43+; S1F1H5N43+; S2H5N43+; S2H6N53+;S3H6N53+; S3F1H6N53+, H5N22+, and H5N43+).
Figure 6.

Supervised PCA of drift time profiles of 10 glycans ions (F1H5N4 3+; S1H5N42+; S1H5N43+; S1F1H5N43+; S2H5N42+; S2H5N43+; S2H6N53+;S3H6N53+; S3F1H6N53+, and H5N22+).
To find glycans in which the IMS distributions are most responsible for the separation shown in Figure 6, we examined the corresponding loading plot (data not shown). Drift time points far from the plot origin of the loading plots are responsible for separation of disease groups. Ions having a drift time index near 135 ms or 156 ms (i.e., S3F1H6N5 or H5N2, respectively) are primarily responsible for clustering of the ion mobility data from different disease groups. Those two also have the smallest statistical Kruskal-Wallis p values among the 9 glycan structures used as shown in Table 2. All 9 glycan ions have Kruskal-Wallis p values less than 0.05; however, the p values of S3F1H6N5 and H5N2 are 7×10⁻⁷ and 1×10⁻⁹, respectively.
Table 2. Kruskal-Wallis p values of the 9 glycans included in PCA analysis.
| proposed glycana,b | m/zExp (z)c | tD index (ms)d | Kruskal-Wallis P value | Tentative structure |
|---|---|---|---|---|
| H5N4 | 705.3 (3) | 207.78 | 6.0E-03 | 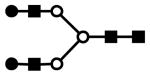 |
| F1H5N4 | 763.6 (3) | 236.03 | 7.0E-03 | 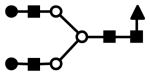 |
| H5N2 | 801.6 (2) | 156.29 | 1.0E-09 | 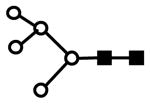 |
| S1H5N4 | 826.0 (3) | 19.56 | 2.0E-03 |  |
| S1F1H5N4 | 884.1 (3) | 184.12 | 5.0E-04 |  |
| S2H5N4 | 946.7 (3) | 48.85 | 3.0E-06 |  |
| S2H6N5 | 1096.4 (3) | 77.40 | 4.0E-06 |  |
| S3H6N5 | 1216.9 (3) | 106.26 | 4.0E-04 |  |
| S3F1H6N5 | 1275.0 (3) | 133.97 | 7.0E-07 |  |
S represents sialic acid (diamonds); F represents fucose (triangles); H represents hexose (mannose open circles, galactose solid circles); N-represents N-acetyl glycosamine (squares).
N-linked glycans have been assigned by comparison of measured molecular weights of glycans to those of glycans found in the Consortium for Functional Glycomics database (Functional Glycomics Gateway, available at www.functionalglycomics.org).
Charge states are listed in parenthesis.
Drift time index (ms) values corresponding to the maximum intensity in the tD profile with the associated p value
Evaluation of IMS-MS and PCA methodology
It is interesting to consider the idea that IMS profiles might be used as specific signatures for qualitative assignment of glycans, perhaps in a manner that is similar to the way that infrared or circular dichroism data are used as signatures for specific structures. In the present data we are interested in differences that are associated with combinations of glycans that may delineate disease state. This combination of approaches suggests that differences are accessible with this type of analysis. Because many variables are involved in these datasets we have used multivariate PCA for separation of sample groups, as has been done for other studies.30,53,54,76-78 It should be noted that although differences can be assessed, this approach should be used cautiously as differences may not be informative. It would be interesting to consider the use of these data in the characterization of samples in which the physiological state was unknown. Such experiments would provide a further test of the methodology described here that is under development.
Here we note that recent advances have been made in phenotype differentiation using serum glycan characterization with high-throughput LC-MS techniques.79,80 Compared to such techniques, the IMS-MS measurement presented here has advantages in throughput. For example a single sample analysis requires less time (five fold) and does not require additional time for column reconditioning and equilibration as well as sample injection and washing. We therefore present the approach as a very high-throughput means for analyzing large populations of samples. We also note that IMS-MS techniques can readily include nano-LC separations in order to more efficiently separate glycans prior to IMS analysis.81 Although nano-LC separation would decrease the throughput of the analysis, it could provide an additional degree of separation of glycans and their isomers obtained from human serum.82 Finally, Nano-LC/MS offers excellent sensitivity and selectivity for separation and analysis of glycans79,80, while IMS provides information on glycan structures that is not available by MS alone.28 Therefore, IMS is complementary to high-throughput solution-based separation techniques such as nano-LC and CE, and, in combination with mass spectrometry and statistical analyses, may provide improved delineation of disease states.
Conclusions
IMS-MS, combined with supervised PCA is used to analyze glycans isolated from serum of healthy patients, patients with liver cancer, and some with cirrhosis. The IMS data show evidence for multiple reproducible features. In favorable cases, IMS separation of a single m/z ion is sufficient to cluster individuals into cohorts with specific physiologies; however, when IMS profiles for multiple m/z ions are combined the ability to resolve different diseased states based on multivariate PCA of these data improves substantially. Supervised PCA using only the mass spectra generated for these samples from the 2D datasets produced no significant clustering. Thus the IMS-MS (PCA) technology appears to provide a more complete analysis of glycans and to offer significant predictive power with respect to physiological state, at no additional cost in time of analysis. We are presently working on determining a confidence level of the proposed method for the diagnostic analysis of unknown samples.
Acknowledgments
Primary support for this work comes from the National Center for Glycomics and Glycoproteomics (NCGG) under grant number RR018942 through the National Institute of Health (NIH) within the National Center for Research Resources (NCRR). Other partial support is from NCI grants R03 CA119288 and R01 CA115625-01A2 awarded to RG.
References
- 1.Anderson NL, Anderson NG. The Human Plasma Proteome History, Character, and Diagnostic Prospects. Mol Cell Proteomics. 2002;1:845–867. doi: 10.1074/mcp.r200007-mcp200. [DOI] [PubMed] [Google Scholar]
- 2.Aebersold R, Mann M. Mass spectrometry-based proteomics. Nature. 2003;422:198–207. doi: 10.1038/nature01511. [DOI] [PubMed] [Google Scholar]
- 3.Giddings C. Unified separation science. Wiley; New York: 1991. [Google Scholar]
- 4.Domon B, Aebersold R. Mass Spectrometry and Protein Analysis. Science. 2006;322:212–217. doi: 10.1126/science.1124619. [DOI] [PubMed] [Google Scholar]
- 5.Liu H, Lin D, Yates JR., III Multidimensional separations for protein/peptide analysis in the post-genomic era. Bio Techniques. 2002;32:898–911. doi: 10.2144/02324pt01. [DOI] [PubMed] [Google Scholar]
- 6.Jacobs JM, Adkins JN, Qian WJ, Liu T, Shen Y, Camp DG, II, Smith RD. Utilizing Human Blood Plasma for Proteomic Biomarker Discovery. J Proteome Res. 2005;4:1073–1085. doi: 10.1021/pr0500657. [DOI] [PubMed] [Google Scholar]
- 7.Novotny MV, Mechref Y. New hyphenated methodologies in high-sensitivity glycoprotein analysis. J Sep Science. 2005;28:1956–1968. doi: 10.1002/jssc.200500258. [DOI] [PMC free article] [PubMed] [Google Scholar]
- 8.Mechref Y, Novotny MV. Glycomic analysis by capillary electrophoresis-mass spectrometry. Mass Spectrom Rev. 2009;28:207–222. doi: 10.1002/mas.20196. [DOI] [PubMed] [Google Scholar]
- 9.Valentine SJ, Counterman AE, Hoaglund CS, Reilly JP, Clemmer DE. Gas-Phase Separations of Protease Digests. J Am Soc Mass Spectrom. 1998;9:1213–1216. doi: 10.1016/S1044-0305(98)00101-9. [DOI] [PubMed] [Google Scholar]
- 10.Hoaglund CS, Valentine SJ, Sporleder CR, Reilly JP, Clemmer DE. Three-Dimensional Ion Mobility/TOFMS Analysis of Electrosprayed Biomolecules. Anal Chem. 1998;70:2236–2242. doi: 10.1021/ac980059c. [DOI] [PubMed] [Google Scholar]
- 11.Gillig KJ, Ruotolo B, Stone EG, Russell DH, Fuhrer K, Gonin M, Schultz AJ. Coupling High-Pressure MALDI with Ion Mobility/Orthogonal Time-of-Flight Mass Spectrometry. Anal Chem. 2000;72:3965–3971. doi: 10.1021/ac0005619. [DOI] [PubMed] [Google Scholar]
- 12.Thalassinos K, Slade SE, Jennings KR, Scrivens JH, Giles K, Wildgoose J, Hoyes J, Bateman RH, Bowers MT. Ion Mobility Mass Spectrometry of Proteins in a Modified Commercial Mass Spectrometer. Int J Mass Spectrom. 2004;236:55–63. [Google Scholar]
- 13.Clowers BH, Dwivedi P, Steiner WE, Bendiak Hill B, Hill HH. Separation of Sodiated Isobaric Disaccharides and Trisaccharides Using Electrospray Ionization-Atmospheric Pressure Ion Mobility-Time of Flight Mass Spectrometry. J Am Soc Mass Spectrom. 2005;16:660–669. doi: 10.1016/j.jasms.2005.01.010. [DOI] [PubMed] [Google Scholar]
- 14.Tang K, Shvartsburg AA, Lee H, Prior DC, Buschbach MA, Li F, Tomachev A, Anderson GA, Smith RD. High-sensitivity ion mobility spectrometry/mass spectrometry using electrodynamic ion funnel interfaces. Anal Chem. 2005;77:3330–3339. doi: 10.1021/ac048315a. [DOI] [PMC free article] [PubMed] [Google Scholar]
- 15.Fenn LS, McLean JA. Biomolecular structural separations by ion mobility-mass spectrometry. Anal Bioanal Chem. 2008;391:905–909. doi: 10.1007/s00216-008-1951-x. [DOI] [PubMed] [Google Scholar]
- 16.Fenn JB, Mann M, Meng CK, Wong SF, Whitehouse CM. Electrospray ionization for mass spectrometry of large biomolecule. Science. 1989;246:64. doi: 10.1126/science.2675315. [DOI] [PubMed] [Google Scholar]
- 17.Liu Y, Clemmer DE. Characterizing Oligosaccharides Using Injected-ion Mobility/Mass Spectrometry. Anal Chem. 1997;69:2504–2509. doi: 10.1021/ac9701344. [DOI] [PubMed] [Google Scholar]
- 18.Koeniger SL, Merenbloom SI, Valentine SJ, Jarrold MF, Udseth HR, Smith RD, Clemmer DE. An IMS-MS Analogue of MS-MS. Anal Chem. 2006;78(12):4161–4174. doi: 10.1021/ac051060w. [DOI] [PubMed] [Google Scholar]
- 19.Revercomb HE, Mason EA. Theory of Plasma Chromatography / Gaseous Electrophoresis – A Review. Anal Chem. 1975;47:970–983. [Google Scholar]
- 20.Shvartsburg AA, Jarrold MF. An Exact Hard-Spheres Scattering Model for the Mobilities of Polyatomic Ions. Chem Phys Lett. 1996;261:86–91. [Google Scholar]
- 21.Mesleh MF, Hunter JM, Shvartsburg AA, Schatz GC, Jarrold MF. Structural Information from Ion Mobility Measurements: Effects of the Long-Range Potential. J Phys Chem. 1996;100:16082–16086. [Google Scholar]
- 22.Wyttenbach T, von Helden G, Batka JJ, Carlat D, Bowers MT. Effect of the Long-Range Potential on Ion Mobility Measurements. J Am Soc Mass Spectrom. 1997;8:275–282. [Google Scholar]
- 23.Bowers MT, Kemper PR, von Helden G, Koppen PAM. Gas-Phase Ion Chromatography: Transition Metal State Selection and Carbon Cluster Formation. Science. 1993;260:1446–1451. doi: 10.1126/science.260.5113.1446. [DOI] [PubMed] [Google Scholar]
- 24.Clemmer DE, Shelimov KB, Jarrold MF. Bonding of Metals to Carbon Rings: LaCn+ Isomers with La+ Inserted and Attached to the Ring. J Am Chem Soc. 1994;116:5971–5972. [Google Scholar]
- 25.Hunter J, Fye J, Jarrold MF. Annealing C60+: Synthesis of Fullerenes and Large Carbon Rings. Science. 1993;260:784–786. doi: 10.1126/science.260.5109.784. [DOI] [PubMed] [Google Scholar]
- 26.Bohrer BC, Merenbloom SI, Koeniger SL, Hilderbrand AE, Clemmer DE. Biomolecule Analysis by Ion Mobility Spectrometry. Annu Rev Anal Chem. 2008;1:10. 1–10. 35. doi: 10.1146/annurev.anchem.1.031207.113001. [DOI] [PMC free article] [PubMed] [Google Scholar]
- 27.Taraszka JA, Counterman AE, Clemmer DE. Gas-Phase separations of complex tryptic peptide mixtures. Fresenius J Anal Chem. 2001;369:234–245. doi: 10.1007/s002160000669. [DOI] [PubMed] [Google Scholar]
- 28.Valentine SJ, Plasencia MD, Liu X, Krishnan M, Naylor S, Udseth HR, Smith RD, Clemmer DE. Toward Plasma Proteome Profiling with Ion Mobility-Mass Spectrometry. J Proteome Research. 2006;5:2977–2984. doi: 10.1021/pr060232i. [DOI] [PubMed] [Google Scholar]
- 29.Dwivedi P, Wu P, Klopsch S, Puzon G, Xun L, Hill HH., Jr Metabolic profiling by ion mobility mass spectrometry (IMMS) Metabolomics. 2008;4:63–68. [Google Scholar]
- 30.Isailovic D, Kurulugama RT, Plasencia MD, Stokes ST, Kyselova Z, Goldman R, Mechref Y, Novotny MV, Clemmer DE. Profiling of human serum glycans associated with liver cancer and cirrhosis by IMS-MS. J Proteome Res. 2008;7:1109–1117. doi: 10.1021/pr700702r. [DOI] [PMC free article] [PubMed] [Google Scholar]
- 31.Harvey DJ, Sobott F, Crispin M, Wrobel A, Bonomelli C, Vasiljevic S, Scanlan CN, Scarff CA, Thalassinos K, Scrivens JH. Ion Mobility Mass Spectrometry for Extracting Spectra of N-Glycans Directly from Incubation Mixtures Following Glycan Release: Application to Glycans from Engineered Glycoforms of Intact, Folded HIV gp120. J Am Soc Mass Spectrom. 2011;22(3):568–81. doi: 10.1007/s13361-010-0053-0. [DOI] [PubMed] [Google Scholar]
- 32.Schenauer MR, Meissen JK, Seo Y, Ames JB, Leary JA. Heparan sulfate separation, sequencing, and isomeric differentiation: ion mobility spectrometry reveals specific iduronic and glucuronic acid-containing hexasaccharides. Anal Chem. 2009;81(24):10179–85. doi: 10.1021/ac902186h. [DOI] [PMC free article] [PubMed] [Google Scholar]
- 33.Yamagaki T, Sato A. Peak width-mass correlation in CID MS/MS of isomeric oligosaccharides using traveling-wave ion mobility mass spectrometry. J Mass Spectrom. 2009;44(10):1509–17. doi: 10.1002/jms.1641. [DOI] [PubMed] [Google Scholar]
- 34.Yamagaki T, Sato A. Isomeric oligosaccharides analyses using negative-ion electrospray ionization ion mobility spectrometry combined with collision-induced dissociation MS/MS. Anal Sci. 2009;25(8):985–8. doi: 10.2116/analsci.25.985. [DOI] [PubMed] [Google Scholar]
- 35.Zhu M, Bendiak B, Clowers B, Hill HH., Jr Ion mobility-mass spectrometry analysis of isomeric carbohydrate precursor ions. Anal Bioanal Chem. 2009;394(7):1853–67. doi: 10.1007/s00216-009-2865-y. [DOI] [PMC free article] [PubMed] [Google Scholar]
- 36.Kang P, Madera M, William R, Alley, Radoslav G, Mechref Y, Novotny MV. Glycomic alterations in the highly-abundant and lesser-abundant blood serum protein fractions for patients diagnosed with hepatocellular carcinoma. Int J Mass Spectrom. 2010 doi: 10.1016/j.ijms.2010.11.007. [DOI] [PMC free article] [PubMed] [Google Scholar]
- 37.Cummings RD, Pierce JM, editors. Handbook of Glycomics. Elsevier; Oxford, UK: 2009. [Google Scholar]
- 38.Varki A, Cummings R, Esko J, Freeze H, Hart G, Marth J, editors. Essentials of Glycobiology. CSHL Press; 1999. [PubMed] [Google Scholar]
- 39.Kyselova Z, Mechref Y, Al Bataineh MM, Dobrolecki LE, Hickey RJ, Vinson J, Sweeney CJ, Novotny MV. Alterations in the serum glycome due to metastatic prostate cancer. J Proteome Res. 2007;6:1822–1832. doi: 10.1021/pr060664t. [DOI] [PMC free article] [PubMed] [Google Scholar]
- 40.Saldova R, Royle L, Radcliffe CM, Abd Hamid UM, Evans R, Arnold JN, Banks RE, Hutson R, Harvey D, Antrobus R, Petrescu SM, Dwek RA, Rudd PM. Ovarian Cancer is Associated with Changes in Glycosylation in Both Acute Phase Proteins and IgG. Glycobiology. 2007;17(12):1344–56. doi: 10.1093/glycob/cwm100. [DOI] [PubMed] [Google Scholar]
- 41.Goldman R, Ressom HW, Varghese RS, Goldman L, Bascug G, Loffredo CA, Abdel-Hamid M, Gouda I, Ezzat S, Kyselova Z, Mechref Y, Novotny MV. Detection of Hepatocellular Carcinoma using Glycomic Analysis. Clin Cancer Res. 2009;15:1808–1813. doi: 10.1158/1078-0432.CCR-07-5261. [DOI] [PMC free article] [PubMed] [Google Scholar]
- 42.Mechref Y, Hussein A, Bekesova S, Pungpapong V, Zhang M, Dobrolecki LE, Hickey RJ, Hammond ZT, Novotny MV. Quantitative Serum Glycomics of Esophageal Adenocarcinoma, and Other Esophageal Disease Onsets. J Protoeme Res. 2009;8:2656–2666. doi: 10.1021/pr8008385. [DOI] [PMC free article] [PubMed] [Google Scholar]
- 43.Arnold JN, Saldova R, Hamid UMA, Rudd PM. Evaluation of the serum N-linked glycome for the diagnosis of cancer and chronic inflammation. Proteomics. 2008;8:3284–3293. doi: 10.1002/pmic.200800163. [DOI] [PubMed] [Google Scholar]
- 44.Arnold JN, Saldova R, Galligan MC, Murphy TB, Mimura-Kimura Y, Telford JE, Godwin AK, Rudd PM. Novel Glycan Biomarkers for the Detection of Lung Cancer. J Proteome Res. 2011;10(4):1755–1764. doi: 10.1021/pr101034t. [DOI] [PubMed] [Google Scholar]
- 45.Robbe-Masselot C, Herrmann A, Maes E, Carlstedt I, Michalski JC, Capon C. Expression of a Core 3 Disialyl-Lex Hexasaccharide in Human Colorectal Cancers: A Potential Marker of Malignant Transformation in Colon. J Proteome Res. 2009;8:702–711. doi: 10.1021/pr800740j. [DOI] [PubMed] [Google Scholar]
- 46.Kornak U, Reynders E, Dimopoulou A, van Reeuwijk J, Fischer B, Rajab A, Budde B, Nürnberg P, Foulquier F, ARCL Debré-type Study Group. Lefeber D, Urban Z, Gruenewald S, Annaert W, Brunner HG, van Bokhoven H, Wevers R, Morava E, Matthijs G, Van Maldergem L, Mundlos S. Impaired glycosylation and cutis laxa caused by mutations in the vesicular H+-ATPase subunit ATP6V0A2. Nat Genet. 2008;40:32–34. doi: 10.1038/ng.2007.45. [DOI] [PubMed] [Google Scholar]
- 47.Kranz C, Ng BG, Sun LW, Sharma V, Eklund EA, Miura Y, Ungar D, Lupashin V, Winkel RD, Cipollo JF, Costello CE, Loh E, Hong W, Freeze HH. COG8 deficiency causes new congenital disorder of glycosylation type IIh. Hum Mol Genet. 2007;16:731–741. doi: 10.1093/hmg/ddm028. [DOI] [PubMed] [Google Scholar]
- 48.An HJ, Miyamoto S, Lancaster KS, Kirmiz C, Li BS, Lam KS, Leiserowitz GS, Lebrilla CB. Profiling of glycans in serum for the discovery of potential biomarkers for ovarian cancer. J Proteome Res. 2006;5:1626–1635. doi: 10.1021/pr060010k. [DOI] [PubMed] [Google Scholar]
- 49.Zhao J, Simeone DM, Heidt D, Anderson MA, Lubman DM. Comparative serum glycoproteomics using lectin selected sialic acid glycoproteins with mass spectrometric analysis: Application to pancreatic cancer serum. J Proteome Res. 2006;5:1792–1802. doi: 10.1021/pr060034r. [DOI] [PubMed] [Google Scholar]
- 50.Comunale MA, Lowman M, Long RE, Krakover J, Philip R, Seeholzer S, Evans AA, Hann HWL, Block TM, Mehta AS. Proteomic analysis of serum associated fucosylated glycoproteins in the development of primary hepatocellular carcinoma. J Proteome Res. 2006;5:308–315. doi: 10.1021/pr050328x. [DOI] [PubMed] [Google Scholar]
- 51.Steel LF, Mattu TS, Mehta A, Hebestreit H, Dwek R, Evans AA, London WT, Block T. A proteomic approach for the discovery of early detection markers of hepatocellular carcinoma. Disease Markers. 2001;17(3):179–189. doi: 10.1155/2001/963023. [DOI] [PMC free article] [PubMed] [Google Scholar]
- 52.Dai Z, Liu YK, Cui JF, Shen HL, Chen J, Sun RX, Zhang Y, Zhou XW, Yang PY, Tang ZY. Identification and analysis of altered alpha 1,6-fucosylated glycoproteins associated with hepatocellular carcinoma metastasis. Proteomics. 2006;6:5857–5867. doi: 10.1002/pmic.200500707. [DOI] [PubMed] [Google Scholar]
- 53.Kyselova Z, Mechref Y, Kang P, Goetz JA, Dobrolecki LE, Hickey RJ, Malkas LH, Novotny MV. Breast cancer diagnosis and prognosis through quantitative measurements of serum glycan profiles. Clin Chem. 2008;54:1166–1175. doi: 10.1373/clinchem.2007.087148. [DOI] [PubMed] [Google Scholar]
- 54.Ressom HW, Varghese RS, Goldman L, An Y, Loffredo CA, Abdel-Hamid M, Kyselova Z, Mechref Y, Novotny MV, Drake SK, Goldman RJ. Analysis of MALDI-TOF mass spectrometry data for discovery of peptide and glycan biomarkers of hepatocellular carcinoma. Proteome Res. 2008;7:603–610. doi: 10.1021/pr0705237. [DOI] [PMC free article] [PubMed] [Google Scholar]
- 55.Tousi F, Hancock WS, Hincapie MS. Technologies and strategies for glycoproteomics and glycomics and their application to clinical biomarker research. Anal Methods. 2011;3(1):20–32. doi: 10.1039/c0ay00413h. [DOI] [PubMed] [Google Scholar]
- 56.Beretta L. Proteomics from the clinical perspective: many hopes and much debate. Nat Methods. 2007;4:785–786. doi: 10.1038/nmeth1007-785. [DOI] [PubMed] [Google Scholar]
- 57.Ezzat S, Abdel-Hamid M, Eissa SA, Mokhtar N, Labib NA, El Ghorory L, Mikhail NN, Abdel-Hamid A, Hifnawy T, Strickland GT, Loffredo CA. Associations of Pesticides, HCV, HBV, and Hepatocellular Carcinoma in Egypt. Int J Hyg Environ Health. 2005;208(5):329–39. doi: 10.1016/j.ijheh.2005.04.003. [DOI] [PubMed] [Google Scholar]
- 58.Goldman R, Ressom HW, Abdel-Hamid M, Goldman L, Wang A, Varghese RS, An Y, Loffredo CA, Drake SK, Eissa SA, Gouda I, Ezzat S, Moiseiwitchs FS. Candidate markers for the detection of hepatocellular carcinoma in low-molecular weight fraction of serum. Carcinogenesis. 2007;28:2149–2153. doi: 10.1093/carcin/bgm177. [DOI] [PMC free article] [PubMed] [Google Scholar]
- 59.Ezzat S, Abdel-Hamid M, Eissa SA, Mokhtar N, Labib NA, El-Ghory R, Mikhaill NN, Abdel-Hamid A, Hifnay T, Strickland GT, Loffredo CA. Associations of pesticides, HCV, HBV, and hepatocellular carcinoma in Egypt. Int J Hyg Environ Health. 2005;208:329–339. doi: 10.1016/j.ijheh.2005.04.003. [DOI] [PubMed] [Google Scholar]
- 60.Kang P, Mechref Y, Klouckova I, Novotny MV. Solid-phase permethylation of glycans for mass spectrometric analysis. Rapid Commun Mass Spectrom. 2005;19:3421–3428. doi: 10.1002/rcm.2210. [DOI] [PMC free article] [PubMed] [Google Scholar]
- 61.Kang P, Mechref Y, Novotny MV. High-throughput Solid-phase Spin-column Permethylation for MALDI-TOF-MS Analysis. Rapid Commun Mass Spectrom. 2008;22(5):721–734. doi: 10.1002/rcm.3395. [DOI] [PubMed] [Google Scholar]
- 62.Kurulugama RT, Valentine SJ, Sowell RA, Clemmer DE. Development of a high-throughput IMS-IMS-MS approach for analyzing mixtures of biomolecules. J Proteomics. 2008;71(3):318–331. doi: 10.1016/j.jprot.2008.06.010. [DOI] [PMC free article] [PubMed] [Google Scholar]
- 63.Mason EA, McDaniel EW. Transport Properties of Ions in Gases. Wiley; New York: 1988. [Google Scholar]
- 64.Clemmer DE, Jarrold MF. Ion Mobility Measurements and their Applications to Clusters and Biomolecules. J Mass Spectrom. 1997;32:577–592. [Google Scholar]
- 65.St. Louis RH, Hill HH. Ion Mobility Spectrometry in Analytical Chemistry. Crit Rev Anal Chem. 1990;21:321–355. doi: 10.1021/ac00222a001. [DOI] [PubMed] [Google Scholar]
- 66.Hoaglund-Hyzer CS, Counterman AE, Clemmer DE. Anhydrous Protein Ions. Chem Rev. 1999;99:3037–3079. doi: 10.1021/cr980139g. [DOI] [PubMed] [Google Scholar]
- 67.Myung S, Badman ER, Lee YJ, Clemmer DE. Structural Transitions of Electrosprayed Ubiquitin Ions Stored in an Ion Trap over ∼ 10 ms to 30 s. J Phys Chem A. 2002;106:9976–9982. [Google Scholar]
- 68.Chen YH, Siems WF, Hill HH., Jr Fourier Transform Electrospray Ion Mobility Spectrometry. Anal Chim Acta. 1996;334:75–84. [Google Scholar]
- 69.Hoaglund-Hyzer CS, Clemmer DE. Ion Trap/Ion Mobility/Quadrupole/Time-of-Flight Mass Spectrometry for Peptide Mixture Analysis. Anal Chem. 2001;73:177–184. doi: 10.1021/ac0007783. [DOI] [PubMed] [Google Scholar]
- 70.Shaffer SA, Prior DC, Anderson GA, Udseth HR, Smith RD. An Ion Funnel Interface for Improved Ion Focusing and Sensitivity Using Electrospray Ionization Mass Spectrometry. Anal Chem. 1998;70:4111–4119. doi: 10.1021/ac9802170. [DOI] [PubMed] [Google Scholar]
- 71.Valentine SJ, Kurulugama RT, Bohrer BC, Merenbloom SI, Sowell RA, Mechref Y, Clemmer DE. Developing IMS–IMS–MS for rapid characterization of abundant proteins in human plasma. Int J Mass Spectrom. 2009;283:149–160. [Google Scholar]
- 72.Kruskal WH, Wallis WA. Use of ranks in one-criterion variance analysis. J Amer Statist Assoc. 1952;47:583–621. [Google Scholar]
- 73.Benjamini Y, Hochberg Y. Controlling the false discovery rate: a practical and powerful approach to multiple testing. J R Stat Soc Ser B. 1995;57:289–300. [Google Scholar]
- 74.Consortium for functional glycomics and Nature publishing group. Functional Glycomics Gateway. 2006 available at www.functionalglycomics.org.
- 75.Plasencia MD, Isailovic D, Merenbloom SI, Mechref Y, Clemmer DE. Resolving and Assigning N-linked Glycan Structural Isomers from Ovalbumin by IMS-MS. J Am Soc Mass Spectrom. 2008;19(11):1706–1715. doi: 10.1016/j.jasms.2008.07.020. [DOI] [PMC free article] [PubMed] [Google Scholar]
- 76.Miller JN, Miller JC. Statistics and Chemometrics for Analytical Chemistry. Pearson Education Limited; Harlow, England: 2000. [Google Scholar]
- 77.Prasad S, Pierce KM, Schmidt H, Rao JV, Guth R, Bader S, Synovec RE, Smith GB, Eiceman GA. Analysis of bacteria by pyrolysis gas chromatography-differential mobility spectrometry and isolation of chemical components with a dependence on growth temperature. Analyst. 2007;132:1031–1039. doi: 10.1039/b705929a. [DOI] [PubMed] [Google Scholar]
- 78.Ivosev G, Burton L, Bonner R. Dimensionality reduction and visualization in principal component analysis. Anal Chem. 2008;80:4933–494. doi: 10.1021/ac800110w. [DOI] [PubMed] [Google Scholar]
- 79.Bereman MS, Young DD, Deiters A, Muddiman DC. Development of a robust and high throughput method for profiling N-linked glycans derived from plasma glycoproteins by nano LC FT-ICR mass spectrometry. J Proteome Res. 2009;8:3764–3770. doi: 10.1021/pr9002323. [DOI] [PMC free article] [PubMed] [Google Scholar]
- 80.Bereman MS, Williams TI, Muddiman DC. Development of a nanoLC LTQ orbitrap mass spectrometric method for profiling glycans derived from plasma from healthy, benign tumor control, and epithelial ovarian cancer patients. Anal Chem. 2009;81(3):1130–1136. doi: 10.1021/ac802262w. [DOI] [PMC free article] [PubMed] [Google Scholar]
- 81.Sowell RA, Koeniger SL, Valentine SJ, Moon MH, Clemmer DE. Nanoflow LC/IMS-MS (and -CID/MS) of Protein Mixtures. J Am Soc Mass Spectrom. 2004;15:1341–1353. doi: 10.1016/j.jasms.2004.06.014. [DOI] [PubMed] [Google Scholar]
- 82.Hua S, An HJ, Ozcan S, Ro GS, Soares S, DeVere-White R, Lebrilla CB. Comprehensive native glycan profiling with isomer separation and quantitation for the discovery of cancer biomarkers. Analyst. 2011;136:3663–3671. doi: 10.1039/c1an15093f. [DOI] [PMC free article] [PubMed] [Google Scholar]