Abstract
Ectocarpus siliculosus is being developed as a model organism for brown algal genetics and genomics.1,2 Brown algae are phylogenetically distant from the other multicellular phyla (green lineage, red algae, fungi and metazoan)3 and therefore might offer the opportunity to study novel and alternative developmental processes that lead to the establishment of multicellularity. E. siliculosus develops as uniseriate filaments, thereby displaying one of the simplest architectures among multicellular organisms.4 The young sporophyte grows as a primary filament and then branching occurs, preferentially at the center of the filament. We recently described the first morphogenetic mutant étoile (etl) in a brown alga, produced by UVB mutagenesis in E. siliculosus.5 We showed that a single recessive mutation was responsible for a defect in both cell differentiation and the very early branching pattern (first and second branch emergences). Here, we supplement this study by reporting the branching defects observed subsequently, i.e. for the later stages corresponding to the emergence of up to the first six secondary filaments, and we show that the branching process is composed of at least two distinct components: time and position.
The developmental pattern of E. siliculosus is characterized by a very high level of morphological plasticity.6 Observations followed by statistical analyses allowed analyzing the morphometric features accompanying the establishment of the branching pattern in the mutant étoile, compared with the wild type (WT) organism (strain Ec32). The branching pattern can be deciphered in two main components: (1) the timing of branching and (2) the position of branching.
Keywords: branching, brown alga, development, filament, modeling, morphogenesis, morphometry
Branching dynamics
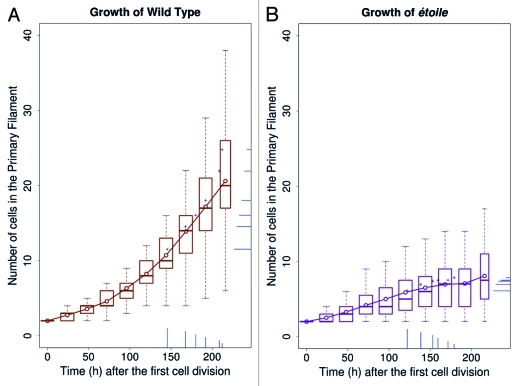
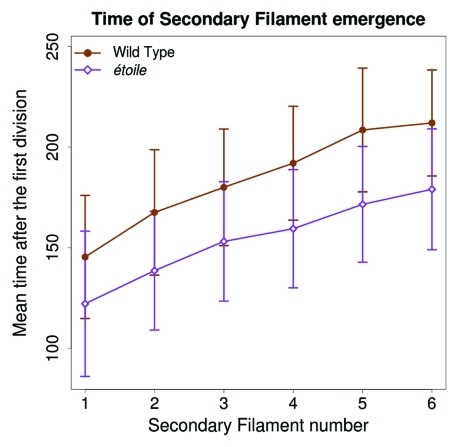
We previously showed that in the WT organism, branching (secondary filaments, SF) initiates when the primary filament (PF) reached the 10-cell stage.4 Then, additional branches emerge on the same PF, in average at the 14-cell stage (for the second SF) and 17-cell stage (for the third SF). Therefore, in the WT, the very first steps of branching are spaced out in time as the primary filament grows. Figure 1A illustrates the growth curve of the WT primary filament, and indicates the time (hours) and the stage (number of cells), at which branches emerge (bars in the bottom of the right margin, respectively). It shows that the first three SFs, as well as the subsequent branches (up to six), emerge fairly regularly as the primary filament keeps growing (bars on the right are spaced out along the Y-axis; e.g., SF6 emerges when the PF is 25-cell big in average). Figure 1B shows that the mutant etl is characterized by a severe reduction in the growth of its primary filament during time, compared with the WT (figures are drawn at the same scales). For instance, 200 h after the first cell division, etl developed a 8-cell primary filament, compared with a 18-cell PF in the WT. Remarkably, in spite of this harsh delay, the branching time rate of etl looks similar to that of the WT (vertical bars on the X-axis for Fig. 1A and B, indicating when branches emerge in hours). Figure 2 shows that indeed, the slope of the branching kinetics observed in etl remains statistically comparable to that of the WT (Student test p value = 0.498).
Figure 1.
Growth of WT and étoile individuals. On each curve, the boxplot shows the distribution of the number of cells (t = 0 at the first cell division), with the line and open circles showing the mean number. Each of the first six secondary filaments is represented as bar, both on the X-axis, which indicates the mean time of their emergence, and on the Y-axis, which indicates the mean size of the primary filaments at the emergence (a + sign is indicated at their intersection). The size of these bars is proportional to the number of cells they contain at the last time point. The + signs appear above the mean growth curve because secondary filaments tend to emerge on longer primary filaments. (A) WT; 33 to 54 replicates (54 for the first seven values, then 53, 50, 33). (B) etl; 14 to 35 replicates (35 for the first seven values, then 34, 29, 14).
Figure 2.
Time (t = 0 at the first cell division) of secondary filament emergence. The first filament emerges earlier in étoile (126 h, open diamonds) than in the WT (151 h, full circles). Afterwards, the rate of emergence of the successive filaments is similar to the one of the WT, yet slightly faster in étoile (one filament every 11.13 h) than in the WT (one filament every 13.37 h); the difference between these slopes is not statistically significant (Student test p value = 0.498). The sample size is the same as in Figure 1.
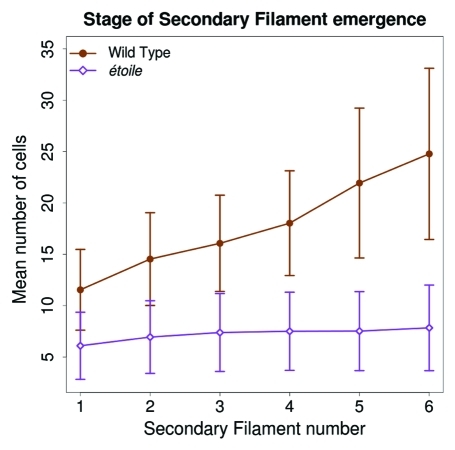
Hence, while in the WT, one new SF emerges when the PF has grown 2.6 cells in average, in etl, one SF emerges every additional 0.3 cell in the PF (Fig. 3). This means that the mutant etl has the capacity to develop > 8 times more SFs than the WT, for the same PF spatial base. Thus, in etl, branching is concentrated in a very small developmental window, and this generates the observed hyperbranched phenotype. A closer look shows that the branching time rate is even slightly faster in etl than in the WT, and that branching initiates earlier after the first cell division (Fig. 2). This accounts for the faster overall growth curve of etl compared with the WT, which was previously reported5. Therefore, once triggered, the branching process follows the same dynamics in etl as in the WT (with yet a slight rate increase), despite a severe reduction in the growth of the basal PF, meaning that the branching dynamics is not dependent on the stage of the supporting filament.
Figure 3.
Stage (number of cells in the primary filament) of secondary filament emergence. The first secondary filament emerges on a shorter primary filament in étoile (6.09 cells, open diamonds) than in the WT (11.54 cells, full circles). Afterwards, the ratio of FS emergence vs PF growth is higher in étoile (one secondary filament every 0.3 cells of the PF) than in the WT (one every 2.58 cells); the difference between these slopes is statistically significant (Student test p value = 3.9 10−9). The sample size is the same as in Figure 1.
Branching position
First, in etl, we observed that several SFs could frequently emerge on a single PF cell, probably because of both the similar dynamics of branching in etl and in the WT, and the severe growth reduction of the etl PF. This event is extremely rare in the WT.4
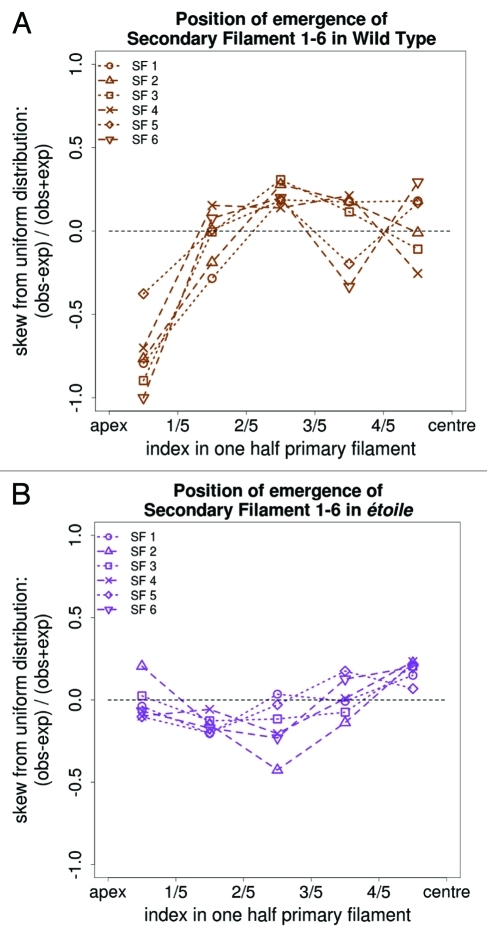
Second, observations on the PF of the positions at which SFs emerge were performed for the first to the sixth SFs both in the WT organism and in the etl mutant. Figure 4 shows that in the WT, the probability of branching is above the value expected under the assumption of a uniform distribution for all the positions along the filament except the apical parts. In contrast, in etl, each of the first six SFs can equally emerge at any relative positions along the PF. Therefore, the relative position of branching is modified in etl compared with the WT, and the previously reported inhibitory effect of the PF apical parts on branching7 seems to be lost in etl. This could be due to the severe reduction in the ratio of elongated (E) cells, which are located in the apical parts of WT filaments.5 Altogether, etl has modified the positional pattern of branching, as both apical branching and branching on the same cells, are frequently observed in this mutant.
Figure 4.
Position of branching. The most probable positions where the first six secondary filaments (SF1-6) emerge on the primary filament is indicated. The X-axis represents the relative positions along half a filament (considered symmetrical). The Y-axis represents the relative deviation from the values expected under the assumption of a uniform distribution of SFs. The horizontal dashed line corresponds to an indifferent tendency to emerge at this position. Positive and negative values on both sides of this dashed line correspond respectively to a higher and a lower likelihood for branches to emerge. (A) WT; (B) etl.
The relation between the branching and the growth dynamics were also investigated in the ascomycota fungus Neurospora crassa. In this organism, the lateral branching is still considered as occurring mainly randomly,8 because of the extremely big variations in the distances separating two branches. Yet, branching seems to obey a homeostatic process, ensuring that the average branch density remains constant whatever the growth rate.9 In mutants though, branching behavior can be dissociated from the growth rate of the hyphae, as the branch density increases considerably following changes in growth conditions (and then in the growth rate).10-12 A considerable decoupling can even be observed, for example in the cot-1 (Ser/Thr protein kinase) mutant displaying a bushy hyperbranched phenotype with a reduced growth of the hyphae,10,13 as observed in the E. siliculosus etl mutant.
In conclusion, the etl mutant allows us to display that the time dynamics and the spatial control of branching in the filamentous brown alga E. siliculosus can be decoupled, and hence that they are under the control of different molecular mechanisms. etl seems to be affected in cell-cell communication,5 which could account for a defect in the establishment of positional information along the filament, thereby affecting the spatial control of branching while keeping the dynamics unaffected.
Identification of the etl locus will shed light on the underlying molecular mechanisms, which might be supplemented by the further identification of additional mutants affected in their branching pattern.
Disclosure of Potential Conflicts of Interest
No potential conflicts of interest were disclosed.
Footnotes
Previously published online: www.landesbioscience.com/journals/psb/article/18054
References
- 1.Charrier B, Coelho SM, Le Bail A, Tonon T, Michel G, Potin P, et al. Development and physiology of the brown alga Ectocarpus siliculosus: two centuries of research. New Phytol. 2008;177:319–32. doi: 10.1111/j.1469-8137.2007.02304.x. [DOI] [PubMed] [Google Scholar]
- 2.Cock JM, Sterck L, Rouzé P, Scornet D, Allen AE, Amoutzias G, et al. The Ectocarpus genome and the independent evolution of multicellularity in brown algae. Nature. 2010;465:617–21. doi: 10.1038/nature09016. [DOI] [PubMed] [Google Scholar]
- 3.Baldauf SL. The deep roots of eukaryotes. Science. 2003;300:1703–6. doi: 10.1126/science.1085544. [DOI] [PubMed] [Google Scholar]
- 4.Le Bail A, Billoud B, Maisonneuve C, Peters AF, Cock JM, Charrier B. Initial pattern of development of the brown alga Ectocarpus siliculosus (Ectocarpales, Phaeophyceae) sporophyte. J Phycol. 2008;44:1269–81. doi: 10.1111/j.1529-8817.2008.00582.x. [DOI] [PubMed] [Google Scholar]
- 5.Le Bail A, Billoud B, Le Panse S, Chenivesse S, Charrier B. ETOILE regulates developmental patterning in the filamentous brown alga Ectocarpus siliculosus. Plant Cell. 2011;23:1666–78. doi: 10.1105/tpc.110.081919. [DOI] [PMC free article] [PubMed] [Google Scholar]
- 6.Billoud B, Le Bail A, Charrier B. A stochastic 1D nearest-neighbour automaton models the early development of the brown alga Ectocarpus siliculosus. Funct Plant Biol. 2008;35:1014–24. doi: 10.1071/FP08036. [DOI] [PubMed] [Google Scholar]
- 7.Le Bail A, Billoud B, Kowalczyk N, Kowalczyk M, Gicquel M, Le Panse S, et al. Auxin metabolism and function in the multicellular brown alga Ectocarpus siliculosus. Plant Physiol. 2010;153:128–44. doi: 10.1104/pp.109.149708. [DOI] [PMC free article] [PubMed] [Google Scholar]
- 8.Riquelme M, Yarden O, Bartnicki-Garcia S, Bowman B, Castro-Longoria E, Free SJ, et al. Architecture and development of the Neurospora crassa hypha–a model cell for polarized growth. Fungal Biol. 2011;115:446–74. doi: 10.1016/j.funbio.2011.02.008. [DOI] [PubMed] [Google Scholar]
- 9.Watters MK, Humphries C, deVries I, Griffiths AJF. A homeostatic set point for branching in Neurospora crassa. Mycol Res. 2000;104:557–63. doi: 10.1017/S0953756299001598. [DOI] [Google Scholar]
- 10.Steele GC, Trinci AP. Effect of temperature and temperature shifts on growth and branching of a wild type and a temperature sensitive colonial mutant (Cot 1) of Neurospora crassa. Arch Microbiol. 1977;113:43–8. doi: 10.1007/BF00428578. [DOI] [PubMed] [Google Scholar]
- 11.Watters MK, Griffiths AJ. Tests of a cellular model for constant branch distribution in the filamentous fungus Neurospora crassa. Appl Environ Microbiol. 2001;67:1788–92. doi: 10.1128/AEM.67.4.1788-1792.2001. [DOI] [PMC free article] [PubMed] [Google Scholar]
- 12.Watters MK, Boersma M, Johnson M, Reyes C, Westrick E, Lindamood E. A screen for Neurospora knockout mutants displaying growth rate dependent branch density. Fungal Biol. 2011;115:296–301. doi: 10.1016/j.funbio.2010.12.015. [DOI] [PubMed] [Google Scholar]
- 13.Scheffer J, Ziv C, Yarden O, Tudzynski P. The COT1 homolog CPCOT1 regulates polar growth and branching and is essential for pathogenicity in Claviceps purpurea. Fungal Genet Biol. 2005;42:107–18. doi: 10.1016/j.fgb.2004.10.005. [DOI] [PubMed] [Google Scholar]


