

Abstract
Although the budding yeast Saccharomyces cerevisiae is arguably one of the most well-studied organisms on earth, the genome-wide variation within this species—i.e., its “pan-genome”—has been less explored. We created a multispecies microarray platform containing probes covering the genomes of several Saccharomyces species: S. cerevisiae, including regions not found in the standard laboratory S288c strain, as well as the mitochondrial and 2-μm circle genomes–plus S. paradoxus, S. mikatae, S. kudriavzevii, S. uvarum, S. kluyveri, and S. castellii. We performed array-Comparative Genomic Hybridization (aCGH) on 83 different S. cerevisiae strains collected across a wide range of habitats; of these, 69 were commercial wine strains, while the remaining 14 were from a diverse set of other industrial and natural environments. We observed interspecific hybridization events, introgression events, and pervasive copy number variation (CNV) in all but a few of the strains. These CNVs were distributed throughout the strains such that they did not produce any clear phylogeny, suggesting extensive mating in both industrial and wild strains. To validate our results and to determine whether apparently similar introgressions and CNVs were identical by descent or recurrent, we also performed whole-genome sequencing on nine of these strains. These data may help pinpoint genomic regions involved in adaptation to different industrial milieus, as well as shed light on the course of domestication of S. cerevisiae.
The budding yeasts of the Saccharomyces genus are among the most important and widely studied model organisms in the biological sciences, and their long history of worldwide economic and cultural importance is indisputable. Evidence for the production of fermented beverages by Saccharomyces yeasts, mostly S. cerevisiae, dates at least as far back as 7000 B.C., with the earliest sites found in China (McGovern et al. 2004), then Iran (McGovern et al. 1997), and, slightly later, Egypt (Cavalieri et al. 2003). Since that time, fermentation technologies (and their associated yeasts) have comigrated with humans to spread throughout the world (Sicard and Legras 2011). Similarly, the practice of leavening bread by the incubation of dampened flour with S. cerevisiae yeasts was in full use in ancient Egypt (Samuel 1996), with both the practice and the associated yeast cultures spreading rapidly across the globe. Recently, fuel ethanol—commonly obtained by fermentation of sugar cane or corn by Saccharomyces yeasts—has become a multibillion dollar industry (Farrell et al. 2006; http://www.ethanolrfa.org/pages/statistics/). The close working relationship between yeasts and humans also has drawbacks: Pathogenic infections by S. cerevisiae do occur, albeit rarely, most often in immuno-compromised persons (Muller and McCusker 2009b). It is clear that starting >9000 yr ago, near the time that the common use of agriculture began to spread among human settlements, Saccharomyces yeasts—present as wild species in soil, fruits, or tree sap, and already possessing the ability to ferment sugars to alcohol plus carbon dioxide—were unwittingly commandeered by ancient humans to create either alcohol-containing beverages, or carbon dioxide for leavening. Further specialization of yeast strains presumably occurred during the development of different types of alcoholic beverages, by natural selection for growth on differing substrates (grapes vs. grains), and also possibly by human-directed selection of only those fermentations where particular desirable flavor compounds occurred; one result of this long history of domestication is that there now exist many different strains of S. cerevisiae that have been collected from differing industrial (and wild) habitats, which are commercially distributed for various specific industrial uses (Sicard and Legras 2011).
This act of domestication—some have called S. cerevisiae the earliest domesticated organism (Vaughan-Martini and Martini 1995)—leads to the question of how the genome of a previously wild species may have changed during thousands of years under selection for the various differing traits desired by humans. Numerous methods have been used to assay genomic variation in yeast and determine relationships between strains, and also used to infer strain origins and history (e.g., Schuller et al. 2004; Legras et al. 2005). Such studies include comparative analyses of microsatellites (Legras et al. 2007; Franco-Duarte et al. 2009; Muller and McCusker 2009b; Richards et al. 2009), mini- and megasatellites (Richard and Dujon 2006; Rolland et al. 2010), copy number variation using aCGH (Pérez-Ortín et al. 2002; Infante et al. 2003; Winzeler et al. 2003; Dunn et al. 2005; Carreto et al. 2008; Kvitek et al. 2008), and polymorphisms detected by tiling arrays (Schacherer et al. 2009), as well as the use of multispecies 131-gene taxonomic microarrays (Muller and McCusker 2009a) and Multi Locus Sequence Typing (MLST) (Fay and Benavides 2005a,b; Ayoub et al. 2006; Vigentini et al. 2009). These studies have mostly shown that yeasts used for a particular industrial use appear to be more closely related, but that geographical migrations, as well as genetic drift, have influenced diversity among S. cerevisiae populations (Legras et al. 2007). The Legras study, which sampled 651 yeast strains, suggested that S. cerevisiae diversity reflects human history, encompassing multiple domestication events, with most wine yeasts likely originating in Mesopotamia, and sake yeasts first arising in Asia. However, analysis of microsatellite markers in yeast populations from New Zealand (Goddard et al. 2010) suggested that the New Zealand yeasts, including some wine yeasts, form a distinct group from the yeast analyzed by Legras et al. (2007), and may not have originated in either Mesopotamia or Asia; it is unclear whether they were carried there initially by humans, or arrived by other means, such as dispersal from insects.
Most previous studies of yeast strain diversity have assayed only the reference genome of the S288c laboratory strain of S. cerevisiae, for many years the sole sequenced member of this species. However, the number of sequenced S. cerevisiae strains has been expanding rapidly (Wei et al. 2007; Doniger et al. 2008; Borneman et al. 2008; Liti et al. 2009; Novo et al. 2009; Borneman et al. 2011a,b), yielding more complete insights into both SNP level and structural variation and revealing that there are many kilobases of additional sequence that do not exist in the reference S288c genome. However, the S. cerevisiae pan-genome—the full complement of sequences within the species—has not been extensively characterized across a large set of strains.
Additional genomic variation can arise from interspecific hybridization, which can occur between two or more Saccharomyces species (for reviews, see Barrio et al. 2006; Sipiczki 2008; Querol and Bond 2009; Dujon 2010), e.g., S. cerevisiae–S. kudriavzevii hybrid wine and brewing yeasts (e.g., Bradbury et al. 2006; Gonzalez et al. 2008), S. cerevisiae–S. uvarum hybrid cider and brewing yeasts (e.g., Masneuf et al. 1998; de Barros Lopes et al. 2002; Rainieri et al. 2006), and the most well-known hybrid, the lager yeast S. pastorianus, which is an interspecific hybrid between S. cerevisiae and the recently described S. eubayanus (Libkind et al. 2011). Furthermore, introgression events, defined as a relatively small region of a different species' genome found within the genome of another species and mostly occurring within the closely related species of the Saccharomyces sensu stricto group, have also been detected (Naumova et al. 2005; Liti et al. 2006; Doniger et al. 2008; Muller and McCusker 2009a,b; Naumova et al. 2011). Horizontal gene transfer, in which genes are transferred from a distantly related organism (even trans-kingdom) through nonsexual mechanisms, has also been described among the Saccharomyces yeasts (Hall et al. 2005; Novo et al. 2009; Rolland et al. 2009), although it may be relatively rare.
Variation among the genomes of different yeast strains can be found in subtelomeric regions, transposable elements, tandem gene arrays, segmental duplications, and dispersed gene duplications. Subtelomeric gene families evolve faster than their internal counterparts, and subtelomeric regions are more frequently the sites of gene duplication (Ames et al. 2010), suggesting a “unique role of subtelomeres as hotbeds for genomic evolution and innovation” (Brown et al. 2010). For example, a presumed adaptive amplification of the subtelomeric SNO/SNZ genes has been shown to occur in fuel ethanol strains (Stambuk et al. 2009), and the subtelomeric location of sugar utilization genes has long been assumed to be adaptive (e.g., Brown et al. 2010). In addition, several transposable element families show variation in presence or absence, as well as copy number, in different strains, accounting for a large amount of genome diversity among the Saccharomyces yeasts (Liti et al. 2005). A further source of variation is the adaptive expansion or contraction of the number of genes in tandem arrays such as at the CUP1 (Fogel and Welch 1982) and HXT6/7 loci (Brown et al. 1998; Dunham et al. 2002; Kao and Sherlock 2008).
We sought to expand the knowledge of the S. cerevisiae pan-genome by analyzing a large set of commonly used commercial wine yeasts and comparing them to other industrial yeasts, including “native” (also called “wild,” “feral,” or “indigenous”) wine yeasts, beer yeasts, bread yeasts, and fuel ethanol yeasts. We focused on commercial wine yeasts not only because of their obvious economic and industrial importance, but also because they appear to have a common origin (Legras et al. 2007). To understand the consequences of selection during domestication we need to have a broader understanding of the levels of genetic diversity among wine yeasts. Furthermore, detailed characterization of genomic differences may shed light on biochemical pathways and cellular processes that play important roles in determining the specific fermentative qualities and wine sensory characteristics. Lastly, a genetic analysis of a diverse set of yeast strains may contribute fundamental information about the evolution and genetic diversity of S. cerevisiae itself.
We have developed a multispecies microarray platform incorporating probes for the S. cerevisiae genome at dense intervals, covering both the reference S288c genome and nonreference sequences recently identified by whole-genome sequencing (Wei et al. 2007; Borneman et al. 2008; Doniger et al. 2008; Liti et al. 2009; Novo et al. 2009). To detect hybridization and introgression events, we included probes for the Saccharomyces sensu stricto species S. paradoxus, S. mikitae, S. kudriavzevii, and S. uvarum (formerly S. bayanus var. uvarum, though sometimes previously referred to as only S. bayanus), plus two more distantly related species, S. kluyveri (Lachancea kluyveri) and S. castellii (Naumovia castellii).
We have performed aCGH on 69 commercial S. cerevisiae wine yeasts, and 14 additional S. cerevisiae yeast strains collected from a variety of different environments. We observed substantial copy number variation among S. cerevisiae strains for subtelomeric regions, transposable elements, mitochondrial and episomal genomes, and in genomic regions not present in the reference S288c strain. Little is known about the latter regions, making this the first characterization of these regions in a wide range of S. cerevisiae strains. We found evidence for interspecific hybridization between S. cerevisiae and S. kudriavzevii in four of the 69 commercial wine strains, and identified examples of several S. paradoxus introgressions, as well as an S. mikatae introgression. Several of the CNV and introgressions have been validated through whole-genome sequencing of nine of our S. cerevisiae strains. We observe that the strains cluster differently depending on the subset of aCGH data used; for example, when analyzing different functional groups such as Ty elements, or different genomic locations such as subtelomeric regions. This suggests that there has been significant recombination between these strains: Essentially there is a pool of CNVs present in the S. cerevisiae pan-genome, and these have been dispersed between the strains, presumably due to historical matings. Whether these matings were inadvertent, or whether they were human directed for strain selection is unknown.
Results
We performed aCGH on a set of 83 strains, all known or presumed to be S. cerevisiae. These strains consisted of 69 widely used commercial wine strains, and 14 others, including “native” wine strains isolated from un-inoculated fermentations in Italy, Sardinia, and California, two commercial ale strains, commercial and “native” bread strains, the standard laboratory strain S288c, and commercial fuel ethanol strains from Brazil and the United States (Table 1). We determined the ploidy of 62 of the commercial wine yeast strains (see Methods) and found that the great majority (50) were diploid, while eight were intermediate between diploid/triploid, two (strains VIN7 and NT50) were triploid, and two (EPII and D254) were tetraploid (data not shown).
Table 1.
S. cerevisiae strains assayed by aCGH

Interspecific hybridization and introgression events
We determined whether any of the strains were interspecific hybrids by examining the signals for probes corresponding to the six non-cerevisiae Saccharomyces species represented on our arrays. Note, because our probes correspond only to the reference genomes for these non-cerevisiae species, we are unable to detect nonreference sequences in their genomes. Likewise, where a strain's sequence differs from the reference genome, some of the probes may not hybridize as expected. However, large contiguous regions, containing conserved coding sequence, will be present in interspecific hybrids, and we expect to detect these unambiguously.
We found that four of the commercial wine strains—VIN7, EPII, NT45, and NT50—have varying amounts of the S. kudriavzevii genome present (Fig. 1). VIN7 is a “complete” interspecific hybrid, with essentially complete genomes of both species present, while strains EPII, NT45, and NT50 have only partial representation of the S. kudriavzevii genome (in decreasing amounts, respectively), mostly occurring as whole chromosomes or large chromosomal regions. VIN7, EPII, and NT50 have elevated ploidy, consistent with being interspecific hybrids, while NT45 appears diploid. The “partial” hybrid strains each contain an entire S. cerevisiae genome; additionally, EPII carries S. kudriavzevii chromosomes 6–9 and 13, plus a large portion of the left arm of chromosome 12, while NT45 carries S. kudriavzevii chromosomes 8 and 14, and NT50 retains only S. kudriavzevii chromosome 8 (Fig. 1). VIN7 and NT50 have been previously characterized as S. cerevisiae–S. kudriavzevii hybrids (Bradbury et al. 2006; Sampaio and Gonçalves 2008; Borneman et al. 2011b), but to our knowledge the wine yeasts NT45 and EPII have not previously been identified as interspecific hybrids. No other interspecific hybrids with any other Saccharomyces species were observed among our set of 83 strains.
Figure 1.
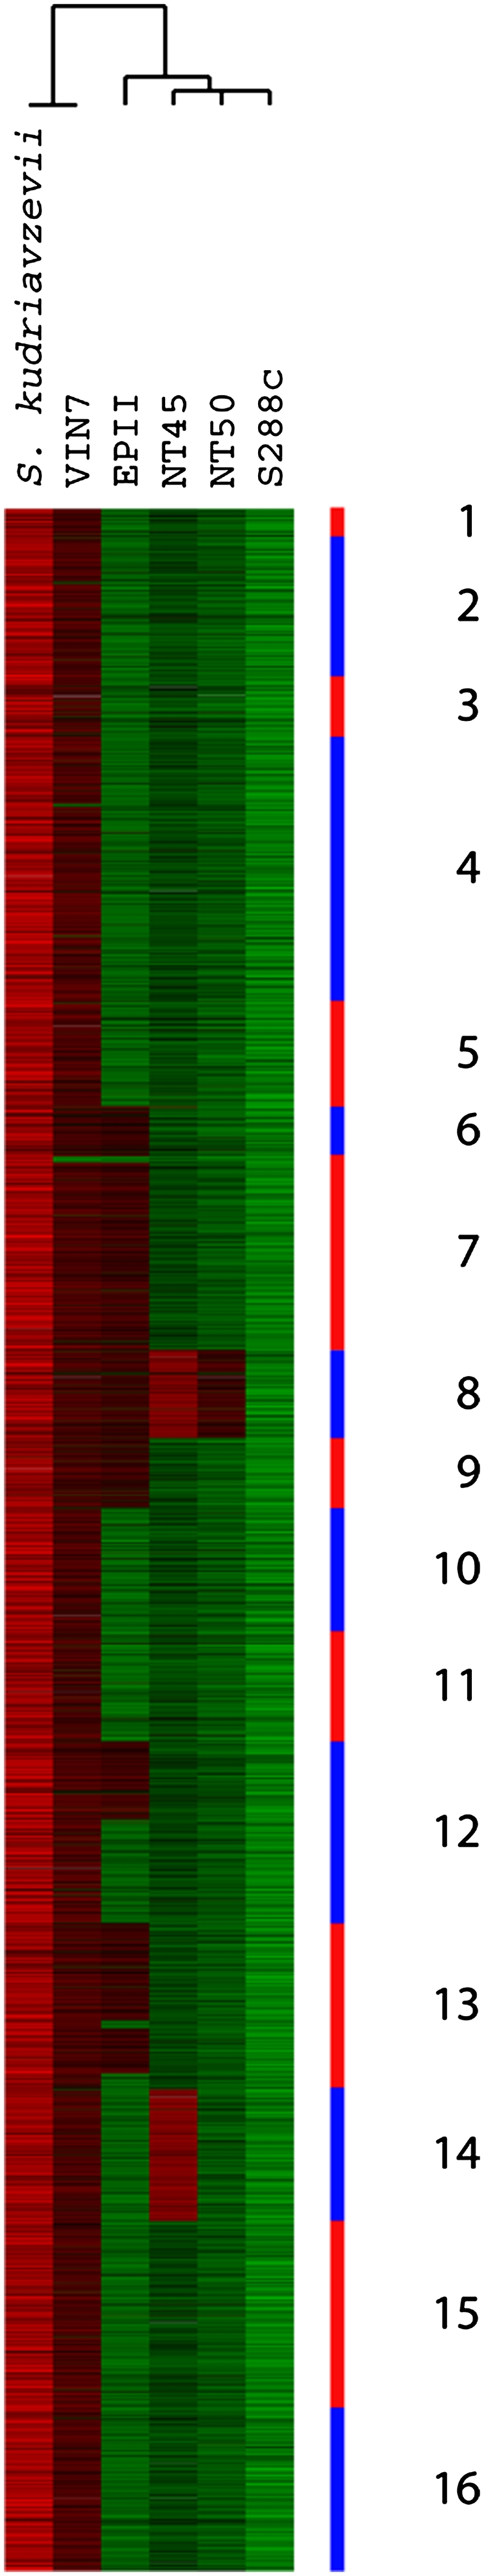
S. cerevisiae–S. kudriavzevii interspecific hybrids. aCGH data for all S. kudriavzevii probes are shown, with strain names along the top; for comparison, hybridization of the actual S. kudriavzevii strain to the S. kudriavzevii probes is shown on the left. Hierarchical clustering of the strains was performed using only the S. kudriavzevii probes and the generated dendrogram is shown above the strain names. Probes are shown in order of chromosomal position for the S. kudriavzevii chromosomes (Scannell et al. 2011), with alternating red and blue bands along the side indicating chromosome number. (Red bars) Increased hybridization (increased copy number relative to the pooled reference) to the probes. (Green bars) Decreased relative hybridization (decreased copy number).
Introgressed regions in S. cerevisiae strains are usually identified as isolated, relatively small sections of known non-cerevisiae sequence within an S. cerevisiae genome; typically only one to a few introgressed regions exist within a given strain's genome. We defined introgression events as non-cerevisiae genomic regions showing hybridization that spanned at least two contiguous probes. We observed five separate introgressed regions from S. paradoxus and one event derived from S. mikatae. We did not observe any obvious introgression events arising from the genomes of S. kluyveri or S. castellii, nor, interestingly, from S. uvarum, which is known to hybridize with S. cerevisiae, with many such hybrids found among brewing and cider strains (see introduction section above).
The five S. paradoxus introgression events involved a total of 15 of the 83 strains, 12 of which were wine strains (nine commercial, three “wild”); the remaining three were a “wild” bread strain and two commercial fuel ethanol strains (Fig. 2; Supplemental Fig. 1). Some of the introgressed regions are small (<1 kb), while in other cases they span large regions (up to ∼30 kb or more) (Fig. 2). Four commercial wine strains—WE14, Simi White, and both independent commercial isolates of strain R2 (AWRI-R2 and R2)—contain large overlapping S. paradoxus introgressed regions (Fig. 2, “SUC2 and AWA1 region”). In WE14 and Simi White, which appear to have identical endpoints for the introgression based on the probe hybridization patterns, the introgressed region spans a minimum of ∼19 kb. Both R2 strains have a larger introgressed region of at least 29 kb. Based on hybridization to the S. cerevisiae probes in the corresponding chromosome IX locations, the Simi White strain appears to be wholly lacking the corresponding S. cerevisiae SUC2 region (from YIL159W through YIL168W), and thus may carry two copies of the S. paradoxus–specific AWA1 gene; the two R2 strains appear to have one copy of the S. cerevisiae region and one copy of the S. paradoxus region, while the WE14 strain appears to retain both copies of this region of S. cerevisiae in addition to one copy of the S. paradoxus region (Supplemental Fig. 2).
Figure 2.

S. paradoxus introgression events. aCGH data for only the S. paradoxus probes involved in introgression events are shown, with each separated group indicating a separate introgression event; within each group, probes are in S. paradoxus chromosomal order (Scannell et al. 2011). For comparison, hybridization of the actual S. paradoxus strain to the probes is shown on the left. Only the strains containing such introgressions are shown, with strain names shown at top; key genes within each introgressed region are indicated along the right. A version of this figure with chromosome, coordinate, contig, and contig coordinate shown on the right is available as Supplemental Figure 1. (Red and green bars) Increased and decreased relative hybridization to the probes, respectively.
A different S. paradoxus introgression event is seen in four other strains: The commercial wine strains AWRI350 and BA11 contain an introgessed region spanning three probes (at least 2 kb), while the Sardinian “native” sourdough strain S11 and the commercial fuel yeast Ethanol Red both contain a slightly smaller introgression of this region, spanning two of the three probes (∼800 bp) (Fig. 2, “EPH region”). In all four strains the introgressed region contains the entire coding sequence of a S. paradoxus gene EPH1 that codes for an epoxide hydrolase (Fig. 2). The remaining S. paradoxus introgression events (Fig. 2) correspond to regions that contain genes with similarity to the following syntenic S. cerevisiae genes: an introgressed region of chromosome 1 containing several genes of the repeated DUP240 gene family, seen in three commercial and three wild wine strains; and two introgressed regions that are seen only in the Brazilian fuel yeast BG1: a region on chromosome 9 containing MAL (maltose utilizing) genes, and a region on chromosome 4 containing the STL1 (glycerol symporter), and PAD1 and FDC1 genes (both phenylacrylic acid decarboxylases).
In addition to the S. paradoxus events, an introgression event involving S. mikatae was seen (Supplemental Fig. 3); it is ∼4.5 kb in length, and is observed only in the British Ale, Sardinian Sourdough, and Ethanol Red strains. Note that while the ale strain does not contain any other introgressed regions, the latter two strains also contain the short version of the S. paradoxus EPH1 introgressed region. This S. mikatae introgressed region corresponds to the right end of S. cerevisiae chromosome VI, bordered on the left by IRC7 (YFR055W), but with non-S288c sequences distal; the non-S288c region apparently does not contain any coding sequences.
The S. cerevisiae genome has copy number variation at specific genomic locations
To investigate the extent to which strains differed within just the S. cerevisiae genome, we analyzed CNVs in S. cerevisiae genomic regions, including S288c and non-S288c sequences, as well as mitochondrial and 2-μm plasmid sequences. The hybridization signals for the majority of the probes are essentially invariant across all strains, but several distinct regions of the nuclear genome showed great variability, as did the mitochondrial and 2-μm plasmid genomes. Plotting each probe's standard deviation by chromosomal position shows that the subtelomeric regions are the most variable (Fig. 3); in addition, many discrete internally located regions with high copy number variation correspond to members of the Ty family of retrotransposons, or the Long Terminal Repeats (LTRs) that remain in the genome after transposition of these elements. Based on these observations, we separately clustered our data for: (1) subtelomeric regions, defined as the regions in the S288c genome that are within 30 kb of each chromosome end (Brown et al. 2010); (2) non-S288c genomic regions (although they are not mapped onto chromosomes, they were also among the most variable regions); (3) retrotransposon family elements (Ty1 through Ty5, each clustered separately); and (4) the mitochondrial and 2-μm plasmid genomes. Our aim was to determine whether these regions were predictive of known industrial or geographic origins of the yeasts, and/or other known attributes.
Figure 3.

Variation in S. cerevisiae S288c probe hybridization by chromosomal location. Standard deviations of hybridization ratios of S288c nuclear genome probes across all 83 strains were calculated, mean-centered, and plotted onto the S. cerevisiae chromosomal map using the program Caryoscope (Awad et al. 2004). (Left) Chromosome numbers; (vertical black lines) position of centromeres. (Red bars) Positive SD values, proportional to length; (green bars) negative SD values, proportional to length.
Subtelomeric regions
For many subtelomeric regions, large variations across the strains exist, although for some chromosomes (notably II, XIII, XIV, and XVI) there is little variation, or variation is seen for only one end (Figs. 3, 4). There appears to be no correlation with the presence or absence of X or Y′ elements (as reported in the S288c genome) and the amount of variation observed. While there are different subsets of variation that exist among different groups of strains, no single group can easily be defined as containing a unique set of these variations.
Figure 4.

aCGH results for subtelomeric regions. aCGH data for probes from the S288c genome within 30 kb of the end of each chromosome are shown in order, from the chromosome 1 left telomere to the chromosome 16 right telomere, from top to bottom, with separation between each chromosome. Note that for each chromosome the top half represents the first 30 kb of the left end (in order of chromosomal position), and likewise, the bottom half represents the 30 kb of the right end (again in order of chromosomal position); the split between left end and right end probes is shown by a black horizontal line within the red or blue bar on the right that indicates the chromosome. Hierarchical clustering, using only these subtelomeric probes, was performed, with the generated dendrogram shown at top. Different clusters are highlighted as discussed in text. (Red and green bars) Increased and decreased relative hybridization to the probes, respectively.
A large cluster of strains, containing 57 of the 69 commercial wine strains, all six wild wine strains, and only one of the non-wine strains (the “native” Sardinian sourdough strain, although it is one of the most dissimilar strains in this cluster), is present in the center of the overall cluster (Fig. 4, cluster highlighted in green and blue); we thus considered this a “wine” cluster. Contained within this cluster is a distinct subcluster of 14 strains (highlighted in blue) containing 11 commercial wine strains commonly known among winemakers and yeast producers to be related, all belonging to the PDM (“Prise de Mousse”) family: LVCB, DV10, Elegance, 4F9, Rhone4600, EC1118, QA23, N96, IOC18-2007, PDM, and PC. This subcluster also contains three strains not previously identified as belonging to the PDM family: NT116, NT112, and NT202.
Of the remaining wine strains not included in the “wine” cluster, three commercial strains—Primeur, 71B, and S101—reside in a small cluster on the left side, highlighted in orange, that also contains the remaining two bread strains (Morocco Bread and Sardinian Commercial, which are extremely similar to each other based on this analysis); this is in agreement with studies reporting that the Primeur and 71B wine yeasts have genomic similarity to bread yeasts by both microsatellite repeat and multilocus sequence analysis (Fay and Benavides 2005a; Ayoub et al. 2006; Legras et al. 2007). The remaining nine commercial wine strains do not appear in any distinct clusters.
Of the remaining non-wine strains, the two ale strains are similar to each other in their subtelomeric CNV patterns and somewhat similar to the bread cluster, while the fuel strains Ethanol Red and Brazilian BG-1, as well as the standard reference laboratory strain S288c, are the most divergent from all other strains based on subtelomeric CNV. Only S288c contains the bacterially derived (and therefore horizontally transferred) (Hall et al. 2005) aryl-sulfatase gene BDS1 (YOL164W) near the left end of chromosome 15 (indicated by an arrow on Fig. 4).
Non-S288c sequences
When only non-S288c sequences are used to cluster the strains, the result is similar to what was seen when clustering by subtelomeric sequences (Fig. 5). Again a large cluster of almost only wine strains is seen, with several distinct subclusters (Fig. 5, cluster highlighted in teal and dark blue). The wine strains 71B, Primeur, and S101 again cluster with the two commercial bread strains (Fig. 5, cluster highlighted in orange); again, the two commercial bread strains share the most similarity with each other out of all 83 strains. The PDM-like strains that were tightly clustered when using subtelomeric CNV are now split into two groups of seven strains each (Fig. 5, clusters highlighted in dark blue and labeled PDM and PDM2). In contrast to their subtelomeric CNV clustering, the two ale strains are quite dissimilar to each other when using the non-S288c sequences to cluster and, likewise, all six of the wild wine strains show more dissimilarity to the commercial wine strains.
Figure 5.

aCGH results for non-S288c regions. Hierarchical clustering using only the aCGH data from the S. cerevisiae non-S288c probes was performed, with the generated dendrogram shown at top. Different clusters are highlighted as discussed in text. (Red and green bars) Increased and decreased relative hybridization to the probes, respectively.
Transposon elements
We also clustered the 83 strains based on their copy number variability for each of the retrotransposons, Ty1 through Ty5. Among these clusters (Supplemental Fig. 4A–D), the Ty1 family shows the most variability among the strains (see below). Ty3, Ty4, and Ty5 families show less variation, each clustering into two “classes,” one whose members contain the full-length elements, and one whose members appear to lack (or have a very low copy number of) the full-length elements, but retain the associated LTRs (Supplemental Fig. 4B–D). Note that every strain we examined contained some type of sequence (full-length and/or LTR) from all five transposon families, indicating that all 83 strains that we analyzed had carried Ty1–Ty5 elements at some time in their past history. The Ty2 family appears to be equally present in all strains examined (data not shown), and thus does not separate the strains into any distinct groupings. The Ty3 and Ty4 clustering results are similar in terms of the strains in each “class,” although there is not a complete overlap; the patterns do not appear to distinguish the strains by industrial use. Perhaps the most interesting observation for the Ty3 and Ty4 clusters is the pattern displayed by VIN7 and EPII (two of the S. cerevisiae–S. kudriavzevii hybrids) for Ty3 (Supplemental Fig. 4B), and by VIN7 for Ty4 (Supplemental Fig. 4C), whereby some, but not all of the full-length elements are present. Almost all strains examined contain the full-length Ty5 elements, with the only exceptions being four strains—the two ale strains and the two similar bread strains (Morocco and Sardinian Commercial)—which lack the full-length elements, but appear to contain copies of the Ty5 LTRs (called “omega” elements; Supplemental Fig. 4D).
Our probes were able to distinguish among at least some of the 30 or more Ty1 elements that occur in S288c (found on at least 12 of the 16 chromosomes). Two major clusters, each consisting of two subclusters, are seen after hierarchical clustering (Supplemental Fig. 4A). All 83 of the S. cerevisiae strains contain at least some full-length Ty1 elements and solo “delta elements” (the LTR that remains after a Ty1 element has transposed away from that location). In one major group, 23 strains, all of which are wine strains, hybridize well to about half of the Ty1 probes on the array (Supplemental Fig. 4A, left side; names highlighted in red). The genomes of the other group, made up of the remaining 60 wine and non-wine strains, hybridize well to almost all of the Ty1 probes on the array (Supplemental Fig. 4A, right side; names highlighted in orange). Within each of these two major groups is a subset of strains (wine, ale, and fuel) that distinctly lack a discrete set of delta elements from chromosomes I and VIII (Supplemental Fig. 4A, strain names underlined in blue; probes with “green” hybridization at top of heat map), though these elements lie in larger deletion events within those chromosomes, so are unlikely to be Ty1-specific events. Although more resolution in groupings were seen with Ty1 than with the other Ty elements, in general, the hybridization patterns for all the Ty elements were not as discriminatory for industrial grouping as were the subtelomeric and non-S288c sequences.
2-μm plasmid genome
The 2-μm plasmid is a high-copy episomal plasmid (for review, see Futcher 1988) not known to confer any fitness differences in any environments tested (Falcon et al. 2005). Our data show it to be absent in only six strains: five commercial wine strains (S377, AWRI796, T306, L2226, and F33) and one non-wine strain (the fuel yeast EtOH Red) (Supplemental Fig. 5); all other S. cerevisiae strains that we examined, including the “wild” wine strains and the S. cerevisiae–S. kudriavzevii interspecific hybrids, contain this plasmid. Most strains have slightly lower hybridization levels for the plasmid probes than does S288C, suggesting that these strains have a lower copy number of the plasmid than does S288C (or possibly evenly dispersed polymorphisms, although we think this less likely). The non-cerevisiae species that we examined (S. paradoxus, S. mikatae, S. kudvriavzevii, S. uvarum, S. castellii, and S. kluyveri) all lack the plasmid (data not shown). A presumably smaller version of the plasmid is seen in the three commercial wine strains that consistently cluster with bread strains (Primeur, S101, and 71B) and in the Brazilian fuel yeast BG-1; however, the bread strains themselves appear to contain the entire plasmid reference sequence (Supplemental Fig. 5).
Mitochondrial genome
The mitochondrial genomes found in S. cerevisiae strains show great variation (Fig. 6A). None of the strains, not even our S288c isolate, appeared to contain the complete mitochondrial genome defined by the S288c sequence obtained from SGD, upon which we based our probes. Three strains (NT116, NT202, and NT112) appear to contain the largest proportion of the mitochondrial genome, while one strain, the “full” S. cerevisiae–S. kudriavzevii hybrid VIN7, appears to contain essentially no S. cerevisiae mitochondrial sequences, implying that it may contain a S. kudriavzevii mitochondrial genome (Fig. 6A).
Figure 6.

Mitochondrial DNA variation. (A) Hierarchical clustering, using aCGH data from just the S. cerevisiae mitochondrial DNA probes was performed with the generated dendrogram shown at top; the probes are ordered according to their position along the mitochondrial genome. (Red and green bars) Increased and decreased relative hybridization to the probes, respectively. Genes corresponding to the probes are shown along the right. (B–D) GBrowse visualization of the COX1, COB and 21S_rRNA genes of the mitochondrial genome, showing the various alternatively spliced transcripts. (Yellow highlighting) Intronic regions to which array probes exist, which we sometimes observe as absent; (beige highlighting) exonic regions to which array probes exist, which we always observe as present.
Certain strains have lost specific regions of some mitochondrial genes (e.g., COX1, COB, 21S rRNA), indicated on Figure 6A. The deletions in these genes appear to correspond precisely, within the localization constraints allowed by our probes, to introns within these mitochondrial genes (Figs. 6B–D). These introns are Group I introns (Moran et al. 1992), which are self-splicing mobile RNA elements (for review, see Haugen et al. 2005). Strain-to-strain variation in mitochondrial restriction fragment polymorphisms has long been used for molecular “typing” of wine yeasts and other S. cerevisiae isolates (e.g., Querol et al. 1992).
The complexities of the varying mitochondrial genome architectures are illustrated by COX1 (Fig. 6A,B); our probes monitor all seven introns and many of the eight exons for this gene, and we see evidence that each of the first six introns (but not the seventh, although it is only represented by one probe) can be independently deleted, with many combinations of these deleted introns being observed among strains. For example, on Figure 6A, the strains from S288c through X5 all contain the first two introns of COX1 (although they show various combinations of deletion or retention for other introns), D47 through AWRI350 lack the first intron but have the second, VL3C through S101 lack both introns, and strains from the Ancona Italian “wild” wine strain AN-151 through UCD522-M have the first intron, but lack the second (Fig. 6A); again, each of these groups shows further variance in which of the remaining COX1 introns are present. We also see variation in intron presence in both COB and the 21S rRNA (Fig. 6A,C,D).
Even though the mitochondrial genome is cytoplasmically inherited, we observe some of the same groupings as we see based on nuclear genomic features. For example, the 11-member PDM group, along with some other commercial wine strains, forms the cluster with the most mitochondrial aCGH similarity among its members (Fig. 6A). Likewise, the three “bread-like” commercial wine strains (Primeur, 71B, and S101) also form their own mitochondrial aCGH cluster, although (as occurred with the 2-μm plasmid results) they do not cluster with the two bread strains, which themselves form a tight two-member cluster of high similarity.
Validation of aCGH results by whole-genome sequencing
As part of a separate project to characterize S. cerevisiae genome diversity, we had whole-genome sequenced several strains, nine of which (see Table 1) we also examined by aCGH in this study. We thus used these sequences to validate CNVs and introgression events observed in our aCGH data. To validate CNVs, we determined read coverage across the S. cerevisiae genome. Examination of several regions of the S. cerevisiae genome that we had identified as variable by aCGH (Supplemental Figs. 6–8), showed that in all cases the whole-genome sequencing read coverage gave results consistent with the aCGH results. Many deleted regions correspond to repeated subtelomeric regions or transposon (Ty) elements, which are difficult to investigate further due to their repetitive nature. However, we could validate several events by PCR. One was an amplification seen on chromosome 7 in two of the “wild” wine strains (Ridges F21 and F22). This region corresponds to YGR201C, an uncharacterized ORF coding for an elongation factor 1-gamma ortholog of unknown function. Read coverage of this region in Ridge F21 validated our aCGH results; PCR with unique flanking primers suggest a probable multicopy tandem repeat of the region in this strain, with the expected single-copy size observed in other strains (data not shown). For two loci known to be tandemly repeated in S288c, we were able to identify presumed intrachromosomal recombination events that resulted in deletions. In the region containing ENA1, ENA2, and ENA5, several strains show deletion of the unique intergenic regions, and reduced hybridization of the genic regions (Supplemental Fig. 7), suggesting that the two of these three loci have been deleted. Similarly, at the HXT6/7 locus, we see loss of the unique region between these genes, and reduced hybridization of the genic regions (Supplemental Fig. 8), again suggesting deletion of one of the gene copies by recombination; this was validated by PCR with unique flanking primers (data not shown).
To investigate the five S. paradoxus introgressions that the aCGH data suggest are present in our sequenced strains, we mapped sequence reads to both the S. cerevisiae (S288c and non-S288c sequences) and S. paradoxus genomes. We examined regions of the S. paradoxus genome for which we had observed introgression events and, in all cases, identified reads mapping uniquely to these regions, confirming their existence. To determine their locations within the S. cerevisiae genome, we looked at the paired ends of these reads. We were able to discern the insertion points in the S288c genome for two of the introgressions: The ∼28-kb introgression of the MAL region is inserted in its syntenic region at the right end of chromosome 7, and the smaller introgression of the STL1-PAD1-FDC1 region is likewise also in its corresponding syntenic location at the right end of chromosome 4. The locations of these introgressions were further confirmed by PCR using an S. cerevisiae and S. paradoxus primer pair (data not shown). For the other introgressions that did not have insertion points mapping to the S288c sequence, in one case—the EPH1 containing region—the paired ends mapped to non-S288c S. cerevisiae sequence derived from the K11 sake strain, and for the others the insertion point could not be determined.
Principal component analysis of aCGH data
Hierarchical clustering of the aCGH data for different types of genomic features mostly gave different groupings of strains, with only a few strains—such as the two commercial bread strains, and to a lesser degree the PDM family of strains—showing consistent relationships. This suggests that active exchange of these genomic regions, presumably by mating, may have occurred among the progenitors of these yeast strains. We performed unscaled principal component analysis (PCA) using the 1119 most variable S. cerevisiae aCGH probes (see Methods); PC1 accounted for 23.6% of the variation, while PC2 and PC3 accounted for an additional 10.8% and 9.6% of the variation, respectively. Plotting of PC1 vs. PC2 (Fig. 7) resulted in most of the wine strains being spread across PC1, with three other distinct groups: (1) the commercial bread strains and bread-like wine strains, (2) the ale strains, and (3) the PDM family; consistent with our hierarchical clustering results. All non-wine strains (except the Sardinian sourdough strain) are located to the left of the dotted line on the plot (PC1 values ≤ − 10), as are the PDM wine group plus SimiWhite; in contrast, the remaining non-PDM wine strains, including wild strains, are very diffusely scattered and are located only at values of PC1 ≥ − 10 (Fig. 7). Using higher-order principal components or different criteria for separation of strains, such as by geographical origins, failed to show distinct grouping (data not shown).
Figure 7.

Principal component analysis (PCA) of aCGH data. The first two principal components are shown on the axes, with their associated percentage of explained variation. Strains are shown as dots, colored by industrial source: bread strains (dark blue); lab strain (fuchsia); ale strains (light blue); fuel strains (green); “bread-like” commercial wine strains (red); PDM family commercial wine strains (gray); all other commercial wine strains (black); and “wild” wine strains (yellow). Dotted line extending vertically from X = −10 shows approximate cutoff of non-wine and wine strains.
We determined the probes that were most responsible for skewing the wine strains toward the positive PC1 values, in opposition to the non-wine and PDM strains. The top 40 most strongly “positive” (“wine-like”) PC1 probes were a mix of probes derived from S288c, the wine strain AWRI1631, and the wine-derived laboratory strain Y55 (Supplemental Table 1). Most of the S288c probes come from near AGP3 (coding for an amino acid permease used to scavenge for nitrogen) and DAK2 (a dihydroxyacetone kinase required for detoxification of dihydroxyacetone and involved in stress adaptation) near the left telomere of chromosome 6. Strikingly, most of the AWRI1631 and Y55 probes come from regions homologous to the S288c AGP3 gene promoter (Supplemental Table 1). The remaining S288c probes are from two virtually identical regions at the telomeres of chromosomes 4 and 10 that contain the MPH2/SOR2 and the MPH3/SOR1 genes, respectively, while the remaining AWRI1631 and Y55 probes are from non-S288c sequences of unknown function. These regions have been shown in our data (Figs. 3,4) and in previous work (Stambuk et al. 2009) to be highly variable in copy number among yeast strains and to be present in most wine strains.
In contrast, the 40 most strongly “negative” probes (i.e., “non-wine-like”) were all from the S288c genome; most were associated with Ty4 and Ty1 transposons or with the pair of homologous VTH1/2 genes (membrane glycoproteins possibly involved in vacuolar sorting), while one probe was from the YJL218W gene, which codes for an oleate-induced protein similar to bacterial galactoside O-acetyltransferases (Supplemental Table 1). Almost all of the non-wine strains show strong hybridization to these regions, while the majority of wine strains do not (with the exception of the PDM family of wine strains and a few others; e.g., see Supplemental Fig. 4, B and C for Ty3 and Ty4 patterns).
Discussion
Recent evidence shows that the domestication of Saccharomyces yeast resulted in the evolution of novel environmental specialization, and also in new yeast species via interspecific hybridization, autopolyploidization, gene duplication, gene transfer, and other large-scale genome changes (for review, see Sicard and Legras 2011). Using aCGH on a custom multispecies array platform, we show that different genomic locations have differing levels of copy number variation across the genomes of 83 of S. cerevisiae strains isolated from different industrial environments. We have documented more precisely specific instances of interspecific hybridization and introgression in some of these strains, and found evidence for sharing of CNVs, presumably via mating in most, if not all, of the industrial strains we investigated.
Interspecific hybridization and introgression
We identified four commercial wine yeast strains that are interspecific hybrids between S. cerevisiae and S. kudriavzevii: VIN7, NT45, NT50, and EPII. Of these, VIN7 and NT50 had been previously identified as such (Bradbury et al. 2006; Sampaio and Gonçalves 2008; Borneman et al. 2011b); however, the status of EPII and NT45 as interspecific hybrids is novel. We found that VIN7 is a triploid and contains a complete S. kudriavzevii genome; both observations have been recently confirmed by whole-genome sequencing (Borneman et al. 2011b). In contrast, we found that the other three strains have lost many (from 10 to 15) of the S. kudriavzevii chromosomes, similar to previously identified S. cerevisiae–S. kudriavzevii hybrids (Gonzalez et al. 2008). None of the other strains showed evidence of recent interspecific hybridization. Although S. uvarum and S. cerevisiae–S. uvarum hybrids play a role in winemaking (Naumova et al. 2011), we saw no evidence for such hybrids or S. uvarum introgression events among our commercial or the wild wine isolates.
We identified several introgression events; most were derived from S. paradoxus, with only one event derived from S. mikatae. This is in contrast to the fact that we found no recent interspecific hybrids between S. cerevisiae and either of these species. This may indicate that interspecific mating events occurred in the progenitors of some of these strains, and that presumably rare fertile progeny were able to backcross to a S. cerevisiae parent enough times such that only one or a few loci from the alternate genome were retained; it is unknown whether there has been a selective pressure (from winemakers, or environmental factors) to retain the acquired sequences or not. In only two strains was there evidence of introgression from both S. paradoxus and S. mikatae; in all other cases, introgression appears to have occurred with only one of the non-cerevisiae species. For the two strains with dual species introgression, this implies that progenitors of these strains either (1) successively hybridized with each of the other two species, or (2) hybridized with one of the other species, which already contained the other introgression. In all cases, it appears that the introgressed regions occur near or within subtelomeric regions (Naumova et al. 2005, 2011), and are found among the various strains in either homozygous (lacking equivalent S. cerevisiae sequences) or hemizygous states.
We observed at least five S. paradoxus introgression events; in some cases, several strains contained two S. paradoxus introgression events located in different regions of the genome, indicating that perhaps these introgressions did arise from an initial interspecific hybridization. Two of the five introgressions have been described previously: The introgressed DUP240 gene family region from S. paradoxus chromosome 1 that we observed in several commercial and “wild” wine strains (Fig. 2) has been described as occurring in the clinical strain YJM789 (Wei et al. 2007) and in the fig-derived strain EM93, a progenitor of S288c (Esberg et al. 2011). Additionally, the EM93 strain shows a large swath of polymorphisms corresponding to the same region as the introgressed MAL region from S. paradoxus chromosome 7 that we observed in the Brazilian fuel yeast strain BG1, indicating that this region may also be introgressed in EM93 (Esberg et al. 2011). Although several other S. paradoxus introgression regions have been described in S. cerevisiae (Liti et al. 2006; Doniger et al. 2008; Muller and McCusker 2009a) we do not observe them in our strain set. However, the introgression described in Doniger et al. (2008) is located at the tandemly repeated ENA locus, where we observed copy number variation (see Results).
The remaining three S. paradoxus introgression events that we observed have not been described previously. They are of interest in terms of yeasts adapted to wine making and other high-sugar environments such as sugar cane juice. The largest S. paradoxus introgressed region, which occurs only in commercial wine yeast strains, spans the region corresponding to the SUC2 region of the S. cerevisiae genome and includes not only the S. paradoxus SUC2, which codes for the sucrose-hydrolyzing invertase, but also contains a gene similar to S. cerevisiae HPF1, a glucan alpha-1,4-glucosidase that, when overexpressed, reduces protein haze formation in white wines (Brown et al. 2007). Furthermore, this introgressed region also contains AWA1, a gene that does not occur in the S288c genome but is found in S. cerevisiae sake strains; it codes for a putative GPI-anchored protein localized to the cell wall and is involved in foam formation in sake mash by conferring hydrophobicity to the cell surface (Miyashita et al. 2004). It is possible that there are some adaptive or industrially desirable qualities that the S. paradoxus genes in this region confer to these wine strains and/or that the presence of these genes reflects past history of the strains; e.g., perhaps the S. paradoxus–SUC2 containing strains had been previously used to ferment sugar cane (unfortunately, we do not know the history of these strains). The strains that exhibit this introgressed region are: AWRI-R2 and R2 (considered to be two isolates of the same strain), plus Simi White and WE14. Perhaps reflecting the presence of the AWA1 gene, we have found that the Simi White strain produces abundant foam during fermentation (data not shown).
The second S. paradoxus introgression event of interest involves a region of ∼2 kb containing the entire coding sequence of the “epoxide hydrolase” gene EPH1 (Smit 2004). Four strains contain this region: The Sardinian sourdough strain and the commercial fuel yeast Ethanol Red (presumably not related to each other) show a similar introgression region, while the wine strains AWRI350 and BA11 (not known to be related) have a slightly larger introgressed region. Epoxide hydrolases are involved in detoxification, converting harmful, chemically reactive terpenoid and phenol epoxides into less-reactive vicinal diols, and this gene may confer adaptive value in the highly phenolic grape environment. Note, EPH1 from S. paradoxus may itself be a result of horizontal transfer, since its closest homolog is bacterial (see http://www.led.uni-stuttgart.de/cgi-bin/LED/tree.pl?fam_id=aln44). We do not know whether EPH1 arrived in the wine strains directly from S. paradoxus or from a separate horizontal transfer event. The third S. paradoxus introgression event is only seen in the Brazilian fuel yeast BG1 and encompasses a region of ∼4 kb containing the STL1 gene (involved in glycerol transport) (Tulha et al. 2010) and the PAD1 and FDC1 genes (both phenolic acid decarboxylases) (Mukai et al. 2010). STL1 is expressed in osmotic shock conditions (likely to be experienced in sugar-cane juice), and it is also likely that detoxifying phenolic acids may be important in this environment.
Copy number variation
Hierarchical clustering of the CNV data revealed no obvious clusters, either by industrial subtype or geography. However, we noticed that various specific genomic features exhibited high variability among the strains: (1) subtelomeric regions; (2) non-S288c genomic regions; (3) retrotransposon family elements (Ty1 through Ty5); and (4) the non-nuclear mitochondrial and 2-μm plasmid genomes. Since it is likely that many of the non-S288c genomic sequences are located subtelomerically (Novo et al. 2009)—and this is also intimated by the fact that our clusters from subtelomeric regions were similar to those generated from non-S288c sequences—we interpret our data as showing that most of the copy number variation observed among these 83 diverse S. cerevisiae industrial strains occurred either in the subtelomeric regions or among the classes of transposable elements. This has been noted before (e.g., Dunn et al. 2005; Liti and Louis 2005; Liti et al. 2005; Brown et al. 2010); however, in this study we have generated the most comprehensive catalog of copy number variation among a wide variety of Saccharomyces strains thus far.
We clustered the aCGH data separately for each type of feature listed above to see whether any one or more of these regions were predictive of known industrial or geographic origins of the yeasts, and/or other known attributes, but found that each separate feature gave somewhat differing cluster groups. Overall, there are no commercial wine strains that appear to be absolutely identical to each other. Similar to results from our previous small-scale aCGH analysis of wine yeasts (Dunn et al. 2005), however, we found pairs or groups of strains that are very closely similar to each other, no matter which genomic feature was used as the basis for clustering: the group of 14 similar strains among the PDM family is one example. We also found high similarity in CNV patterns among pairs or small groups of strains thought to be isolates of the same starting strain: UCD522-M and UCD522-L (which are thought to be two independent isolates of the same U.C. Davis “Montrachet” strain), AWRI-R2 and R2 (thought to be two independent isolates of the same “R2” strain); in addition, D47 and BRL97, not known to be related, appeared quite similar, as did the set of three “bread-like” commercial wine yeasts (Primeur, 71B, and S101) (Legras et al. 2007); finally, the two most closely similar strains among the entire set for any given type of cluster were the Moroccan bread yeast and the Sardinian commercial bread strain. Clustering of the aCGH data for either the subtelomeric regions or the non-S288c sequences gave the best separation of strains based on their industrial use, although with either analysis there are still 10–15 wine strains (even discounting the three “bread-like” strains) that do not fall into the major wine group(s). In general, however, because clustering of each of the different types of features gave differing groups of strains, it appears that there has been active interchange of these regions rather than separate lineages descending from isolated ancestors, suggesting that most of these strains are the result of interbreeding between wine strains. We do not know whether such matings would have been human directed, or inadvertent, or whether they in fact predate the collection of these strains.
We also observed that some tandemly repeated loci (such as the ENA and HXT6/7 genes) show copy number variation, whereby one or more of the copies within the locus has been deleted. Expansion of the HXT6/7 locus is selected for under glucose limitation (Brown et al. 1998; Kao and Sherlock 2008), yet is maladaptive under high-glucose levels, sometimes resulting in its contraction, an example of antagonistic pleiotropy (Wenger et al. 2011). Thus, its reduction in some strains that experience extremely high glucose concentrations (such as wine and fuel strains) may have been selected for.
Principal component analysis (PCA)
Unscaled PCA showed that non-wine strains were mostly separated from the wine strains by the second principal component, showing that apparently there are patterns aCGH identified by PCA that are shared by non-wine strains, while the wine strains generally show more variation. However, no distinct clustering was found, based either on (1) commercial vs. “wild” wine isolates, (2) subgroups identified by aCGH hierarchical clustering, e.g., the PDM group or the “bread-like” wine group, or (3) by geographical origin. The probes that contributed most to the second principal component can give some idea of the important genome regions that are responsible for separating the wine strains from the non-wine. Among these genes are NFT1, FLO1, AAD6, and AGP3 (present in most wine strains but absent in most non-wine strains), in contrast to Ty3 and Ty4 transposons, and the VTH, IMA, and some HXT genes (present in most non-wine strains, but absent in most wine strains); all of these genes have functions of potential interest and import for the various industrial environments.
Overall, our results show that there are patterns of copy number variation that are shared by wine yeasts that distinguish them from non-wine yeasts. However, unlike previous studies showing relatedness of wine strains from various geographical regions, such Legras et al. (2007), our aCGH results, either by hierarchical clustering or PCA analysis, do not separate the wine strains by geography; this may be because most of the wine strains we examined are commercially produced and oftentimes their provenance is not specifically known. It is likely that since the majority of the copy number variation we see occurs at subtelomeres, the genome plasticity in these regions is rapid enough to obscure phylogenetic relationships. Alternatively, or in addition, there may have been mating between the progenitors of many of these strains. Regions of introgression in the wine yeasts may reflect episodes of selection for non-cerevisiae DNA such as foam production (AWA1 gene) or detoxification (epoxide hydrolase).
Our analyses show that the PDM family may be somewhat intermediary in relationship between non-wine and wine strains. Our inability to discern distinct and separated clusters of wine strains—which essentially exist upon a continuum (except the PDM family) using PCA—coupled with the different groupings we observe when clustering subsets of our data indicates the majority of these strains are likely intermixed, presumably by mating. The fact that the PDMs lie at one extreme of this continuum suggests that they may be one of the ancestral populations for wine yeast strains.
The outstanding question is: What does it mean that there is essentially a pool of common CNVs that are largely independently distributed throughout the strains? Two possibilities exist: one is that the CNVs represent convergent evolution, and the second, which we favor, is that there has been a large amount of mixing of genetic material between strains. Are most yeast, or at least wine yeast, akin to admixed human populations, and if so, what are the features of the populations that have been admixed, when were they admixed, and were such outcrossings directed by humans deliberately, or do conditions in the winery, where there is an abundance of yeast, favor such outcomes? Whole-genome sequencing of many different yeast strains isolated from as many geographic and ecological contexts as possible will be the only way to conclusively answer these questions as well as provide a clearer picture of the S. cerevisiae pan-genome in particular, and the pan-genome of the Saccharomyces genus in general.
Methods
Strains used
Sixty-nine wine yeast strains were purchased from commercial suppliers; we used single colony isolates of these strains for all subsequent studies (Table 1). An additional set of 14 yeast strains (including “wild” or “native” wine strains, as well as other strains from a variety of non-wine environments and geographical locations) were obtained from various sources (Table 1); again, single colony isolates were used for all studies. Supplemental Table 2 displays a list of the 41 previously sequenced S. cerevisiae strains and the six other sequenced Saccharomyces species that were used to design the multispecies microarray, and also used as components of the reference DNA pool for the aCGH studies as described below.
Ploidy determination by flow cytometry
A single colony from each of the 69 wine yeast strains, as well as from each of four S. cerevisiae S288c-based ploidy control strains (haploid, diploid, triploid, and tetraploid; PY3295, PY4993, PY4997, PY4996, respectively, from Storchová et al. 2006), was inoculated into 600 μL of YPD in a sterile deep-well 96-well plate, and allowed to sit overnight at 25°C with no shaking; cells were pelleted by centrifuging the plate at 1600 rpm for 5 min at 25°C. Cells were then washed with 600 μL of sterile dH20 and pelleted by centrifugation as above. The supernatant was pipetted off, and 600 μL of 70% ethanol was added to the cells, mixed thoroughly, then incubated at 25°C for 1 h to permeabilze the cell membranes. The cells were washed with 600 μL of dH20 and pelleted; the cell pellet was suspended in 300 μL of 10 mM Tris-HCl (pH 8.0), 0.1 mM EDTA (pH 8.0), 250 ng/mL of Rnase, and incubated at 37°C overnight (∼16 h). The cell pellets were washed and pelleted twice, as above, using 300 μL of dH20; after the second wash, the cell pellets were suspended in 300 μL of 10 mM Tris-HCl (pH 8.0), 0.1 mM EDTA (pH 8.0), 16 μg/mL of Propidium Iodide, and incubated at 25°C for 2.5 h; 200 μL of the stained cells were transferred to a U-bottom microtiter plate and run with an LSR-II flow cytometer (BectonDickinson) using a 488-nm laser and the manufacturer's recommended settings for detection of propidium iodide. Ploidy was determined by comparison with the S. cerevisiae known ploidy controls.
Multispecies microarray design
“Non-S288c” S. cerevisiae sequences were identified in the genomes of the 41 non-S288c S. cerevisiae strains listed in Supplemental Table 2 by comparing all of the sequence reads for each sequenced yeast genome to the assembled S288c genome. Those reads that did not match the S288c genome (>90% identity over 90% of the read's length) were then mapped back to the assembly of the genome from which they came, to define a region of interest. All regions of interest from a given strain were then combined (reads that overlapped would produce a larger region of interest). All non-S288c like regions from all strains were then compared with one another using BLAST, and consolidated into a set of nonredundant sequences. Probes to detect DNA copy number for genomic regions, including the mitochondria and 2-μm circle of the S. cerevisiae lab strain, S288c, as well as for the “novel” S. cerevisiae sequences found as described above, and for the six other Saccharomyces species, were designed using ArrayOligoSelector (Bozdech et al. 2003). Briefly, the sequence chromosome or contigs were split into 1-kb fragments, with each fragment overlapping the previous one by 500 bp. ArrayOligoSelector was then used to find two 60-mer oligonucleotides for each fragment using a combined file of the all species genomes and contigs as a mask, such that chosen oligonucleotides would not have significant cross-hybridization potential. As a subsequent check, all selected oligonucleotides were then compared with this combined file, using BLAST (Altschul et al. 1990), and any oligonucleotides showing significant similarity to regions of any genome other than that for which they were chosen to represent were discarded. From the remaining oligonucleotides, the ones with the most negative ΔG were chosen preferentially, with the aim of having ∼5000 oligonucleotides each for the non-cerevisiae Saccharomyces species, as evenly spaced as possible, and the goal of having ∼25,000 evenly spaced oligonucleotides for the S. cerevisiae genome, including the “novel” non-S288c regions. The final array design included the following content: 25,006 S. cerevisiae S288c probes, 996 S. cerevisiae non-S288c probes, 5607 S. uvarum probes, 5984 S. castelli probes, 6457 S. kluyveri probes, 5497 S. kudriavzevii probes, 5496 S. mikatae probes, and 4784 S. paradoxus probes. Custom microarrays containing the final oligonucleotide set were manufactured by Agilent Technologies.
aCGH protocol using multispecies arrays
Creating a “reference sample” DNA pool
We created a multispecies reference sample by pooling genomic DNA made from the 47 yeast strains (41 cerevisiae and six non-cerevisiae) used to design our multispecies microarrays; these strains are listed in Supplemental Table 2. For each of the six non-cerevisiae Saccharomyces species, genomic DNA was isolated from 50 mL of YPD late-log cells (grown at 25°C) using Qiagen Genomic G100-tips according to the manufacturer's instructions (Qiagen) and then sonicated to an average size of 500–1000 bp. For the S. cerevisiae strains, a 96-well deep-well plate was set up with 1 mL of YPD in each well, and two wells (2 mL total) were inoculated for each of the 41 S. cerevisiae strains. The plate was incubated at 25°C, without shaking, for 4 d, after which the entire contents were poured into a beaker; the plate wells were rinsed with fresh YPD and poured into the beaker, and the mixture was prepared as a single genomic DNA isolation using Qiagen Genomic G-100 tips, followed by sonication, as described above for the non-cerevisiae species. After quantitation of the DNA amounts for each of the six non-cerevisiae species and for the S. cerevisiae strain pool, we mixed equivalent microgram amounts of genomic DNA prepared from the seven different species to make our final reference pool. Because the 41 S. cerevisiae strains can be thought of as one species with regard to the set of probes to which they are able to hybridize, while each of the six non-cerevisiae species is expected to hybridize only to its own set of probes, we adjusted the amount of DNA for all 41 S. cerevisiae strains taken together to be approximately equal to the amount of DNA for each of the single other species. This approach gave a pool with essentially equimolar amounts of each species' genome, because the haploid genome sizes of all seven Saccharomyces species are very similar (Vaughan-Martini et al. 1993). As a test, the reference sample pool was labeled and hybridized in both single color (Cy3 dye label only) and “self-self hybridization” two-color (Cy3 and Cy5) control experiments; as expected, the pool gave robust hybridization signals for almost every spot on the microarray and was therefore used as the “reference” sample for all subsequent experiments (data not shown). We further tested our multispecies microarray by labeling each of the six non-cerevisiae Saccharomyces species separately with Cy5 and then cohybridized with the Cy3-labeled reference sample, and did likewise with the pool of 41 S. cerevisiae strains; the results showed that the vast majority of probes uniquely hybridized to the correct species (data not shown).
Experimental strain DNA extractions
Genomic DNA for each of the 83 individual experimental strains (69 commercial wine and 14 non-wine and “wild” wine strains) (see Table 1) was prepared with YeaStar columns (Zymo Research), and then cut with HaeIII (New England Biolabs). For three of the commercial wine strains (BGY, BDX, and N96), we performed biological replicate microarray hybridizations (i.e., using separate DNA extractions from cells grown from the same frozen stock); the data shown for these strains are averaged values for the hybridization intensities from the two array hybridization experiments.
aCGH and hierarchical clustering
Two-color aCGH was performed using the multispecies microarrays described above. After isolation and cutting, 100–150 ng of DNA from a single experimental strain was directly labeled with fluorescently tagged Cy5-dCTP (Perkin-Elmer), using one-half reactions of the BioPrime random-prime labeling system (Invitrogen); likewise, 100–150 ng of the sonicated reference pool was labeled with Cy3-dCTP. After labeling was complete, the reactions were stopped with the BioPrime “Stop Solution”, and the Cy5- and Cy3-labeled DNAs were mixed together, then purified away from an unincorporated label using Zymo Clean&Concentrate-5 columns (Zymo Research), eluting in 18 μL of (10 mM Tris pH 7.5 + 0.1 mM EDTA). Next, 4.5 μL of Agilent 10X Blocking solution and 22.5 μL of Agilent 2X CGH Hybridization Buffer were added to the purified sample for a total of 45 μL; the mixture was then incubated at 95°C for 3 min and then at 37°C for 30 min. Hybridization to the Agilent microarrays and subsequent washing was done according to the aCGH protocol by Agilent Technologies with the following changes: Arrays were hybridized at 62°C for 48 h, with rotation at 16 rpm, then washed with Agilent Oligo aCGH Wash Buffer 1 (at RT) for 5 min, Agilent Oligo aCGH Wash Buffer 2 (at RT) for 1 min, then Agilent Stabilization and Drying Solution (at RT) for 30 sec. Arrays were scanned with the Agilent microarray scanner and the data were analyzed with Agilent's “Feature Extraction” software. All raw and normalized microarray data have also been deposited in GEO (Barrett et al. 2009) under accession number GSE26689. For all analyses, the data were filtered by excluding automatically flagged spots or spots for which the green channel's net intensity was not “positive and significant” according to the Agilent software; this filtering was fairly permissive in order to allow truly deleted genes (i.e., no red signal at all) to be detected. To determine the relatedness among strains, microarray data were clustered in SMD (Demeter et al. 2007), which uses XCluster, using the Pearson correlation as the metric of similarity.
Principal component analysis (PCA)
Starting with the set of aCGH log10 data for all 83 experimental strains for all S. cerevisiae probes (S288c and non-S288c probes), we calculated standard deviations for each probe across all strains and selected those that gave a value ≥0.5. Independently, we took the same initial data set and calculated the difference in log10 value between the highest and lowest value, and took those that gave a value ≥3.0; we took the union of both groups, resulting in a set of 1119 “most variable” probes. We then used this data set as the basis for performing unscaled principal component analysis (PCA), using the “prcomp” function in the R statistics package (http://www.stat.psu.edu/∼dhunter/R/html/utils/html/citation.html).
CNV validation by Illumina sequencing
Library construction:
Genomic DNA was isolated from 10–20 mL of YPD-grown cells using Qiagen Genomic-tip 100/G columns as described by the manufacturer. Libraries for paired-end Illumina HiSeq 2000 sequencing were prepared as follows. Twelve pairs of Illumina adapters (for paired-end sequencing; purchased from Integrated DNA Technologies), with each pair containing a different 6-bp barcode, were pre-annealed in a 50-μL reaction containing 1x T4 DNA ligase buffer (NEB #B0202S). Each of the two adapters for a given barcode were present at 40 μM; annealing conditions were 94°C for 5 min, then 70°C, 60°C, 50°C, 40°C, 30°C, and 25°C, each for 1 min. A total of 3–5 μg of genomic DNA were sheared to ∼500 bp in a COVARIS sonicator; 1.5–2 μg of the sheared DNA was end repaired in a 50-μL reaction (1× T4 DNA ligase buffer, 0.8 μM dNTPs [NEB #N0447S], using 2.5 μL of T4 DNA polymerase [NEB #M0203L], 0.5 μL Klenow [large fragment] [NEB #M0210L], and 2.5 μL of T4 PNK [NEB #M0201L], with incubation at 20°C for 30 min. End-repaired DNA was purified using a Qiaquick PCR purification column, eluting in 33 μL of buffer EB. Addition of a dATP to end-repaired DNA was performed by incubation at 37°C for 30 min; 32 μL of end-repaired DNA, 5 μL of Buffer 2 [NEB #B7002S], 1 μL 10mM dATP [Invitrogen #18252-015], 3 μL Klenow Exo- Fragment [NEB #M0212L]). Reactions were then purified using a Qiagen MinElute column, eluting in 11 μL of buffer EB. Illumina adapter ligation was performed in a 20-μL reaction by incubation at 20°C for 15 min, followed by 65°C for 10 min (10 μL of DNA from previous step, 1× T4 DNA ligase buffer, 1 μL of T4 DNA ligase (NEB # M0202S), 1 μL of 40-μM pre-annealed adapter mix). Following adapter ligation, size selection was performed on the Invitrogen E-gel system, targeting 600-bp fragments. Following size selection, the library was amplified using PCR in a 20-μL reaction (1.25 μM Illumina primers PE1 and PE2 purchased from Integrated DNA Technologies, 2–4 μL of size-selected DNA, 0.25 μM dNTPs, 1× HF Buffer, and 0.5 μL of Phusion DNA polymerase [NEB #F-530L]). DNA was amplified using the following program: 98°C for 30 sec; 12 cycles of 98°C for 10 sec, 65°C for 30 sec, and 72°C for 30 sec; and a final 72°C extension time of 5 min. The amplified library was purified over a Qiaquick PCR purification column, eluting in a final volume of 30 μL of Buffer EB. Library concentrations and size estimates were determined using Qubit (Invitrogen) and Bioanalyzer (Agilent). Equimolar amounts of each library, based on Qubit and/or Bioanalyzer results, were mixed together (typically a complete set of 12 libraries, each with a different barcode, is mixed together); concentration and size estimates of the mixed library preparation were again determined by Qubit and Bioanalyzer. The mixed library preparation was loaded onto one lane of a paired-end flow cell for the Illumina HiSeq 2000 platform (flow cells were prepared according to the manufacturer's instructions) and sequencing was performed for 100 cycles.
Data analysis
The FASTQ data file was first split into strain-specific files by barcode using the program fastx_barcode_splitter.pl from the FASTX-Toolkit, which was modified to handle paired-end data. For each strain, all reads that passed Illumina filters were mapped to the S288c reference sequence from the Saccharomyces Genome Database (downloaded 2/24/2011), plus additional non-S288c contigs (see above) with Stampy v1.0.13_r1157 (Lunter and Goodson 2011) calling BWA v0.5.9-r16 (Li and Durbin 2009) using default settings, except a substitution rate of 0.008 for Stampy and –q 10 for BWA. PCR duplicates were marked with Picard v1.45, and realignment around indels and base-quality score recalibration were done with the Genome Analysis Toolkit (GATK) v1.0.5777 (McKenna et al. 2010). Per-base coverage was calculated with GATK DepthOfCoverage with options –mbq 4 and –mmq 0. A chromosome mean-centered log2 ratio was calculated between each strain and the median coverage of all nine sequenced strains. For this analysis, the coverage of 10-bp segments across the genome was averaged for each sample before the log2 ratio was calculated. These data were plotted for each putative CNV along with a running median to identify trends. To verify regions that were deleted, the absolute coverage averaged into 10-bp segments was also plotted for each putative CNV.
Validation of introgressions
The same Illumina data used for the CNV validation was also used to validate introgressions from either S. paradoxus or S. mikatae. Reads were mapped to a reference sequence containing S. cerevisiae S288c and a non-S288c sequence as well as the full-genome sequence from either S. paradoxus or S. mikatae (Scannell et al. 2011) using BWA-short with options –q 10 –n 1 –k 1. We used this hybrid reference sequence to map reads to regions that are orthologous but differ between the two genomes enough to allow correct mapping to the actual genome of origin. Coverage of the uniquely mapping reads was calculated with GATK DepthOfCoverage with options –mbq 4 –mmq 20. Only uniquely mapping reads were used. The absolute coverage of the putative introgressed regions was plotted with a running median.
Validation of introgression sites and copy number changes by PCR
We designed flanking primers for two of the S. paradoxus introgressions and for one amplified region and two deleted regions within the S. cerevisiae genome (Supplemental Table 3); we used half-sized reactions with the LongRange PCR kit (Qiagen) to perform PCR. Introgressions were detected as occurring if a product was seen when using a S. cerevisiae and a S. paradoxus primer pair; the amplification and deletions were detected as altered band sizes.
Data access
The microarray data underlying this manuscript have been annotated in a MIAME compliant fashion and have been submitted to the NCBI Gene Expression Omnibus (GEO) (http://www.ncbi.nlm.nih.gov/geo/) under accession no. GSE26689. The Illumina sequence data for the strains that we sequenced have been submitted to the NCBI Sequence Read Archive (SRA) (http://trace.ncbi.nlm.nih.gov/Traces/sra/sra.cgi) under accession no. SRA049752.
Acknowledgments
We thank the laboratory of David Pellman and all of the researchers listed in Table 1 for their generous donations of strains; Eric Baugher and Ridge Vineyards for allowing strain isolation from their winery; Laurie Winslow, Ivonne Dresser, and Jessica Parsons for technical assistance; Omar Cornejo for help with PCA analyses and helpful discussions; Sean Myles for helpful discussions; and Jared Wenger for critical reading of the manuscript. This work was funded by the E. & J. Gallo Winery.
Footnotes
[Supplemental material is available for this article.]
Article published online before print. Article, supplemental material, and publication date are at http://www.genome.org/cgi/doi/10.1101/gr.130310.111.
References
- Altschul SF, Gish W, Miller W, Myers EW, Lipman DJ 1990. Basic local alignment search tool. J Mol Biol 215: 403–410 [DOI] [PubMed] [Google Scholar]
- Ames RM, Rash BM, Hentges KE, Robertson DL, Delneri D, Lovell SC 2010. Gene duplication and environmental adaptation within yeast populations. Genome Biol Evol 2: 591–601 [DOI] [PMC free article] [PubMed] [Google Scholar]
- Awad IA, Rees CA, Hernandez-Boussard T, Ball CA, Sherlock G 2004. Caryoscope: An Open Source Java application for viewing microarray data in a genomic context. BMC Bioinformatics 5: 151 doi: 10.1186/1471-2105-5-151 [DOI] [PMC free article] [PubMed] [Google Scholar]
- Ayoub M-J, Legras J-L, Saliba R, Gaillardin C 2006. Application of Multi Locus Sequence Typing to the analysis of the biodiversity of indigenous Saccharomyces cerevisiae wine yeasts from Lebanon. J Appl Microbiol 100: 699–711 [DOI] [PubMed] [Google Scholar]
- Barrett T, Troup DB, Wilhite SE, Ledoux P, Rudnev D, Evangelista C, Kim IF, Soboleva A, Tomashevsky M, Marshall KA, et al. 2009. NCBI GEO: archive for high-throughput functional genomic data. Nucleic Acids Res 37: D885–D890 [DOI] [PMC free article] [PubMed] [Google Scholar]
- Barrio E, González SS, Arias A, Belloch C, Querol A 2006. Molecular mechanisms involved in the adaptive evolution of industrial yeasts. In The yeast handbook vol. 2: Yeasts in food and beverages (ed. A Querol and GH Fleet), pp. 153–174. Springer Verlag, Germany [Google Scholar]
- Borneman AR, Forgan AH, Pretorius IS, Chambers PJ 2008. Comparative genome analysis of a Saccharomyces cerevisiae wine strain. FEM Yeast Res 8: 1185–1195 [DOI] [PubMed] [Google Scholar]
- Borneman AR, Desany BA, Riches D, Affourtit JP, Forgan AH, Pretorius IS, Egholm M, Chambers PJ 2011a. Whole-genome comparison reveals novel genetic elements that characterize the genome of industrial strains of Saccharomyces cerevisiae. PLoS Genet 7: e1001287 doi: 10.1371/journal.pgen.1001287 [DOI] [PMC free article] [PubMed] [Google Scholar]
- Borneman AR, Desany BA, Riches D, Affourtit JP, Forgan AH, Pretorius IS, Egholm M, Chambers PJ 2011b. The genome sequence of the wine yeast VIN7 reveals an allotriploid hybrid genome with Saccharomyces cerevisiae and Saccharomyces kudriavzevii origins. FEM Yeast Res. doi: 10.1111/j.1567-1364.2011.00773.x [DOI] [PubMed] [Google Scholar]
- Bozdech Z, Zhu J, Joachimiak MP, Cohen FE, Pulliam B, DeRisi JL 2003. Expression profiling of the schizont and trophozoite stages of Plasmodium falciparum with a long-oligonucleotide microarray. Genome Biol 4: R9 doi: 10.1186/gb-2003-4-2-r9 [DOI] [PMC free article] [PubMed] [Google Scholar]
- Bradbury JE, Richards KD, Niederer HA, Lee SA, Rod Dunbar P, Gardner RC 2006. A homozygous diploid subset of commercial wine yeast strains. Antonie van Leeuwenhoek 89: 27–37 [DOI] [PubMed] [Google Scholar]
- Brown CJ, Todd KM, Rosenzweig RF 1998. Multiple duplications of yeast hexose transport genes in response to selection in a glucose-limited environment. Mol Biol Evol 15: 931–942 [DOI] [PubMed] [Google Scholar]
- Brown SL, Stockdale VJ, Pettolino F, Pocock KF, de Barro Lopes M, Williams PJ, Bacic A, Fincher GB, Høj PB, Waters EJ 2007. Reducing haziness in white wine by overexpression of Saccharomyces cerevisiae genes YOL155c and YDR055w. Appl Microbiol Biotechnol 73: 1363–1376 [DOI] [PubMed] [Google Scholar]
- Brown C, Murray A, Verstrepen K 2010. Rapid expansion and functional divergence of subtelomeric gene families in yeasts. Curr Biol 20: 895–903 [DOI] [PMC free article] [PubMed] [Google Scholar]
- Carreto L, Eiriz MF, Gomes AC, Pereira PM, Schuller D, Santos MAS 2008. Comparative genomics of wild type yeast strains unveils important genome diversity. BMC Genomics 9: 524 doi: 10.1186/1471-2164-9-524 [DOI] [PMC free article] [PubMed] [Google Scholar]
- Cavalieri D, McGovern PE, Hartl DL, Mortimer R, Polsinelli M 2003. Evidence for S. cerevisiae fermentation in ancient wine. J Mol Evol 57: S226–S232 [DOI] [PubMed] [Google Scholar]
- de Barros Lopes M, Bellon JR, Shirley NJ, Ganter PF 2002. Evidence for multiple interspecific hybridization in Saccharomyces sensu stricto species. FEM Yeast Res 1: 323–331 [DOI] [PubMed] [Google Scholar]
- Demeter J, Beauheim C, Gollub J, Hernandez-Boussard T, Jin H, Maier D, Matese JC, Nitzberg M, Wymore F, Zachariah ZK, et al. 2007. The Stanford Microarray Database: implementation of new analysis tools and open source release of software. Nucleic Acids Res 35: D766–D770 [DOI] [PMC free article] [PubMed] [Google Scholar]
- Doniger SW, Kim HS, Swain D, Corcuera D, Williams M, Yang S-P, Fay JC 2008. A catalog of neutral and deleterious polymorphism in yeast. PLoS Genet 4: e1000183 doi: 10.1371/journal.pgen.1000183 [DOI] [PMC free article] [PubMed] [Google Scholar]
- Dujon B 2010. Yeast evolutionary genomics. Nat Rev Genet 11: 512–524 [DOI] [PubMed] [Google Scholar]
- Dunham MJ, Badrane H, Ferea T, Adams J, Brown PO, Rosenzweig F, Botstein D 2002. Characteristic genome rearrangements in experimental evolution of Saccharomyces cerevisiae. Proc Natl Acad Sci 99: 16144–16149 [DOI] [PMC free article] [PubMed] [Google Scholar]
- Dunn B, Levine RP, Sherlock G 2005. Microarray karyotyping of commercial wine yeast strains reveals shared, as well as unique, genomic signatures. BMC Genomics 6: 53 doi: 10.1186/1471-2164-6-53 [DOI] [PMC free article] [PubMed] [Google Scholar]
- Esberg A, Muller LAH, McCusker JH 2011. Genomic structure of and genome-wide recombination in the Saccharomyces cerevisiae S288C progenitor isolate EM93. PLoS ONE 6: e25211 doi: 10.1371/journal.pone.0025211 [DOI] [PMC free article] [PubMed] [Google Scholar]
- Falcon AA, Rios N, Aris JP 2005. 2-micron circle plasmids do not reduce yeast life span. FEMS Microbiol Lett 250: 245–251 [DOI] [PMC free article] [PubMed] [Google Scholar]
- Farrell AE, Plevin RJ, Turner BT, Jones AD, O'Hare M, Kammen DM 2006. Ethanol can contribute to energy and environmental goals. Science 311: 506–508 [DOI] [PubMed] [Google Scholar]
- Fay JC, Benavides JA 2005a. Evidence for domesticated and wild populations of Saccharomyces cerevisiae. PLoS Genet 1: 66–71 [DOI] [PMC free article] [PubMed] [Google Scholar]
- Fay JC, Benavides JA 2005b. Hypervariable noncoding sequences in Saccharomyces cerevisiae. Genetics 170: 1575–1587 [DOI] [PMC free article] [PubMed] [Google Scholar]
- Franco-Duarte R, Umek L, Zupan B, Schuller D 2009. Computational approaches for the genetic and phenotypic characterization of a Saccharomyces cerevisiae wine yeast collection. Yeast 26: 675–692 [DOI] [PubMed] [Google Scholar]
- Fogel S, Welch JW 1982. Tandem gene amplification mediates copper resistance in yeast. Proc Natl Acad Sci 79: 5342–5346 [DOI] [PMC free article] [PubMed] [Google Scholar]
- Futcher AB 1988. The 2 μm Circle Plasmid of Saccharomyces cerevisiae. Yeast 4: 27–40 [DOI] [PubMed] [Google Scholar]
- Goddard MR, Anfang N, Tang R, Gardner RC, Jun C 2010. A distinct population of Saccharomyces cerevisiae in New Zealand: evidence for local dispersal by insects and human-aided global dispersal in oak barrels. Environ Microbiol 12: 63–73 [DOI] [PubMed] [Google Scholar]
- Gonzalez SS, Barrio E, Querol A 2008. Molecular characterization of new natural hybrids between Saccharomyces cerevisiae and Saccharomyces kudriavzevii from brewing. Appl Environ Microbiol 74: 2314–2320 [DOI] [PMC free article] [PubMed] [Google Scholar]
- Hall C, Brachat S, Dietrich FS 2005. Contribution of horizontal gene transfer to the evolution of Saccharomyces cerevisiae. Eukaryot Cell 4: 1102–1115 [DOI] [PMC free article] [PubMed] [Google Scholar]
- Haugen P, Simon DM, Bhattacharya D 2005. The natural history of group I introns. Trends Genet 21: 111–119 [DOI] [PubMed] [Google Scholar]
- Infante JJ, Dombek KM, Rebordinos L, Cantoral JM, Young ET 2003. Genome-wide amplifications caused by chromosomal rearrangements play a major role in the adaptive evolution of natural yeast. Genetics 165: 1745–1759 [DOI] [PMC free article] [PubMed] [Google Scholar]
- Kao KC, Sherlock G 2008. Molecular characterization of clonal interference during adaptive evolution in asexual populations of Saccharomyces cerevisiae. Nat Genet 40: 1499–1504 [DOI] [PMC free article] [PubMed] [Google Scholar]
- Kvitek DJ, Will JL, Gasch AP 2008. Variations in stress sensitivity and genomic expression in diverse S. cerevisiae isolates. PLoS Genet 4: e1000223 doi: 10.1371/journal.pgen.1000223 [DOI] [PMC free article] [PubMed] [Google Scholar]
- Legras J-L, Ruh O, Merdinoglu D, Karst F 2005. Selection of hypervariable microsatellite loci for the characterization of Saccharomyces cerevisiae strains. Int J Food Microbiol 102: 73–83 [DOI] [PubMed] [Google Scholar]
- Legras J-L, Merdinoglu D, Cornuet J-M, Karst F 2007. Bread, beer and wine: Saccharomyces cerevisiae diversity reflects human history. Mol Ecol 16: 2091–2102 [DOI] [PubMed] [Google Scholar]
- Li H, Durbin R 2009. Fast and accurate short read alignment with Burrows-Wheeler transform. Bioinformatics 25: 1754–1760 [DOI] [PMC free article] [PubMed] [Google Scholar]
- Libkind D, Hittinger CT, Valério E, Gonçalves C, Dover J, Johnston M, Gonçalves P, Sampaio JP 2011. Microbe domestication and the identification of the wild genetic stock of lager-brewing yeast. Proc Natl Acad Sci 108: 14539–14544 [DOI] [PMC free article] [PubMed] [Google Scholar]
- Liti G, Louis EJ 2005. Yeast evolution and comparative genomics. Annu Rev Microbiol 59: 135–153 [DOI] [PubMed] [Google Scholar]
- Liti G, Peruffo A, James SA, Roberts IN, Louis EJ 2005. Inferences of evolutionary relationships from a population survey of LTR-retrotransposons and telomeric-associated sequences in the Saccharomyces sensu stricto complex. Yeast 22: 177–192 [DOI] [PubMed] [Google Scholar]
- Liti G, Barton DBH, Louis EJ 2006. Sequence diversity, reproductive isolation and species concepts in Saccharomyces. Genetics 174: 839–850 [DOI] [PMC free article] [PubMed] [Google Scholar]
- Liti G, Carter DM, Moses AM, Warringer J, Parts L, James SA, Davey RP, Roberts IN, Burt A, Koufopanou V, et al. 2009. Population genomics of domestic and wild yeasts. Nature 458: 337–341 [DOI] [PMC free article] [PubMed] [Google Scholar]
- Lunter G, Goodson M 2011. Stampy: a statistical algorithm for sensitive and fast mapping of Illumina sequence reads. Genome Res 21: 936–939 [DOI] [PMC free article] [PubMed] [Google Scholar]
- Masneuf I, Hansen J, Groth C, Piskur J, Dubourdieu D 1998. New hybrids between Saccharomyces sensu stricto yeast species found among wine and cider production strains. Appl Environ Microbiol 64: 3887–3892 [DOI] [PMC free article] [PubMed] [Google Scholar]
- McGovern PE, Hartung U, Badler VR, Glusker DL, Exner LJ 1997. The beginnings of winemaking and viniculture in the ancient Near East and Egypt. Expedition 39: 3–21 [Google Scholar]
- McGovern PE, Zhang J, Tang J, Zhang Z, Hall GR, Moreau RA, Nuñez A, Butrym ED, Richards MP, Wang C-S, et al. 2004. Fermented beverages of pre- and proto-historic China. Proc Natl Acad Sci 101: 17593–17598 [DOI] [PMC free article] [PubMed] [Google Scholar]
- McKenna A, Hanna M, Banks E, Sivachenko A, Cibulskis K, Kernytsky A, Garimella K, Altshuler D, Gabriel S, Daly M, et al. 2010. The Genome Analysis Toolkit: a MapReduce framework for analyzing next-generation DNA sequencing data. Genome Res 20: 1297–1303 [DOI] [PMC free article] [PubMed] [Google Scholar]
- Miyashita K, Sakamoto K, Kitagaki H, Iwashita K, Ito K, Shimoi H 2004. Cloning and analysis of the AWA1 gene of a nonfoaming mutant of a sake yeast. J Biosci Bioeng 97: 14–18 [DOI] [PubMed] [Google Scholar]
- Moran JV, Wemette CM, Mecklenburg KL, Butow RA, Perlman PS 1992. Intron 5a of the COXI gene of yeast mitochondrial DNA is a mobile group I intron. Nucleic Acids Res 15: 4069–4076 [DOI] [PMC free article] [PubMed] [Google Scholar]
- Mukai N, Masaki K, Fujii T, Kawamukai M, Iefuji H 2010. PAD1 and FDC1 are essential for the decarboxylation of phenylacrylic acids in Saccharomyces cerevisiae. J Biosci Bioeng 109: 564–569 [DOI] [PubMed] [Google Scholar]
- Muller LAH, McCusker JH 2009a. A multispecies-based taxonomic microarray reveals interspecies hybridization and introgression in Saccharomyces cerevisiae. FEM Yeast Res 9: 143–152 [DOI] [PMC free article] [PubMed] [Google Scholar]
- Muller LAH, McCusker JH 2009b. Microsatellite analysis of genetic diversity among clinical and nonclinical Saccharomyces cerevisiae isolates suggests heterozygote advantage in clinical environments. Mol Ecol 18: 2779–2786 [DOI] [PMC free article] [PubMed] [Google Scholar]
- Naumova ES, Naumov GI, Masneuf-Pomarede I, Aigle M, Dubourdieu D 2005. Molecular genetic study of introgression between Saccharomyces bayanus and S. cerevisiae. Yeast 22: 1099–1115 [DOI] [PubMed] [Google Scholar]
- Naumova ES, Naumov GI, Michailova YV, Martynenko NN, Masneuf-Pomarède I 2011. Genetic diversity study of the yeast Saccharomyces bayanus var. uvarum reveals introgressed subtelomeric Saccharomyces cerevisiae genes. Res Microbiol 162: 204–213 [DOI] [PubMed] [Google Scholar]
- Novo M, Bigey F, Beyne E, Galeote V, Gavory F, Mallet S, Cambona B, Legras J-L, Wincker P, Casaregola S, et al. 2009. Eukaryote-to-eukaryote gene transfer events revealed by the genome sequence of the wine yeast Saccharomyces cerevisiae EC1118. Proc Natl Acad Sci 106: 16333–16338 [DOI] [PMC free article] [PubMed] [Google Scholar]
- Pérez-Ortín JE, García-Martínez J, Alberola TM 2002. DNA chips for yeast biotechnology. The case of wine yeasts. J Biotechnol 98: 227–241 [DOI] [PubMed] [Google Scholar]
- Querol A, Bond U 2009. The complex and dynamic genomes of industrial yeasts. FEMS Microbiol Lett 293: 1–10 [DOI] [PubMed] [Google Scholar]
- Querol A, Barrio E, Huerta T, Ramon D 1992. Molecular monitoring of wine fermentations conducted by active dry yeast strains. Appl Environ Microbiol 58: 2948–2953 [DOI] [PMC free article] [PubMed] [Google Scholar]
- Rainieri S, Kodama Y, Kaneko Y, Mikata K, Nakao Y, Ashikari T 2006. Pure and mixed genetic lines of Saccharomyces bayanus and Saccharomyces pastorianus and their contribution to the lager brewing strain genome. Appl Environ Microbiol 72: 3968–3974 [DOI] [PMC free article] [PubMed] [Google Scholar]
- Richard G-F, Dujon B 2006. Molecular evolution of minisatellites in hemiascomycetous yeasts. Mol Biol Evol 23: 189–202 [DOI] [PubMed] [Google Scholar]
- Richards KD, Goddard MR, Gardner RC 2009. A database of microsatellite genotypes for Saccharomyces cerevisiae. Antonie van Leeuwenhoek 96: 355–359 [DOI] [PubMed] [Google Scholar]
- Rolland T, Neuvéglise C, Sacerdot C, Dujon B 2009. Insertion of horizontally transferred genes within conserved syntenic regions of yeast genomes. PLoS ONE 4: e6515 doi: 10.1371/journal.pone.0006515 [DOI] [PMC free article] [PubMed] [Google Scholar]
- Rolland T, Dujon B, Richard G-F 2010. Dynamic evolution of megasatellites in yeasts. Nucleic Acids Res 38: 4731–4739 [DOI] [PMC free article] [PubMed] [Google Scholar]
- Sampaio JP, Gonçalves P 2008. Natural populations of Saccharomyces kudriavzevii in Portugal are associated with oak bark and are sympatric with S. cerevisiae and S. paradoxus. Appl Environ Microbiol 74: 2144–2152 [DOI] [PMC free article] [PubMed] [Google Scholar]
- Samuel D 1996. Investigation of ancient Egyptian baking and brewing methods by correlative microscopy. Science 273: 488–490 [DOI] [PubMed] [Google Scholar]
- Scannell DR, Zill OA, Rokas A, Payen C, Dunham MJ, Eisen MB, Rine J, Johnston M, Hittinger CT 2011. The awesome power of yeast evolutionary genetics: New genome sequences and strain resources for the Saccharomyces sensu stricto genus. G3: Genes, Genomes. Genetics 1: 11–25 [DOI] [PMC free article] [PubMed] [Google Scholar]
- Schacherer J, Shapiro JA, Ruderfer DM, Kruglyak L 2009. Comprehensive polymorphism survey elucidates population structure of Saccharomyces cerevisiae. Nature 458: 342–345 [DOI] [PMC free article] [PubMed] [Google Scholar]
- Schuller D, Valero E, Dequin S, Casal M 2004. Survey of molecular methods for the typing of wine yeast strains. FEMS Microbiol Lett 231: 19–26 [DOI] [PubMed] [Google Scholar]
- Sicard D, Legras J-L 2011. Bread, beer and wine: Yeast domestication in the Saccharomyces sensu stricto complex. C R Biol 334: 229–236 [DOI] [PubMed] [Google Scholar]
- Sipiczki M 2008. Interspecies hybridization and recombination in Saccharomyces wine yeasts. FEM Yeast Res 8: 996–1007 [DOI] [PubMed] [Google Scholar]
- Smit MS 2004. Fungal epoxide hydrolases: new landmarks in sequence-activity space. Trends Biotechnol 22: 123–129 [DOI] [PubMed] [Google Scholar]
- Stambuk BU, Dunn B, Alves SL, Duval EH, Sherlock G 2009. Industrial fuel ethanol yeasts contain adaptive copy number changes in genes involved in vitamin B1 and B6 biosynthesis. Genome Res 19: 2271–2278 [DOI] [PMC free article] [PubMed] [Google Scholar]
- Storchová Z, Breneman A, Cande J, Dunn J, Burbank K, O'Toole E, Pellman D 2006. Genome-wide genetic analysis of polyploidy in yeast. Nature 443: 541–547 [DOI] [PubMed] [Google Scholar]
- Tulha J, Lima A, Lucas C, Ferreira C 2010. Saccharomyces cerevisiae glycerol/H+ symporter Stl1p is essential for cold/near-freeze and freeze stress adaptation. A simple recipe with high biotechnological potential is given. Microb Cell Fact 9: 82 doi: 10.1186/1475-2859-9-82 [DOI] [PMC free article] [PubMed] [Google Scholar]
- Vaughan-Martini A, Martini A 1995. Facts, myths and legends on the prime industrial microorganism. J Ind Microbiol 14: 514–522 [DOI] [PubMed] [Google Scholar]
- Vaughan-Martini A, Martini A, Cardinali G 1993. Electrophoretic karyotyping as a taxonomic tool in the genus Saccharomyces. Antonie van Leeuwenhoek 63: 145–156 [DOI] [PubMed] [Google Scholar]
- Vigentini I, Fracassetti D, Picozzi C, Foschino R 2009. Polymorphisms of Saccharomyces cerevisiae genes involved in wine production. Curr Microbiol 58: 211–218 [DOI] [PubMed] [Google Scholar]
- Wei W, McCusker JH, Hyman RW, Jones T, Ning Y, Cao Z, Gu Z, Bruno D, Miranda M, Nguyen M, et al. 2007. Genome sequencing and comparative analysis of Saccharomyces cerevisiae strain YJM789. Proc Natl Acad Sci 104: 12825–12830 [DOI] [PMC free article] [PubMed] [Google Scholar]
- Wenger JW, Piotrowski J, Nagarajan S, Chiotti K, Sherlock G, Rosenzweig F 2011. Hunger artists: yeast adapted to carbon limitation show trade-offs under carbon sufficiency. PLoS Genet 7: e1002202 doi: 10.1371/journal.pgen.1002202 [DOI] [PMC free article] [PubMed] [Google Scholar]
- Winzeler EA, Castillo-Davis CI, Oshiro G, Liang D, Richards DR, Zhou Y, Hartl DL 2003. Genetic diversity in yeast assessed with whole-genome oligonucleotide arrays. Genetics 163: 79–89 [DOI] [PMC free article] [PubMed] [Google Scholar]