

Abstract
Hemozoin (Hz) is released into the blood stream after rupture of infected red blood cells (iRBCs) at the end of each parasite replication cycle. This free Hz is ingested by circulating and resident phagocytes. The presence of Hz in tissues after clearance of infection has been previously reported. Still, little is known about the kinetics of Hz in vivo, during and after Plasmodium infection. It is particularly important to understand Hz kinetics after malaria infections as it has been reported that Hz is associated with impairment of immune functions, including possible consequences for coinfections. Indeed, if Hz remains biologically active for prolonged periods of time inside immunocompetent cells, the potential consequences of such accumulation and presence to the immune system should be clarified. Here, using several independent methods to assess the presence of Hz, we report the long-term in vivo kinetics of Hz in diverse organs in a murine model of malaria infection.
1. Introduction
In malaria, at the end of each Plasmodium replication cycle, infected red blood cells (iRBCs) rupture and release merozoites, together with hemozoin (Hz), into the blood stream. At that stage, up to 80–90% of all haem iron is localized in the digestive food vacuole and more than 95% of this haem has been converted to Hz [1]. On the basis of these findings and other reports, it has been calculated that, on average, 0.2–2 grams of Hz are produced during each erythrocytic cycle, assuming a 1–10% parasitaemia [2, 3].
Hz is ingested by circulating and resident phagocytes. One study investigated the percentage of Hz-containing granulocytes and monocytes in circulation as a predictor of disease outcome [4], while another reported median half-lives of 72 hours for Hz-containing granulocytes and 216 hours for Hz-containing monocytes in circulation [5]. Although the prolonged presence of Hz in tissues of individuals that had suffered from Plasmodium infections has been reported since the 19th century [6, 7], little is known about the long-term kinetics of Hz in vivo.
How and over what period is Hz ultimately eliminated? To our knowledge, only one study in mice tried to address this question using a fluorometric method [8]. This report showed that 70% of Hz disappeared from the liver over 270 days after parasite clearance, while the amount of Hz in the spleen increased 8-fold.
The importance of understanding Hz kinetics lies in the reported effects of Hz in impairment of immunity [9–14], including possible consequences for coinfections, such as tuberculosis [15]. Moreover, if Hz remains biologically active for prolonged periods of time in internal organs, especially liver, spleen, and bone marrow, particularly within immunocompetent cells in these organs, it is important to understand the kinetics of Hz in order to fully address the consequences of such accumulation.
It was recently shown using flow cytometry that the optical characteristics of Hz (birefringency) can be used to reliably detect it, even at the single cell level [16]. The aim of the present study was to investigate the long-term kinetics of Hz in diverse organs of a murine model of malaria using independent methods for Hz detection. We show that Hz can persist in different organs of the rodent host for as long as 196 days after the end of Chloroquine treatment of blood-stage malaria.
2. Material and Methods
2.1. Reagents
All reagents were obtained from Sigma Aldrich (St Louis, MO, USA), unless stated otherwise. Fluorescein isothiocyanate (FITC) or phycoerythrin (PE) labelled antibodies against surface antigens (F4/80-PE, GR-1-PE, CD11b-FITC and Fc-block) were purchased from eBioscience (San Diego, CA, USA). DNAse/RNAse free ultrapure water, phosphate buffer saline (PBS), Fetal Bovine Serum (FBS), HEPES and RPMI 1640 were purchased from Gibco (Grand Island, NY). Percoll was from GE Healthcare (Upsala, Sweden) and ultrapure water was obtained with a Milli-Q purification system (Millipore, Madrid, Spain).
2.2. Mice and Parasites
C57BL/6 female mice (7 weeks old) were purchased from Charles River (Spain). Plasmodium berghei NK65-infected red blood cells (iRBC) were obtained by mouse passage of a frozen vial of infected blood 5 days before infection. Blood was collected by cardiac puncture and the parasitaemia was determined by counting the number of iRBC per 2000 RBC on Giemsa-stained blood smears.
All experiments were performed according to the Instituto de Medicina Molecular Animal Care Committee's approved protocols.
2.3. Infection and Chloroquine Treatment
Mice were infected intraperitoneally (i.p) with 1 × 10⁶ P. berghei NK65 iRBC. Infection was allowed to progress for 14 days during which mice reached high parasitaemias (ranging from 9–49%, average of 26%). Starting at day 14 after infection, mice were treated daily for 8 days with 100 μL intraperitoneal injections of 7 mg/mL Chloroquine (CQ). Absence of parasites on Giemsa stained blood smears was confirmed. Then 2 or 3 mice were sacrificed 7, 90, and 196 days after the end of CQ treatment. Liver, spleen, and bone marrow were extracted and aliquoted for subsequent Hz determinations.
2.4. Histology
Tissue from liver, spleen, or femur bone was fixed in 4% vol/vol paraformaldehyde, sectioned and stained, with Hematoxylin and Eosin (H&E), before microscopic images were taken. Images were taken using the 10× and 40× objective of a Leica DM5000 microscope. Sections were also observed using crossed polarized filters to detect depolarization caused by Hz, as described before [17]. Tissue sections were examined by an experienced microscopist (TH).
2.5. Hemozoin Analysis by Image J
Hz quantification of histological sections was performed by microscopic observation at 400× (Leica DM5000) and acquiring 5 images using a Leica DFC420 camera. Image J software, version 1.46c (US National Institutes of Health), was used to convert each image to 8 bit, which converts colour images to grayscale. The amount of Hz was quantified by setting the image threshold so that all the dark Hz pixels were coloured red. These areas were then measured by Image J and expressed as a percentage of the total area (total number of pixels).
2.6. Hemozoin Analysis by Flow Cytometry
Liver portions were treated with DNase and then mashed through a 100 μm cell strainer. The resulting cell suspension was diluted in RPMI medium with 2% serum to a final volume of 30 mL, washed and the pellet put on a 35% Percoll gradient (in RPMI). The obtained cells were washed again and then labelled for analysis.
The spleen was mashed through a 100 μm cell strainer and resuspended in PBS. The bone marrow was flushed from a femur bone into PBS using an insulin hypodermic needle and resuspended several times with the help of the needle to generate a single cell suspension. Whole blood was obtained by cardiac puncture in the presence of heparin, and washed with PBS.
Single cell suspensions from liver, spleen, and bone marrow were labelled with anti-CD11b-FITC and anti-Gr1-PE (for blood samples) or anti-CD11b-FITC and anti-F4/80-PE (for tissue samples). Erythrocytes were then lysed with 125 μL of BD FACS lysing solution (BD Biosciences, San Jose) prior to analysis. The cells were washed again, resuspended in PBS containing 2% serum and analysed by flow cytometry using a Cyflow blue laser flow-cytometer (Partec, Germany), which had been modified to detect depolarized Side-Scatter as measurement of Hz, as described elsewhere [16].
2.7. Haem Measurement by Colorimetry
A portion of liver, spleen, or bone marrow were mashed and resuspended in PBS. After filtering through a 40 μm cell strainer, lysis buffer (50 mM tris-HCL in triton) was added to this extract. After lysis, 2 μL were used to measure protein content by the Bradford method following the manufacturer's instructions (Bio-Rad, France); 50 μL were converted to haem by dissolution in NaOH and used to determine the amount of Hz, using the QuantiChrom assay kit following manufacturers' instructions (BioAssay Systems, Hayward, CA, USA).
3. Results
All mice included in this study developed infection which reached parasitaemias ranging from 9 to 49% (mean: 26%) after 14 days. All infections were successfully cured with Chloroquine (CQ) treatment (8 consecutive daily treatments), as confirmed by negative blood smears. Mice were sacrificed at days 7, 90, and 196 after the end of CQ treatment, and hemozoin (Hz) content as well as Hz-containing cells were quantified in liver, spleen, and bone marrow.
3.1. Histology and Measurement of Hz as Haem-Equivalents
Uninfected mice, which served as negative control, showed a normal histology of bone marrow, liver, and spleen with no detectable pigment depositions (Figure 1). In infected mice, typical dark brown pigment (Hz) could be observed at all time points studied (Figures 2, 3, and 4). Depolarization microscopy confirmed the birefrigent nature of the Hz deposits (Figures 2, 3, and 4; right columns).
Figure 1.
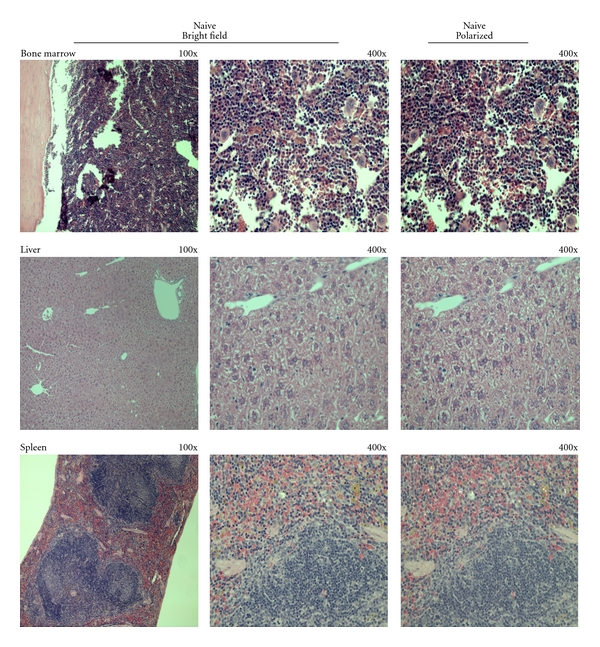
Histology of naive mice organs. Sections of bone marrow, liver, and spleen of uninfected mice were fixed and stained with Hematoxylin and Eosin (H&E) and observed using a Leica DM5000 microscope. In these sections no deposition of a dark brown pigment could be observed. Depolarization microscopy also showed no birefrigent deposits.
Figure 2.
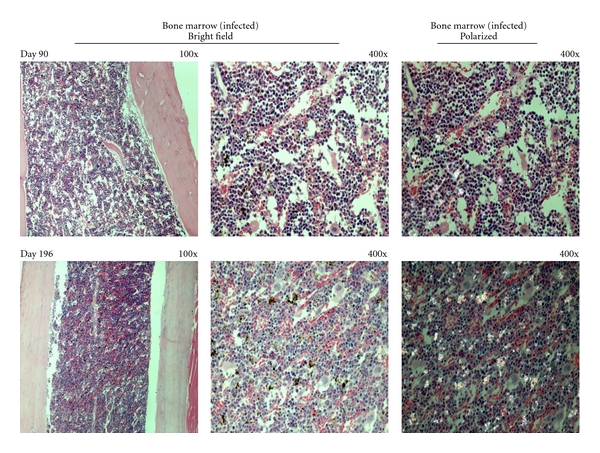
Hemozoin deposition in the bone marrow of malaria infected-cured mice. Representative images of hemozoin (Hz) deposition in the bone marrow of P. berghei NK65 infected-cured mice at different times after the end of Chloroquine treatment. Bone marrow sections from infected-cured mice showed Hz deposition as dispersed small pigment agglomerations 90 and 196 days after treatment. Bone marrow sections at 7 days after treatment not performed.
Figure 3.
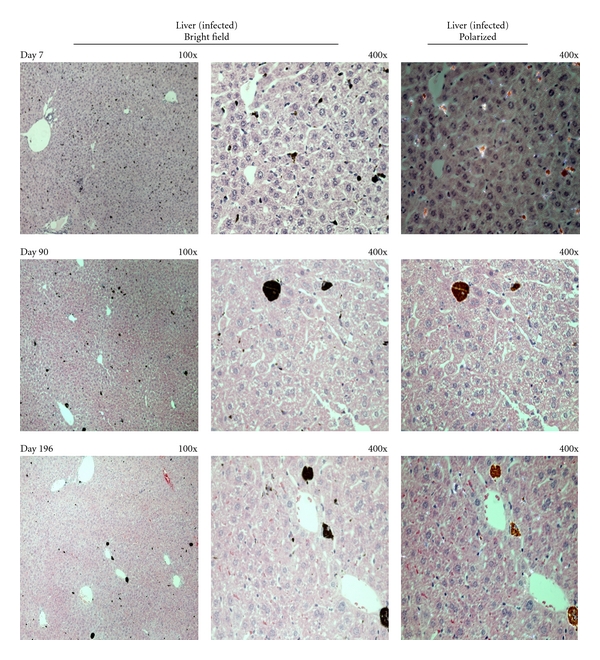
Hemozoin deposition in the liver of malaria infected-cured mice. Representative images of hemozoin (Hz) deposition in the liver of P. berghei NK65 infected-cured mice at different times after the end of Chloroquine treatment. Liver sections revealed Hz deposition in large agglomerates in the sinusoidal areas. Hz could still be detected 196 days after the end of treatment.
Figure 4.
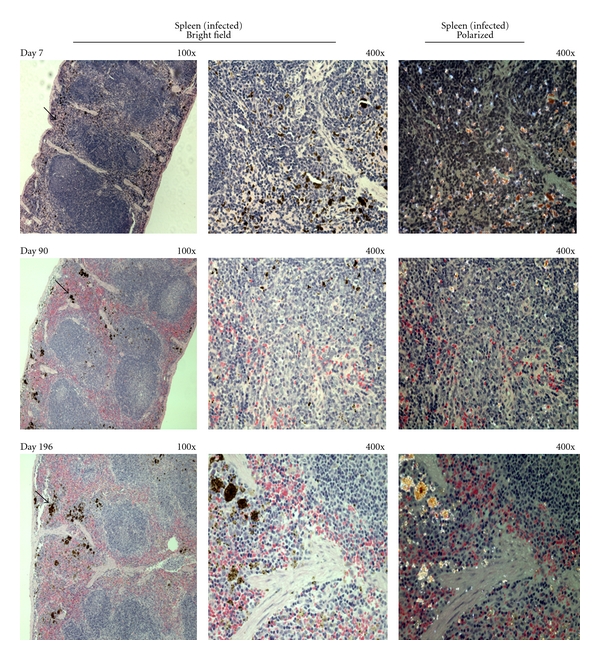
Hemozoin deposition in the spleen of malaria infected-cured mice. Representative images of hemozoin (Hz) deposition in the spleen of P. berghei NK65 infected-cured mice at different times after the end of Chloroquine treatment. Sections of spleen of infected-cured mice showed a majority of the Hz deposition in the red pulp (as indicated by the black arrows). The Hz aggregates seemed to become larger over time (bottom row).
Hz inside the bone marrow was dispersed as small pigment agglomerations (Figure 2) and the quantitative measurement of area occupied by Hz changed little over time (Figure 5). In the liver, Hz was present in larger agglomerations (Figure 3). Liver Hz-content, as measured by the area occupied by the pigment, appeared to decrease over time (Figure 5). However, using the colorimetric detection of Hz, the amount of Hz in the liver appeared to be slightly increased (Figure 6).
Figure 5.
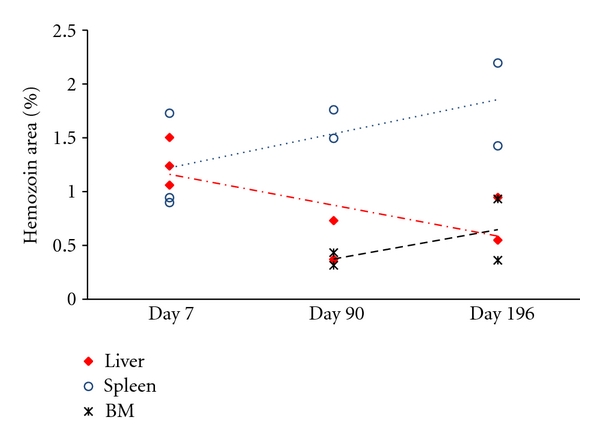
Hemozoin quantification in histological sections of malaria infected-cured mice. Five microscopic fields (400×) were chosen for each organ section from P. berghei NK65 infected-cured mice. The images were then converted to a grayscale (8 bit) image using Image J. The amount of hemozoin (Hz) observed was expressed as a percentage of the total area of the image (in pixels). Over time the amount of Hz in the bone marrow (cross) appeared to be stable, whereas it decreased in liver tissue (red diamond) and it increased in the spleen (blue circle).
Figure 6.
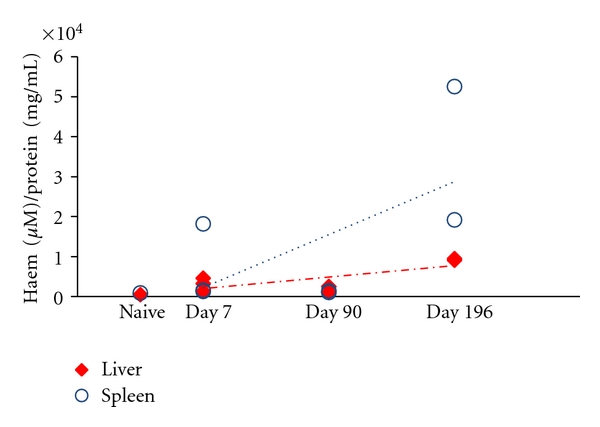
Hemozoin quantification by colorimetric assay in the organs of malaria infected-cured mice. Hemozoin (Hz) deposition in livers and spleens of P. berghei NK65 infected-cured mice was also determined by a colorimetric assay (QuantiChrom Heme Assay Kit) and expressed in haem equivalents (normalized to protein content). Overall Hz content seemed to increase overtime, although only slightly so for the liver. Liver and spleen of naïve mice had negligible amounts of detected haem of 468 and 890 μM haem/protein (mg/mL), respectively, which is likely to be associated with the presence of erythrocytes in the tissues.
Hz in the spleen was primarily localized in the red pulp (Figure 4), although some Hz was detectable in the white pulp at earlier time points (Figure 4, left columns). Over time, Hz depositions seemed to form larger aggregates (Figure 4). Overall, the amount of Hz in the spleen increased as measured either by area of tissue or using the colorimetric assay (Figures 5 and 6).
3.2. Detection of Hemozoin by Flow Cytometry
Hz could be detected in CD11b+ phagocytic cells from different organs in all infected mice (Figure 7), while cells from uninfected mice were, as expected, negative for depolarization caused by Hz. In infected mice, Hz-containing cells were mostly detectable on the first time point assessed (7 days after CQ). Interestingly, high numbers of Hz-containing phagocytic cells could be detected on the first time point in the liver (median: 56.5%) and spleen (median: 24.4%), with a marked decrease on the next time point studied (90 days). After that, they appeared to be stable (Figures 7(c) and 7(d)). In the bone marrow, Hz-containing phagocytes were less frequent (under 3%, Figure 7(b)).
Figure 7.
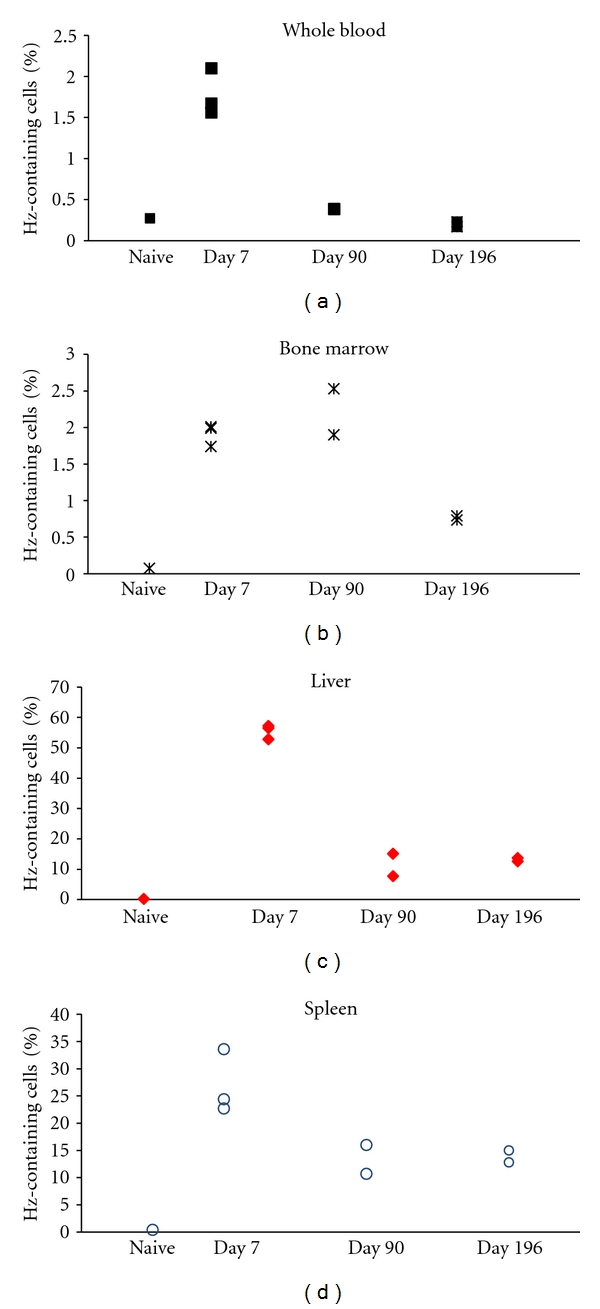
Detection of hemozoin by flow cytometry in the cells from malaria infected-cured mice. Detection of hemozoin (Hz) in phagocytic cells obtained from P. berghei NK65 infected-cured mice at different times after treatment, based on depolarized Side-Scatter measurement. Single cell suspensions from liver, spleen, and bone marrow were labelled with anti-CD11b-FITC and anti-Gr1-PE (blood samples) or anti-CD11b-FITC and anti-F4/80-PE (tissue samples). Hz could be detected in phagocytic cells in all infected mice while uninfected mice were negative for depolarizing cells. High numbers of Hz-containing phagocytic cells could be detected at the first time point (7 days after the end of CQ treatment) in livers (c) and spleens (d) with median levels of 56.5% and 24.4%, respectively. However, there was a marked decrease at later time points which seemed to become stable between 90, and 196 days after the end of CQ treatment. In bone marrow (b) Hz-containing phagocytes were less frequent overtime (starting at median levels of 2%) and in whole-blood (a) were overall low (median of 1.7% on first time point).
4. Discussion
This study provides new data on the issue of long-term kinetics of hemozoin (Hz) in the body of hosts infected with blood-stage malaria. It has been known since the 19th century that Hz is present in internal organs of humans after malaria episodes [6, 7]. Histological analysis of Hz accumulation in the liver or spleen following acute infection has been reported before, even if based on semiquantitative image analysis [15, 18]. Other studies used a fluorometric method to determine the total amount of Hz in tissues [8, 19]. In the present study, depolarization microscopy helped to identify pigment as Hz (Figures 1, 2, 3 and 4), as previously described [17].
Hz is usually ingested by tissue macrophages and present in the bone marrow [20] or in Kupffer cells, the resident macrophages of the liver [15, 18]. It is also found in the spleen, especially in the red pulp [21]. Interestingly, this is the area where iron pigments like hemosiderin accumulate, which appears to be frequent in female rodents [22]. However, little is known of the fate of Hz in tissues. For how long does it remain in tissues? And for how long is it present in macrophages? It has been reported that the life-span of tissue macrophages can reach several months [23], but with variations depending on the type of macrophage and the tissue [24].
Several studies have investigated the presence and kinetics of Hz-containing phagocytes in peripheral blood [4, 25, 26]. One study reported a median half-life of 216 hours for Hz-containing monocytes [5], although this was determined by microscopy, with its inherent limitations [27]. However, in the present study, Hz-containing phagocytes in whole blood were only detected at a rather low median percentage of 1.7% (Figure 7(a)) on the first time point assessed (day 7).
In addition, Hz levels in the spleen of the rodent host increased over time when determined by colorimetry or by histology (Figures 3, 4, 5 and 6). These findings are in keeping with a previous report which showed that Hz increased 8-fold in the spleen over 270 days [8]. However the observed increase in our model was of a much lower magnitude (Figures 5 and 6). The same study reported a decrease of 70% of Hz from the liver over the 270 day period [8]. In our study a slight decrease was observed by histology, while colorimetric determination even showed a slight increase. Levesque et al. [8] used a high sensitivity method in his report however our findings are based on two independent methods. The discrepancies between our observations and those of Levesque and colleagues could be explained by different mice being sacrificed at different time points and thus a larger variability may be expected between individual mice. Eventually, mice that developed infections with different parasitaemias before treatment might have been included on different time points. Another reason for the different observations is that different species of Plasmodium were used in the 2 studies (P. berghei NK65 here, and P. chabaudi chabaudi in Levesque et al.).
It has been noted that Hz may be contributing to the anaemia observed in malaria, although whether this effect is mediated through Hz-containing macrophages [13, 20] or is caused by Hz present in other cells [28] is a matter of some controversy. The results presented here indicate that around 2% of Hz-containing CD11b+ cells were detected up to 90 days after the end of CQ treatment in the bone marrow, while after 196 days 0.76% of CD11b+ cells could still be found to depolarize (Figure 7(b)).
Interestingly, and in contrast with the histological and colorimetric measurements, the amount of Hz-containing CD11b+ cells decreased in liver and spleen at 90 days, after median peak values of around 56.5% and 24.4% at day 7, respectively (Figures 7(c) and 7(d)). However, similar percentages of Hz-containing CD11b+ cells were still observed at 196 days, with around 13% median for both liver, and spleen. Possible explanations for the different tendencies found using other methods may be that the amount of Hz per macrophage increases over time (Figures 3 and 4). Another possible explanation is that Hz may be preferentially present in CD11b-negative cells, which is even more likely in the case of the spleen, because Hz tended to be located in the red pulp, where most macrophages should be CD11b-negative [29].
Overall, our results clearly show that significant amounts of Hz are present in bone marrow, liver and spleen at 7 and 90 days after CQ treatment, lasting up to after 196 days, both in liver and spleen, and including CD11b+ cells from both organs. These results are important in the light of the ever increasing research which indicates that Hz may have immune-modulatory effects, as reviewed elsewhere [30, 31]. Perhaps, of biggest concern are the reported suppressive effects of Hz [9–14], especially the notion that Hz accumulation might predispose to other infections like tuberculosis [15]. If Hz accumulates in tissues, as shown here and continues to be biologically active, this may have important implications for the host, including secondary infections, which are very common in malaria-endemic areas [32].
This study also shows that detection of Hz-containing cells from tissues is possible. As such, it may be possible to characterize the Hz-containing cell population better using newer flow cytometers that detect depolarization caused by Hz. Eventually, Hz containing and noncontaining cells could be sorted and their gene expression profile analysed to definitively establish whether Hz-containing cells really continue to be biologically active and, if so, what are the consequences of Hz uptake for those cells.
5. Conclusions
Hz remains in tissue organs for long periods after parasite clearance. In the case of the rodent model used in this study, Hz remains for as long as 6 months. If the same occurs in humans, as is implied by findings dating from the 19th century, and if Hz persists in a biological active state, that could have tremendous implications both in terms of host immunity to secondary infections and of the response to vaccinations.
Authors' Contribution
R. Frita and D. Carapau contributed equally to this paper. R. Frita and D. Carapau carried out the experimental work. M. M. Mota and T. Hänscheid conceived the study, participated in its design and coordination. R. Frita and T. Hänscheid wrote the draft of the paper. All authors have read the paper and approved it.
Conflict of Interests
The authors declare that they have no conflict of interests.
Acknowledgment
This work was funded by the Fundação para a Ciência e Tecnologia (PIC/IC/83214/2007).
References
- 1.Egan TJ, Combrinck JM, Egan J, et al. Fate of haem iron in the malaria parasite Plasmodium falciparum. Biochemical Journal. 2002;365(2):343–347. doi: 10.1042/BJ20020793. [DOI] [PMC free article] [PubMed] [Google Scholar]
- 2.Omodeo-Salè F, Motti A, Dondorp A, White NJ, Taramelli D. Destabilisation and subsequent lysis of human erythrocytes induced by Plasmodium falciparum haem products. European Journal of Haematology. 2005;74(4):324–332. doi: 10.1111/j.1600-0609.2004.00352.x. [DOI] [PubMed] [Google Scholar]
- 3.Goldberg DE, Slater AFG, Cerami A, Henderson GB. Hemoglobin degradation in the malaria parasite Plasmodium falciparum: an ordered process in a unique organelle. Proceedings of the National Academy of Sciences of the United States of America. 1990;87(8):2931–2935. doi: 10.1073/pnas.87.8.2931. [DOI] [PMC free article] [PubMed] [Google Scholar]
- 4.Kremsner PG, Valim C, Missinou MA, et al. Prognostic value of circulating pigmented cells in African children with malaria. Journal of Infectious Diseases. 2009;199(1):142–150. doi: 10.1086/595295. [DOI] [PMC free article] [PubMed] [Google Scholar]
- 5.Day NPJ, Pham TD, Phan TL, et al. Clearance kinetics of parasites and pigment-containing leukocytes in severe malaria. Blood. 1996;88(12):4694–4700. [PubMed] [Google Scholar]
- 6.Meckel H. Ueber schwarzes Pigment in der Milz und dem Blute einer Geisteskranken. Zeitschr für Psychiatrie. 1847;4:198–226. (Ger). [Google Scholar]
- 7.Virchow R. Zur pathologischen Physiologie des Bluts. Archiv für Pathologische Anatomie und Physiologie und für Klinische Medicin. 1849;2(3):587–598. [Google Scholar]
- 8.Levesque MA, Sullivan AD, Meshnick SR. Splenic and hepatic hemozoin in mice after malaria parasite clearance. Journal of Parasitology. 1999;85(3):570–573. [PubMed] [Google Scholar]
- 9.Schwarzer E, Müller O, Arese P, Siems WG, Grune T. Increased levels of 4-hydroxynonenal in human monocytes fed with malarial pigment hemozoin. A possible clue for hemozoin toxicity. The FEBS Letters. 1996;388(2-3):119–122. doi: 10.1016/0014-5793(96)00523-6. [DOI] [PubMed] [Google Scholar]
- 10.Deshpande P, Shastry P. Modulation of cytokine profiles by malaria pigment—hemozoin: role of IL-10 in suppression of proliferative responses of mitogen stimulated human PBMC. Cytokine. 2004;28(6):205–213. doi: 10.1016/j.cyto.2004.08.002. [DOI] [PubMed] [Google Scholar]
- 11.Millington OR, di Lorenzo C, Phillips RS, Garside P, Brewer JM. Suppression of adaptive immunity to heterologous antigens during Plasmodium infection through hemozoin-induced failure of dendritic cell function. Journal of Biology. 2006;5(2, article 5) doi: 10.1186/jbiol34. [DOI] [PMC free article] [PubMed] [Google Scholar]
- 12.Urban BC, Todryk S. Malaria pigment paralyzes dendritic cells. Journal of Biology. 2006;5(2, article 4) doi: 10.1186/jbiol37. [DOI] [PMC free article] [PubMed] [Google Scholar]
- 13.Awandare GA, Ouma Y, Ouma C, et al. Role of monocyte-acquired hemozoin in suppression of macrophage migration inhibitory factor in children with severe malarial anemia. Infection and Immunity. 2007;75(1):201–210. doi: 10.1128/IAI.01327-06. [DOI] [PMC free article] [PubMed] [Google Scholar]
- 14.Millington OR, Gibson VB, Rush CM, et al. Malaria impairs T cell clustering and immune priming despite normal signal 1 from dendritic cells. PLoS Pathogens. 2007;3(10):1380–1387. doi: 10.1371/journal.ppat.0030143. [DOI] [PMC free article] [PubMed] [Google Scholar]
- 15.Hawkes M, Li X, Crockett M, et al. Malaria exacerbates experimental mycobacterial infection in vitro and in vivo. Microbes and Infection. 2010;12(11):864–874. doi: 10.1016/j.micinf.2010.05.013. [DOI] [PubMed] [Google Scholar]
- 16.Frita R, Rebelo M, Pamplona A, et al. Simple flow cytometric detection of haemozoin containing leukocytes and erythrocytes for research on diagnosis, immunology and drug sensitivity testing. Malaria Journal. 2011;10, article 74 doi: 10.1186/1475-2875-10-74. [DOI] [PMC free article] [PubMed] [Google Scholar]
- 17.Romagosa C, Menendez C, Ismail MR, et al. Polarisation microscopy increases the sensitivity of hemozoin and Plasmodium detection in the histological assessment of placental malaria. Acta Tropica. 2004;90(3):277–284. doi: 10.1016/j.actatropica.2004.02.003. [DOI] [PubMed] [Google Scholar]
- 18.Moore BR, Jago JD, Batty KT. Plasmodium berghei: parasite clearance after treatment with dihydroartemisinin in an asplenic murine malaria model. Experimental Parasitology. 2008;118(4):458–467. doi: 10.1016/j.exppara.2007.10.011. [DOI] [PubMed] [Google Scholar]
- 19.Sullivan AD, Ittarat I, Meshnick SR. Patterns of haemozoin accumulation in tissue. Parasitology. 1996;112(part 3):285–294. doi: 10.1017/s003118200006580x. [DOI] [PubMed] [Google Scholar]
- 20.Casals-Pascual C, Kai O, Cheung JOP, et al. Suppression of erythropoiesis in malarial anemia is associated with hemozoin in vitro and in vivo. Blood. 2006;108(8):2569–2577. doi: 10.1182/blood-2006-05-018697. [DOI] [PubMed] [Google Scholar]
- 21.Carvalho LJ, Ferreira-da-Cruz MF, Daniel-Ribeiro CT, Pelajo-Machado M, Lenzi HL. Germinal center architecture disturbance during Plasmodium berghei ANKA infection in CBA mice. Malaria Journal. 2007;6, article 59 doi: 10.1186/1475-2875-6-59. [DOI] [PMC free article] [PubMed] [Google Scholar]
- 22.Suttie AW. Histopathology of the spleen. Toxicologic Pathology. 2006;34(5):466–503. doi: 10.1080/01926230600867750. [DOI] [PubMed] [Google Scholar]
- 23.Geissmann F, Manz MG, Jung S, Sieweke MH, Merad M, Ley K. Development of monocytes, macrophages, and dendritic cells. Science. 2010;327(5966):656–661. doi: 10.1126/science.1178331. [DOI] [PMC free article] [PubMed] [Google Scholar]
- 24.Newton R. Macrophagehalf-life, 1995, http://www.bionet/bionet/mm/immuno/1995-October/005776.html.
- 25.Lyke KE, Diallo DA, Dicko A, et al. Association of intraleukocytic Plasmodium falciparum malaria pigment with disease severity, clinical manifestations, and prognosis in severe malaria. The American Journal of Tropical Medicine and Hygiene. 2003;69(3):253–259. [PubMed] [Google Scholar]
- 26.Hänscheid T, Längin M, Lell B, et al. Full blood count and haemozoin-containing leukocytes in children with malaria: diagnostic value and association with disease severity. Malaria Journal. 2008;7, article 109 doi: 10.1186/1475-2875-7-109. [DOI] [PMC free article] [PubMed] [Google Scholar]
- 27.Hänscheid T, Frita R, Längin M, Kremsner PG, Grobusch MP. Is flow cytometry better in counting malaria pigment-containing leukocytes compared to microscopy? Malaria Journal. 2009;8(1, article 255) doi: 10.1186/1475-2875-8-255. [DOI] [PMC free article] [PubMed] [Google Scholar]
- 28.Lamikanra AA, Theron M, Kooij TWA, Roberts DJ. Hemozoin (malarial pigment) directly promotes apoptosis of erythroid precursors. PLoS One. 2009;4(12) doi: 10.1371/journal.pone.0008446. Article ID e8446. [DOI] [PMC free article] [PubMed] [Google Scholar]
- 29.Noel G, Guo X, Wang Q, Schwemberger S, Byrum D, Ogle C. Postburn monocytes are the major producers of TNF-α in the heterogeneous splenic macrophage population. Shock. 2007;27(3):312–319. doi: 10.1097/01.shk.0000239753.75088.5e. [DOI] [PubMed] [Google Scholar]
- 30.Hänscheid T, Egan TJ, Grobusch MP. Haemozoin: from melatonin pigment to drug target, diagnostic tool, and immune modulator. Lancet Infectious Diseases. 2007;7(10):675–685. doi: 10.1016/S1473-3099(07)70238-4. [DOI] [PubMed] [Google Scholar]
- 31.Shio MT, Kassa FA, Bellemare MJ, Olivier M. Innate inflammatory response to the malarial pigment hemozoin. Microbes and Infection. 2010;12(12-13):889–899. doi: 10.1016/j.micinf.2010.07.001. [DOI] [PubMed] [Google Scholar]
- 32.Troye-Blomberg M, Berzins K. Immune interactions in malaria co-infections with other endemic infectious diseases: implications for the development of improved disease interventions. Microbes and Infection. 2008;10(9):948–952. doi: 10.1016/j.micinf.2008.07.014. [DOI] [PubMed] [Google Scholar]