Abstract
Opportunistic human pathogenic fungi like the ubiquitous fungus Aspergillus fumigatus are a major threat to immunocompromised patients. An impaired immune system renders the body vulnerable to invasive mycoses that often lead to the death of the patient. While the number of immunocompromised patients is rising with medical progress, the process, and dynamics of defense against invaded and ready to germinate fungal conidia are still insufficiently understood. Besides macrophages, neutrophil granulocytes form an important line of defense in that they clear conidia. Live imaging shows the interaction of those phagocytes and conidia as a dynamic process of touching, dragging, and phagocytosis. To unravel strategies of phagocytes on the hunt for conidia an agent-based modeling approach is used, implemented in NetLogo. Different modes of movement of phagocytes are tested regarding their clearing efficiency: random walk, short-term persistence in their recent direction, chemotaxis of chemokines excreted by conidia, and communication between phagocytes. While the short-term persistence hunting strategy turned out to be superior to the simple random walk, following a gradient of chemokines released by conidial agents is even better. The advantage of communication between neutrophilic agents showed a strong dependency on the spatial scale of the focused area and the distribution of the pathogens.
Keywords: agent-based modeling, individual-based modeling, host-pathogen interaction, immune defense, opportunistic pathogenic fungi, pathogenic fungi, chemotaxis, video analysis of life cell imaging
1. Introduction
The immune system of healthy humans successfully defends them against ubiquitous fungi like Aspergillus fumigatus, Candida albicans, and Cryptococcus neoformans. A weakened immune defense, due to diseases like infection with human immunodeficiency virus (HIV) or in the course of medical treatment, is compromised in the ability to repel those opportunistic fungal pathogens (Richardson, 2005; Karkowska-Kuleta et al., 2009). The recent medical progress especially in immune therapy, transplantation therapy, and life-prolonging measures leads to a growing number of susceptible patients (Richardson, 2005; Karkowska-Kuleta et al., 2009). Invasive mycoses caused by A. fumigatus lead to mortality rates of 60–90% (Karkowska-Kuleta et al., 2009). Thus, understanding infection dynamics and the response of the immune system to invading fungi is an essential step on the way to stop the opportunistic pathogens from taking over.
Inhaled conidia of A. fumigatus that are not repelled by respiratory tract mucociliary defenses lead to a complex response of the immune system (Shoham and Levitz, 2005). Here, we focus on the role of neutrophil granulocytes (neutrophils). These phagocytes are recruited by chemokines like IL-8 to the site of infection (Shoham and Levitz, 2005). In case of getting in contact with fungal conidia, phagocytes can engulf, and degrade them. The recruitment of neutrophils occurs within 4–8 h of intratracheal conidial infection, the same time A. fumigatus needs for conidial germination and hyphal formation (Hohl, 2009). Hyphae can invade pulmonary tissues, enter the bloodstream, and disseminate to remote tissues, leading to life-threatening systemic infections. Thus, clearance of fungal conidia should occur rapidly. To elucidate the dynamics of the interaction of A. fumigatus conidia and neutrophils live imaging data have been recorded and analyzed (Behnsen et al., 2007).
The goal of the present paper is to make a first step in analyzing these data by computer simulations. Computational immunology as a method to complement wet lab immunology comprises several mathematical methods (for a review see reference Forrest and Beauchemin, 2007). While game-theoretic models of immunological aspects are focused on states of equilibrium (Hummert et al., 2010), agent-based models (ABMs) are well-suited to model spatially heterogeneous, dynamic processes like interactions of immune cells with conidia. The main feature of ABMs is that a complex system’s behavior is modeled by actions and interactions of entities called agents which themselves behave according to rules.
In theoretical immunology, models are composed of agents belonging to immune defense, e.g., phagocytes, as well as agents representing evading pathogens, e.g., fungal or bacterial cells. Behavioral rules of agents are based on experimental findings complemented by hypothetical properties. Thus, the impact of hypothetical properties on the system’s behavior can be tested, predictions can be made and for validation, the system’s behavior in silico can be compared with the experimentally observed one. For reviews on ABMs in theoretical immunology see references Bauer et al. (2009), Chavali et al. (2008).
We implemented an ABM in NetLogo (Wilensky, 1999) to test the impact of different hunting strategies of neutrophils on their phagocytosis efficiency. A central question tackled in this work is whether chemical communication and chemotaxis of neutrophils improve the clearing efficiency. Germinating conidia of A. fumigatus activate the complement system and induce neutrophil chemotaxis (Waldorf and Diamond, 1985). Further, it is known that neutrophils have the ability to recruit other neutrophils (Scapini et al., 2000).
2. Materials and Methods
2.1. Video analysis of life cell imaging
There exist well established techniques to visualize fungal infections in hosts, such as confocal laser scanning microscopy (Paddock, 1999) and bright-field microscopy (Pluta, 1988). The latter was used in this approach. The majority of produced data are images with immune cells and conidia, either as bright-field or fluorescence images. Important quantities that characterize the dynamic cellular behavior are the cell classification, cell counting, shape and extent measurements, cell-cell interactions, and, for time-lapse data, cell motility, and velocity. However, the image analysis forms the bottleneck in these studies. Automation of this process is the goal of biological image analysis. This was already realized for the two-dimensional case of phagocytosis assays (Mech et al., 2011). However, a specific application to temporally resolved phagocytosis assays of A. fumigatus conidia and phagocytes in a fully automated fashion is not available, today.
We analyzed video material (15 sequences) of the first 90 min of an in vitro interaction of neutrophils and conidia of A. fumigatus (videos have been provided by the research group of Matthias Gunzer). Every 30 s a frame was recorded which corresponds to 180 frames for sequences of 90 min length.
The analysis comprises three steps: segmentation, classification, and tracking. The segmentation of frames was done for each frame separately similar to the approach used in (Mech et al., 2011). Erroneous segmentation results due to highly heterogeneous cell morphologies and uneven illumination artifacts were corrected manually. With that, each cell was recognized as an object. Afterwards, neutrophilic objects were semi-automatically tracked. Each neutrophilic object was tracked from frame to frame using overlap in two consecutive frames or, if no overlap existed, by searching for the nearest neutrophilic object in the subsequent frame. During the tracking an unique identifier was assigned to each neutrophilic object as well as the changes in positions as velocities. Then, the number of conidia which are freely moving, ingested, or dragged were counted manually for each time step. The numbers of dragged and ingested conidia were assigned to the respective neutrophils. Thus, the phagocytosis rate of a neutrophil is the number of conidia which a neutrophil ingested over time. Furthermore, adherence of conidia may lead over time to ingestion by or dissociation from neutrophils. In the former case respecting conidia were categorized as dragged. Hence, the dragging rate depicts the number of adherent conidia which did not dissociate from a neutrophil.
After the time-lapse data analysis the number of neutrophils, the velocities, and number of associated and ingested conidia per neutrophil as well as the number of conidia categorized as free, ingested, or dragged, were available.
2.2. The model
The “hunt” of neutrophils for conidia is modeled by an ABM. The behavior of neutrophilic agents as well as conidial agents is defined by rules which is a key element of ABMs. Here, the rules are based on properties extracted from the given video material of life cell imaging (see subsection 2.1.) as described in subsequent sections. We follow the ODD-protocol for describing ABMs (Grimm et al., 2006, 2010).
2.3. Purpose of the ABM
Clearing conidia before they germinate can be seen as an action enhancing the fitness of the organism. Different strategies of neutrophils in tracking and disposing conidia vary in their efficiency. In this ABM approach we tested the impact of different tracking modes of neutrophilic agents on their efficiency in reducing the amount of free conidial agents. Simple random walk as well as a short-term persistence in keeping direction, both without sensing of chemotactic molecules were tested. Then, perception of excreted metabolites of germinating conidia or signal-molecules from complement system, thus all chemokines, was considered as well as positive feedback activation via chemical communication between neutrophilic agents. In a large-scale modeling approach representing a part of lung tissue we additionally tested the efficiency of chemotactic communication between neutrophilic agents for clustered distributions of conidial agents simulating an infection scenario.
2.4. Entities, state variables, and scales
The ABM was initialized on a grid of 41 × 35 (=1,435) discrete cells. The width of a grid cell fits the size of a conidium which is about 3 μm in diameter. The evaluation of the life imaging videos showed immigration and emigration of the motile cells out of the scope. For the model we assumed an equal rate of this events and therefore implemented periodical boundary conditions. One time-step in the simulation refers to a 30 s interval and matches the 2 frames per min pattern of the evaluated life imaging videos. Simulations run over the first 90 min of neutrophil-conidia interactions.
For a large-scale simulation a grid of 401 × 341 (=136,741) cells was built. Thus, an area of more than 1 mm2 was covered. The simulation was evaluated for 2,880 simulated time-steps, which corresponds to 24 h after the initial infection. The model comprises three types of entities: grid cells, conidial agents, and motile neutrophilic agents. See Tables A1–A3 in Appendix for state variables and parameters.
2.5. Design concepts
We tested and combined several modes of neutrophilic movement to explain the in vitro efficiency of a population of neutrophils in reducing the amount of free conidia. In the model approach that incorporates diffusion of chemokines, excreted by the conidial agents, neutrophilic agents adapt their movement to this signal. This assumption is supported by the observation of Waldorf and Diamond (1985) that germinating conidia of A. fumigatus activate the complement system and induce neutrophil chemotaxis. Scapini et al. (2000) report the ability of neutrophils to recruit other neutrophils. Thus, as a further hunting strategy communication between neutrophilic agents that orientate on gradients of signals was tested.
In our model we do not focus on the fitness functions of single agents, but on the immune system as a whole, where the population of neutrophils form a first line defense of a multi-cellular organism. Here, the efficient reduction of free conidia, which potentially germinate, infect the organism, and may decrease its overall fitness, can be seen as the fitness function. Costs of different hunting strategies have not been taken into account. None of the agents did change their behavior due to any kind of increasing experience or learning effects. In the model approaches with diffusion of chemokines excreted by conidial agents and chemical communication between neutrophilic agents, latter were able to sense and follow the gradients of these substances. Prediction: neutrophilic agents adjusted their movement in direction of the highest amount of these substances on the eight neighboring grid cells (Moore neighborhood) which indirectly increased the probability to encounter either a conidial agent (see sub-model diffusion of chemokines in section 2.8.1.) or another neutrophilic agent, which was activated by at least one dragged conidial agent (see sub-model communication between neutrophils in section 2.8.1.) – which can be seen as a positive feedback loop. The interaction of neutrophilic and conidial agents was separated into two major types: dragging of conidial agents and intake of them, corresponding to the video material (see sub-model interaction of agents in section 2.8.2. and Figure A1 in Appendix). Stochasticity: Each simulation started with a random distribution of neutrophilic and conidial agents on the grid. The direction of movement of neutrophilic agents was chosen randomly for the random walk model. The velocities of neutrophilic agents were chosen either to form a normal distribution or a log-normal distribution, which was derived from life cell imaging data. We stored the fraction of free conidial agents, neither dragged or phagocytized by neutrophilic agents, for a fixed set of simulated time-steps, which correspond to the evaluated timeframes of the video material.
2.6. Initialization
Small-scale simulation: Each simulation was initialized with a random distribution and orientation of conidial agents and neutrophilic agents. Starting numbers of both agents (110 conidial agents, 25 neutrophilic agents) were taken from one of 15 given in vitro life cell imaging sequences (videos have been provided by the research group of Matthias Gunzer). All experimental samples contained between 68 and 127 conidia (mean: 100).
Large-scale simulation: 600 conidial agents were clustered in 4 randomly located spots on the grid. Cluster-size and number of conidial agents per cluster were equal for all clusters at initialization. 100 neutrophilic agents were randomly placed onto the grid.
2.7. Input data
From one of the videos we derived a density-distribution of the neutrophils’ velocity. A histogram and the fitted log-normal density-distribution of the velocities is shown in Figure 1.
Figure 1.
Plots of (left) histogram and fitted density-distribution of neutrophils’ velocity derived from life cell imaging (right) fitted continuous log-normal density-distribution function.
2.8. Sub-models
2.8.1. Diffusion of chemokines by conidial agents and positive feedback activation of neutrophilic agents
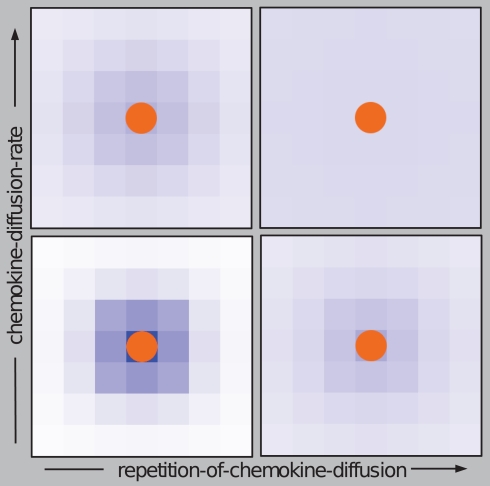
Two types of chemical signaling determining the movement behavior of neutrophilic agents were considered in our modeling approach. We tested the impact of chemokines emitted by conidial agents which could be recognized by neutrophilic agents (Figure 2). Further, we allowed chemical communication between neutrophilic agents, assuming that the contact with a conidium can activate and recruit other immune cells (positive feedback; Figure 2). In our ABM the process of diffusion was expressed by two distinct parameters: chemokine-diffusion-rate and number of diffusion steps per time-step (repetition-of-chemokine-diffusion). Chemokine-diffusion-rate gives the fraction of molecules in the source grid cell that is equally divided and transferred to the eight neighboring cells (Moore neighborhood) in a single diffusion step. Both parameters determine the chemical gradient (see Figure 3).
Figure 2.
ABM with (left) random walk of neutrophilic agents (middle) diffusion of chemokines excreted by conidial agents, and (right) with communication between neutrophilic agents, which causes a positive feedback loop in activating the immune defense and an aggregation of neutrophilic agents (see Appendix for sample videos of each movement type).
Figure 3.
Effects of the parameters “repetition-of-chemokine-diffusion” and “chemokine-diffusion-rate” on the process of diffusion of chemokines excreted by conidial agents on the grid cells for a fixed number of simulation-steps. A high value “repetition-of-chemokine-diffusion” leads to flat gradient of chemokines, while a high “chemokine-diffusion-rate” leads to a wider and faster diffusion of the chemical signal.
2.8.2. Interaction of agents
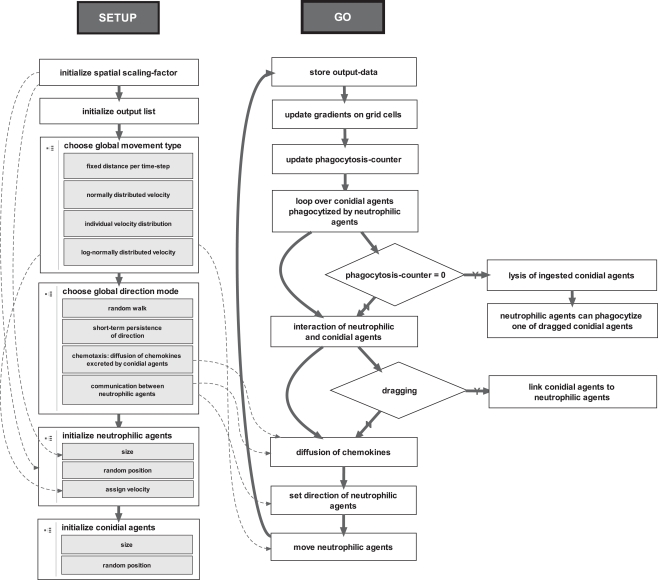
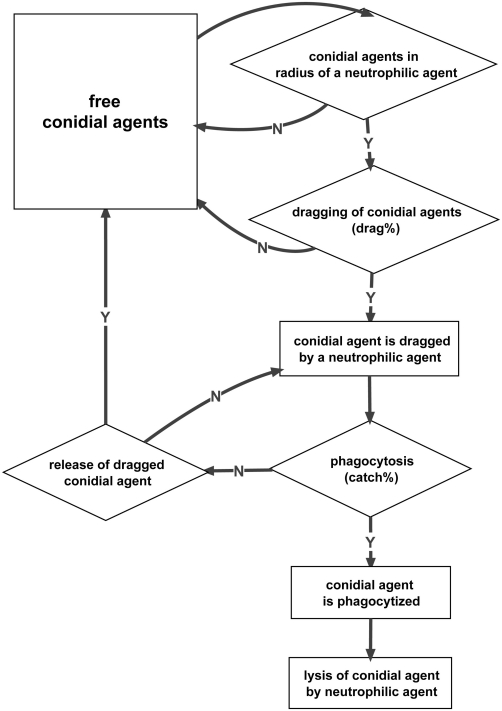
From life cell imaging we derived four main states of a conidial agent: it can either be free, dragged, phagocytized, or lysed by a neutrophilic agent (see Figure A1 in Appendix). Free conidial agents can be dragged by neutrophilic agents with a certain probability. This linkage can vanish with a certain probability. Then, the conidial agent is free again, or the dragged conidial agent can be phagocytized with a certain probability. Once a conidial agent is ingested it gets digested by the neutrophilic agent after a fixed amount of time-steps (see Figure 4). The progress of a typical simulation run is shown in Figure 5.
Figure 4.
Two main procedures of the ABM. The setup-procedure initializes the environment, the agents and the lists for storing the output-data. The go-procedure is a for-loop over 180 time-steps, which corresponds to the first 90 min of neutrophil-conidia interaction observed by live cell imaging.
Figure 5.
Progress of a typical simulation run. Neutrophilic agents (black) move on the grid randomly or search for free conidial agents (orange), which they may drag (yellow), or phagocytize (red). Conidial agents, which have been phagocytized already (gray), remain in the neutrophilic agent for reasons of visualization and do not further contribute to the simulation run.
3. Results
For the interpretation of interactions of neutrophils with conidia of A. fumigatus recorded by in vitro life cell imaging we tested in an ABM several modes of movement of the neutrophilic agents in their hunt for conidial agents. The remaining amount of free conidial agents after a defined timespan was taken as a measure for the efficiency of the applied hunting strategy of neutrophilic agents. Different strategies were tested in a small-scale model covering about 10,000 μm2 as well as on a larger scale representing about 1 mm2 of lung tissue.
3.1. Small-scale simulation
The simulation was conducted over the first 90 min of interactions, identical to the timespan of observation in life cell imaging experiments, and was repeated 250 times for each parameter combination.
3.1.1. Random walk, normally distributed velocity of neutrophilic agents
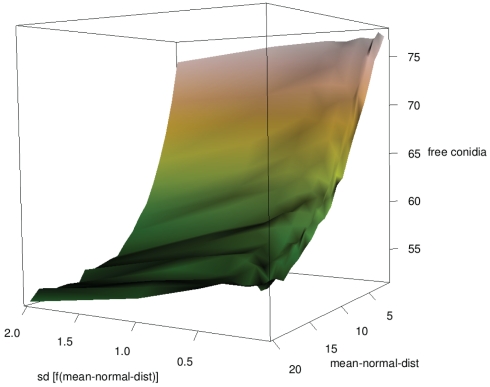
The simplest way for neutrophilic agents to search conidial agents while having no clue of their whereabouts is by searching randomly, i.e., random walk. The velocity of neutrophilic agents was assumed to be normally distributed. An increasing mean resulted in a significantly decreased amount of free conidial agents at the end of the simulations, while the impact of the SD was low (see Figure 6).
Figure 6.
Influence of mean and SD of neutrophilic agents’ velocity on clearing efficiency (SD as function of mean).
3.1.2. Neutrophilic agents keep direction for a short timespan (short-term persistence in direction)
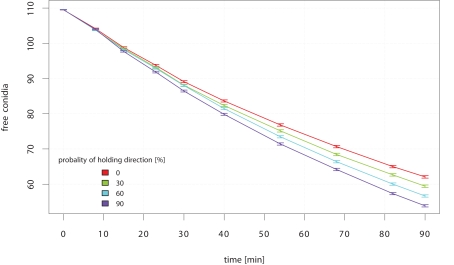
Is it better to keep direction on the search and thus, to reduce the probability of moving back where the area is already cleared? Indeed, the efficiency of neutrophilic agents to phagocytize conidial agents increased significantly with a higher probability to hold the recent direction in the next time-step, which is called short-term persistence (STP; see Figure 7). The gain in clearing efficiency increases with the passing of time. The STP strategy pays off especially at low amounts of remaining free conidial agents.
Figure 7.
Mean amount of free conidial agents during simulation-time which corresponds to 90 min of in vivo interaction. The simulation was repeated for each STP strategy 250 times.
3.1.3. Diffusion of chemokines
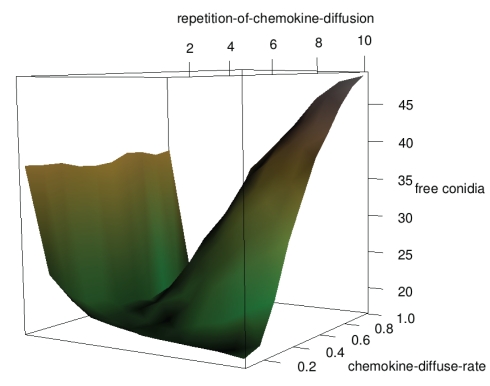
Does following traces of the presence of conidia lead to a higher clearing efficiency? Metabolic activities of germinating conidia as well as recognition by the complement system result in certain molecules diffusing away from a conidium. Acting as a chemokine they could be sensed by a neutrophilic agent that follows the gradient. In Figure 8 the clearing efficiency is shown in dependence on the diffusion parameters. If there is only one diffusion step per time-step the chemokine-diffusion-rate does not matter since the chemokines have only diffused to the next neighboring grid cells. The chemokines have not reached far and thus, the clearing efficiency is relatively low. For a high repetition-of-chemokine-diffusion the gradient is too flat if the chemokine-diffusion-rate is not very small. Optimal sets of parameters are a low repetition-of-chemokine-diffusion (but higher than one) with an arbitrary chemokine-diffusion-rate and a higher repetition-of-chemokine-diffusion in combination with a low chemokine-diffusion-rate.
Figure 8.
Influence of diffusion parameters on clearing efficiency.
3.1.4. Communication between neutrophils
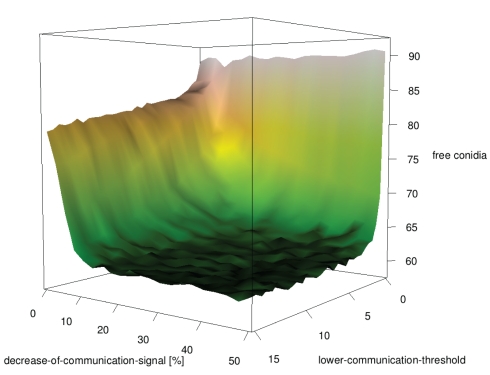
Is it useful to call other neutrophils if a neutrophil was successful in its hunt? In this model neutrophilic agents secrete communication molecules if they ingested a conidial agent. Other neutrophilic agents follow the gradient and help clearing conidial agents. Surprisingly, at first glance, nearly any communication disturbed the search for conidial agents (see Figure 9). At a closer look on the initialization setup it becomes clear that the conidial agents are distributed randomly. Thus, a found conidial agent does not imply that other conidial agents are located nearby. Communication between neutrophils leads to an accumulation of neutrophilic agents on locations where conidial agents already have been cleared. Hence, it is a better strategy to search at places where no other neutrophilic agents are and thus, to retain the initial random distribution.
Figure 9.
Influence of intra-neutrophilic communication on clearing efficiency of randomly distributed conidial agents.
3.2. Simulation of the interaction of neutrophils and clusters of conidia on a larger scale
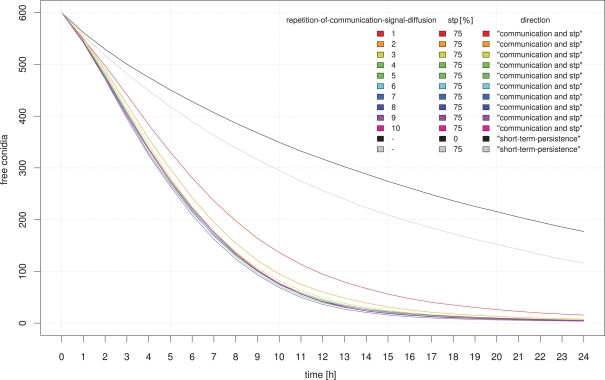
In a large-scale simulation-approach we tested whether communication between neutrophilic agents increases their efficiency to phagocytize conidial agents. In this setup the distribution of conidial agents was clustered in several randomly located spots on the grid. We evaluated the first 24 h after infection and documented the number of conidial agents which were not yet dragged or phagocytized by neutrophilic agents. In this approach we focused on the major parameters of a possible positive feedback stimulation of neutrophils by other neutrophils, which were already in contact with infectious conidia. Simulation results show that communication between neutrophilic agents significantly increases the efficiency compared to the random walk model (Figures 10 and 11). A high repetition-of-communication-signal-diffusion had a positive effect on the clearing efficiency. Here, the chemokines have reached areas far away from the source and thus, could activate neutrophilic agents that are far away from cluster of conidial agents.
Figure 10.
Influence of the diffusion parameter “repetition-of-communication-signal-diffusion” on the clearing efficiency dynamics. For comparison simulation results based on random movement of neutrophilic agents (black) and STP with a 75% probability of holding direction (gray) are shown.
Figure 11.
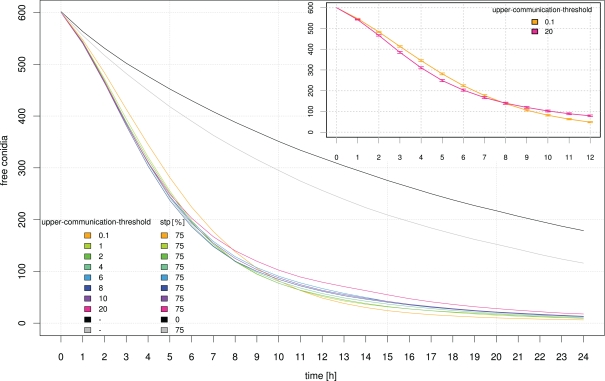
Influence of the signal perception parameter “upper-communication-threshold” on the clearing efficiency dynamics. For comparison, simulation results based on random movement of neutrophilic agents (black) and STP with a 75% probability of holding direction (gray) are shown. The inset shows a zoom into the graph where a crossover of the clearing efficiency for the highest (pink) and lowest (orange) “upper-communication-threshold” occurs which can be interpreted as two opposing clearing strategies. SE are indicated.
A repetition-of-communication-signal-diffusion of 3 seems to produce as good results as higher repetition-of-communication-signal-diffusion (see Figure 10) while computation time is shorter. Hence, this parameter remained fixed for the next study while upper-communication-threshold was varied. At the beginning of the clearance process neutrophilic agents with a higher upper threshold of communication signal perception were more successful. Later on, the inverse situation occurred.
A high upper threshold of communication signal perception is useful during the first hours where still many conidial agents are present near to calling neutrophilic agents. At a later time, when only few conidial agents remain in a cluster, a better strategy is to move to the vicinity of successful neutrophilic agents, but not nearby where the area is already cleared. This is realized by a small upper threshold of communication signal perception.
4. Discussion
Neutrophils play an essential role in the elimination of A. fumigatus (Balloy and Chignard, 2009; Mircescu et al., 2009). Nevertheless, the detailed mechanisms how these immune effector cells protect the human host are still a matter of debate (Bruns et al., 2010). One effector mechanism is phagocytosis of conidia (Behnsen et al., 2007).
Different potential movement strategies of neutrophils in tracking infectious conidia have been tested in an ABM to explain the in vitro efficiency of a population of neutrophils in reducing the amount of free conidia. Simple random walk, random walk with a tendency to keep the former direction (short-term persistence) and chemotactic movement triggered by chemokines excreted by conidia or communication signals sent out by other neutrophils that already have found conidia have been considered. The short-term persistence hunting strategy turned out to be superior to the simple random walk. A similar result has been found in computer simulations on the effectiveness of various search strategies at finding habitat patches (Zollner and Lima, 1999). Following a gradient of chemokines released by conidia is even better. Then, the success in clearing conidia depends on the diffusion parameters of the sensed molecules.
Neutrophils comprise both tracking strategies, short-term persistence to direction and chemotaxis (Tranquillo et al., 1988). In the absence of a gradient of a chemoattractant, they keep direction over the scale of minutes.
A central question tackled in this work is whether chemical communication and chemotaxis of neutrophils improve the clearing efficiency. We found that the answer depends on the spatial distribution of conidia, so that two cases can be distinguished: (a) If conidia are distributed randomly, communication does not pay off because it leads to an aggregation of neutrophils, so that many conidia are unaffected from neutrophilic attacks. (b) If conidia are clustered, communication of neutrophils results in a higher clearing efficiency, since attracting other neutrophils for a faster cooperative clearing pays off.
Calenbuhr and Deneubourg (1992) achieved similar results with a chemotaxis-diffusion model that describes collective hunting strategies using chemical communication in animals. It is found that collective hunting is more efficient at low prey densities whereas individual strategies are more efficient at high prey densities. Clustering of conidia can be seen as decreasing the density of the searched-for objects.
The communication model includes two parameters for cytokine recognition. A lower threshold of perception, and an upper threshold for sensing communication signals between immune cells. The large-scale simulation results showed a non-linear effect of this upper threshold of cytokine recognition on the efficiency of neutrophilic agents in clearing the tissue from infectious conidia. If the upper-communication-threshold was high, neutrophilic agents, activated by another “calling” neutrophilic agent, directly followed the gradient of cytokines until they reached the position of the calling agent. With lower values for the upper-communication-threshold activated neutrophilic agents mainly headed to the whole cluster of conidial agents, which significantly increased their overall efficiency. Scanning through possible values for this upper-communication-threshold revealed two opposing strategies. For a high threshold of cytokine recognition the overall efficiency of neutrophilic agents to clear the tissue was fast, but after a simulated time of 24 h after infection this strategy was not that efficient as simulation runs with a low threshold. We concluded that the overall efficiency of a population of neutrophilic agents can be either “fast but sloppy” possessing a high threshold for communication signal perception or, “slow but thoroughly” having a low threshold.
In an evolutionary context, we assume that selection would favor hosts with a “fast but sloppy” immune-response by neutrophils against pathogens, like A. fumigatus. An infection is a race against time and we expect that the immune system of hosts are selected for a fast clearance to prevent conidial germination, even if this might not be the most thorough strategy in the long-run.
However, the possibility remains that neutrophils vary their threshold in signal perception according to the current situation comprising both strategies like they control chemotaxis via different concentrations of chemoattractants by G-protein signaling (Zhang et al., 2009).
Conflict of Interest Statement
The authors declare that the research was conducted in the absence of any commercial or financial relationships that could be construed as a potential conflict of interest.
Supplementary Material
The Supplementary Material for this article can be found online at http://www.frontiersin.org/Microbial_Immunology/10.3389/fmicb.2012.00129/abstract
Acknowledgments
The authors are thankful to Matthias Gunzer for providing experimental data on Aspergillus fumigatus and murine neutrophils.
The work was supported by the “Pakt für Forschung und Innovation” of the BMBF (http://www.bmbf.de/) and TMBWK (http://www.thueringen.de/de/tmbwk/) to Sabine Hummert, Franziska Mech, and Marc Thilo Figge, BMBF “Virtual Liver” to Christian Tokarski, and DFG (Germany) within the excellence program “Jena School for Microbial Communication” to Anja Schroeter and Stefan Schuster.
Appendix
Table A1.
List of agents.
| State variables | Brief description |
|---|---|
| GRID CELLS | |
| Size | Corresponds to the mean conidium size of A. fumigatus of 2.5 μm |
| Radius of neutrophil | 2.5 grid cells |
| Conidia-chemokines | Amount of chemokines segregated by conidial agents |
| Neutrophil chemokines | Amount of chemokines segregated by neutrophilic agents |
| CONIDIAL AGENTS | |
| Size | Same size as a grid cell |
| In-zone | Stores the identity number of the neutrophilic agent in whose radius a conidial agent finds itself |
| Dragged | – By which it is dragged |
| Caught | – By which it is caught |
| Phagocytosis-counter | Counts the time until a caught conidial agent is digested |
| NEUTROPHILIC AGENTS | |
| Identity number | Unique number for each neutrophilic agent |
| Size | Size-ratio of neutrophilic and conidial agents is 2.5 |
| Velocity | Depends on movement mode |
| Direction | Depends on direction mode |
| Catching | Number of caught conidial agents |
| Dragging | Number of dragged conidial agents |
| Phagocytized | Number of phagocytized conidial agents |
Table A2.
List of global parameters.
| Parameter | Brief description |
|---|---|
| SETUP | |
| Initial-number-of-conidia | Initial population size of conidial agents |
| Initial-number-of-neutrophils | Initial population size of neutrophilic agents |
| Velocities-mode-of-neutrophils | Setup of neutrophilic agents’ movement options |
| Direction-mode-of-neutrophils | Setup of neutrophilic agents’ direction options |
| Move-conidia | Conidial agents are moved randomly around their initial position |
| INTERACTION | |
| Catch% | Neutrophilic agents’ probability to: catch a free conidial agent |
| Drag% | – Drag a free conidial agent |
| Drag-to-release% | – Release a dragged conidial agent |
| Drag-to-catch% | – Phagocytize a dragged conidial agent |
| Phagocytosis-capacity | Maximum number of conidial agents which can be phagocytized by a neutrophilic agent |
| Phagocytosis-time | Duration of phagocytosis |
Table A3.
Neutrophilic agents’ movement modes.
| Parameter | Brief description |
|---|---|
| Random walk | Random walk of neutrophilic agents |
| Mean-neutros | Option for normally-distributed mean of neutrophilic agents’ velocity (with fixed standard deviation) |
| Mean-normal dist | Option for normally-distributed mean of neutrophilic agents’ velocity |
| SD-normal dist | Option for normally-distributed standard deviation of neutrophilic agents’ velocity |
| Short-term persistence (STP) | Neutrophilic agents hold their actual direction with a certain probability |
| Hold-direction | Probability to hold given direction at the next step |
| Diffusion of conidia-chemokines | Activation of neutrophilic agents through conidia-chemokines, neutrophilic agents follow chemokine gradients |
| Amount-of-chemokines | Amount of chemokines spread by the free conidial agents per time-step |
| Chemokine-perception-threshold | Neutrophilic agents’ lower threshold of chemokine perception |
| Chemokine-diffusion-rate | Degree of diffusion |
| Repetition-of-chemokine-diffusion | Velocity of diffusion |
| Communication between neutrophils | Neutrophilic agents follow chemokine gradients segregated by activated neutrophilic agents (positive feedback-activation) |
| Activated neutrophil | Attracts other neutrophilic agents (positive feedback-activation) |
| Communication-signal | Signal strength of chemical communication spread by an activated neutrophilic agent |
| Decrease-of-communication-signal | Option for reducing the strength of communication signal |
| Lower-communication-threshold | Neutrophilic agents’ lower threshold of communication signal perception |
| Communication-over-chemotaxis | Option to rank priority of chemokine perception and communication signal perception of neutrophilic agents |
| Communication-signal-diffusion-rate | Degree of diffusion |
| Repetition-of-communication-signal-diffusion | Velocity of diffusion |
| LARGE-SCALE GRID WITH CLUSTERS OF CONIDIA | |
| Number-of-conidia-clusters | Initial number of spots of infection |
| Size-of-clusters | Size of spot of infection |
| Density-of-clusters | Number of conidial agents per spot of infection |
| Upper-communication-threshold | Neutrophilic agents’ upper threshold of communication signal perception |
Figure A1.
Interaction of conidial and neutrophilic agents.
References
- Balloy V., Chignard M. (2009). The innate immune response to Aspergillus fumigatus. Microbes Infect. 11, 919–927 10.1016/j.micinf.2009.07.002 [DOI] [PubMed] [Google Scholar]
- Bauer A. L., Beauchemin C. A. A., Perelson A. S. (2009). Agent-based modeling of host-pathogen systems: the successes and challenges. Inf. Sci. (Ny) 179, 1379–1389 [DOI] [PMC free article] [PubMed] [Google Scholar]
- Behnsen J., Narang P., Hasenberg M., Gunzer F., Bilitewski U., Klippel N., Rohde M., Brock M., Brakhage A. A., Gunzer M. (2007). Environmental dimensionality controls the interaction of phagocytes with the pathogenic fungi Aspergillus fumigatus and Candida albicans. PLoS Pathog. 3, e13. 10.1371/journal.ppat.0030013 [DOI] [PMC free article] [PubMed] [Google Scholar]
- Bruns S., Kniemeyer O., Hasenberg M., Aimanianda V., Nietzsche S., Thywissen A., Jeron A., Latgé J.-P., Brakhage A. A., Gunzer M. (2010). Production of extracellular traps against Aspergillus fumigatus in vitro and in infected lung tissue is dependent on invading neutrophils and influenced by hydrophobin roda. PLoS Pathog. 6, e1000873. 10.1371/journal.ppat.1000873 [DOI] [PMC free article] [PubMed] [Google Scholar]
- Calenbuhr V., Deneubourg J. (1992). Biology and Evolution of Social Insects, Chapter Pattern Formation Via Chemical Communication: Collective and Individual Strategies. Leuven: Leuven University Press, 343–349 [Google Scholar]
- Chavali A. K., Gianchandani E. P., Tung K. S., Lawrence M. B., Peirce S. M., Papin J. A. (2008). Characterizing emergent properties of immunological systems with multi-cellular rule-based computational modeling. Trends Immunol. 29, 589–599 10.1016/j.it.2008.08.006 [DOI] [PubMed] [Google Scholar]
- Forrest S., Beauchemin C. (2007). Computer immunology. Immunol. Rev. 216, 176–197 [DOI] [PubMed] [Google Scholar]
- Grimm V., Berger U., Bastiansen F., Eliassen S., Ginot V., Giskec J., Goss-Custard J., Grand T., Heinz S., Huse G., Huth A., Jepsen J., Jørgensen C., Mooij W., Müller B., Pe’er G., Piou C., Railsback S., Robbins A., Robbins M., Rossmanith E., Rüger N., Strand E., Souiss S., Stillman R., Vabø R., Visser U., DeAngelis D. (2006). A standard protocol for describing individual-based and agent-based models. Ecol. Modell. 198, 115–126 10.1016/j.ecolmodel.2006.04.023 [DOI] [Google Scholar]
- Grimm V., Berger U., DeAngelis D., Polhill J., Giske J., Railsback S. (2010). The ODD protocol: a review and first update. Ecol. Modell. 221, 2760–2768 10.1016/j.ecolmodel.2010.08.019 [DOI] [Google Scholar]
- Hohl T. M. (2009). Stage-specific innate immune recognition of Aspergillus fumigatus and modulation by echinocandin drugs. Med. Mycol. 47, 192–198 10.1080/13693780802078131 [DOI] [PMC free article] [PubMed] [Google Scholar]
- Hummert S., Hummert C., Schroeter A., Hube B., Schuster S. (2010). Game theoretical modelling of survival strategies of Candida albicans inside macrophages. J. Theor. Biol. 264, 312–318 10.1016/j.jtbi.2010.01.022 [DOI] [PubMed] [Google Scholar]
- Karkowska-Kuleta J., Rapala-Kozik M., Kozik A. (2009). Fungi pathogenic to humans: molecular bases of virulence of Candida albicans, Cryptococcus neoformans and Aspergillus fumigatus. Acta Biochim. Pol. 56, 211–224 [PubMed] [Google Scholar]
- Mech F., Thywissen A., Guthke R., Brakhage A. A., Figge M. T. (2011). Automated image analysis of the host-pathogen interaction between phagocytes and Aspergillus fumigatus. PLoS ONE 6, e19591. 10.1371/journal.pone.0019591 [DOI] [PMC free article] [PubMed] [Google Scholar]
- Mircescu M. M., Lipuma L., van Rooijen N., Pamer E. G., Hohl T. M. (2009). Essential role for neutrophils but not alveolar macrophages at early time points following Aspergillus fumigatus infection. J. Infect. Dis. 200, 647–656 10.1086/600380 [DOI] [PMC free article] [PubMed] [Google Scholar]
- Paddock S. W. (1999). Confocal laser scanning microscopy. BioTechniques 27, 992–996, 998–1002, 1004. [DOI] [PubMed] [Google Scholar]
- Pluta M. (1988). Advanced Light Microscopy: Principles and Basic Properties, Vol. 1 New York: Elsevier [Google Scholar]
- Richardson M. D. (2005). Changing patterns and trends in systemic fungal infections. J. Antimicrob. Chemother. 56(Suppl. 1), i5–i11 10.1093/jac/dki218 [DOI] [PubMed] [Google Scholar]
- Scapini P., Lapinet-Vera J. A., Gasperini S., Calzetti F., Bazzoni F., Cassatella M. A. (2000). The neutrophil as a cellular source of chemokines. Immunol. Rev. 177, 195–203 10.1034/j.1600-065X.2000.17706.x [DOI] [PubMed] [Google Scholar]
- Shoham S., Levitz S. M. (2005). The immune response to fungal infections. Br. J. Haematol. 129, 569–582 [DOI] [PubMed] [Google Scholar]
- Tranquillo R. T., Zigmond S. H., Lauffenburger D. A. (1988). Measurement of the chemotaxis coefficient for human neutrophils in the under-agarose migration assay. Cell Motil. Cytoskeleton 11, 1–15 10.1002/cm.970110102 [DOI] [PubMed] [Google Scholar]
- Waldorf A. R., Diamond R. D. (1985). Neutrophil chemotactic responses induced by fresh and swollen Rhizopus oryzae spores and Aspergillus fumigatus conidia. Infect. Immun. 48, 458–463 [DOI] [PMC free article] [PubMed] [Google Scholar]
- Wilensky U. (1999). NetLogo. Center for Connected Learning and Computer-Based Modeling Evanston, IL: Northwestern University [Google Scholar]
- Zhang H., Sun C., Glogauer M., Bokoch G. M. (2009). Human neutrophils coordinate chemotaxis by differential activation of Rac1 and Rac2. J. Immunol. 183, 2718–2728 10.4049/jimmunol.0900605 [DOI] [PMC free article] [PubMed] [Google Scholar]
- Zollner P. A., Lima S. L. (1999). Search strategies for landscape-level interpatch movements. Ecology 80, 1019–1030 10.1890/0012-9658(1999)080[1019:SSFLLI]2.0.CO;2 [DOI] [Google Scholar]


