

Abstract
We report a general method based on wide-field fluorescence imaging of single molecule photobleaching and Chung-Kennedy algorithm to measure the stoichiometry of functional protein complexes in living bacterial cells.
Proteins often function as multimeric complexes in cellular processes such as signal transduction and ion transport. Many well-established techniques exist to determine the structure and composition of protein complexes in their isolated forms in vitro, yet it is challenging to measure the stoichiometry of functional complexes in living cells.
Fluorescence resonance energy transfer (FRET) microscopy has been proven to be applicable in determining the composition of ligand-receptor complexes as well as spatial distribution of protein complexes in living cells.1, 2 However, FRET based techniques require the donor and acceptor labels to be within two times of Förster radius (~10 nm), limiting their applications to analysing only small protein complexes in vivo. Recently two colour fluorescence fluctuation spectroscopy (FFS) has been adapted to determine the stoichiometry of protein heterocomplexes in living cells.3-5 Single molecule two colour fluorescence coincidence detection (TCCD) has also been used to measure the stoichiometry of T-cell receptors.6
For homo-oligomeric protein complexes, a more general and direct method is preferable. It is fairly straightforward to measure the stoichiometry of fluorophore-labelled small protein complexes in vitro by fluorescence imaging by either EMCCD camera or confocal scanning and counting the number of steps in photobleaching traces of individual immobilised complexes owing to the high signal to noise ratio (SNR).7-9 However, it is difficult to identify stepwise photobleaching events from single molecule fluorescence imaging in living cells because of a stronger, heterogenous background from celluar autofluorescence. Nevertheless, total internal reflection fluorescence (TIRF) microscopy, which has much lower background in comparison to the normal wide-field fluorescence microscopy, has been successfully applied to measure the number of stators in single functioning bacterial flagellar motors by Leake and coworkers.10
Here we report a more general method based on wide-field fluorescence imaging of single molecule photobleaching and Chung-Kennedy algorithm11 to measure the stoichiometry of functional membrane protein complexes in living bacterial cells. We show that single fluorophore sensitivity can be achieved under normal epi-illumination conditions.
Our proposed methodology deals with the difficulty of measuring stoichiometry of protein complexes in living cells in three distinctive steps. During the first step, an edge-preserving non-linear digital filter based on Chung-Kennedy algorithm is applied to the photobleaching intensity trace in order to effectively discard additive Gaussian-like noise. The output of this filter is a smoother and clearer signal, with an improved SNR. This signal is subsequently used to calculate the PDDF (Pairwise Difference Distribution Function) and its power spectrum.10 Finally, peaks in the power spectrum are detected and the number of steps present in the original photobleaching trace is determined.
To test the effectiveness of our approach, we first apply it to a simulated photobleaching trace which is generated by assuming random stepwise photobleaching of monomers in an oligomer. This means that the photobleaching time for individual steps would be exponentially distributed. Three times the statistical noise is added to the trace to account for the worst noise case. As shown in Fig. 1, stepwise bleaching is clearly visible after data filtering and the derived step size of 102 ± 4 from the power spectrum is in good agreement with the preset value of 100.
Fig. 1.

The effectiveness of Chung-Kennedy algorithm to remove statistical noise and reveal photobleaching steps is demonstrated by applying it to a simulated trace with seven bleaching steps. (A) A simulated photobleaching trace with three times of random noise (grey) and the filtered trace (red). (B) Pairwise difference distribution function (PDDF) of filtered trace and its corresponding power spectrum (inset). Photobleaching steps can be easily identified. Note that the x-axis of the power spectrum has been converted from frequency to intensity.
We then use this approach to analyse stoichiometry of PspA protein complexes in E. coli cells. PspA is an extrinsic plasma membrane protein, binding to the cytoplasmic surface. It is (at least) a bi-functional protein that controls proton leakage accoss the membrane under stress conditions,12 but is also known to represses the activity of the PspF transcriptional activator by binding to it.13-15 While PspA has been shown to exist in at least two oligomeric states in vitro, low order ( probably a 6-mer) and high order (36-mer) oligomers,12, 13, 16 the stoichiometry of the functional PspA complexes in vivo is undetermined. This information is required to understand the mechanism of this bacterial stress response at the molecular level. A current model based on in vitro data proposes that a low-order oligomeric state of PspA is associated with its function as a transcriptional regulator and a high-order state with its effector function in membrane stress.12, 13
We previously showed that stable and functional GFP-tagged PspA localises at cell poles and also in mobile lateral complexes.17 The static polar complexes were correlated to a PspA regulatory function and the lateral complexes with PspA effector function.17
Samples for imaging were prepared by culturing cells of the strain above17 in M63 medium with glucose (0.4%) and ampicillin (100 μg/ml) to mid-exponential phase at 30 °C where GFP-PspA is expressed at physiological levels by leaky expression from a pBAD plasmid. A drop of the culture was then placed on a polylysine treated glass coverslip which was placed directly onto the microscope stage. Most non-adherent cells were washed off by pipetting off the drop of culture and re-wetting the sample with fresh media. The microscope was a custom-built inverted epifluoresence microscope. Excitation was achived with the 488 nm line of an argon ion laser (35LAP321-230, Melles Griot, USA) and the emission signal was collected using a EMCCD camera (Coolview EM 1000, Photonic Sciences, UK). The emission signal was selected using a 505DRLP dichroic mirror and 535AF45 bandpass filter (Omega Optical Filters, USA). Photobleaching was achieved by continuous excitation of the sample. The camera was set to collect 1000 500 × 500 pixel frames at a rate of 25 frames/s to obtain a photobleaching sequence. The power of the excitation beam before entering the microscope was ~ 3 mW and the field of view was approximately 40 μm × 40 μm.
As shown in the inset of Fig. 2A, square regions of interest (typically 8 × 8 pixels) were drawn around immobile spots. The intergrated pixel values within of each region was recorded for successive frames to produce photobleaching traces. The photobleaching step size for each trace was determined as stated above. The number of fluorophores present in each spot was then calculated as the quotient of the background-subtracted initial fluorescence intensity and the photobleaching step.
Fig. 2.

Determination of the stoichiometry of PspA complexes in living E. coli cells by single molecule fluorescence photobleaching analysis. The stoichiometry of individual complexes is defined as (Ii - If)/Is. (A) A representative photobleaching trace of a single PspA complex (black) and the corresponding filtered trace (red) based on Chung-Kennedy algorithm. (B) Power spectrum of the PDDF of the filtered trace. The inset shows the distribution of photobleaching step size of 127 PspA complexes measured. The red curve is a Gaussian fit to the distribution.
127 traces were obtained and analysed. The majority of these were from static foci within the polar region. One example is shown as Fig. 2A. The distribution of step sizes obtained from the traces is shown in the inset of Fig. 2B. The mean photobleaching step size is ~ 2500 counts. The distribution of stoichiometry of 127 PspA complexes is shown in Fig. 3. The distribution best fits a 4-parameter Burr function (see supporting information). The distribution peaks at 6.3 with FWHM of 5.6. This peak stoichiometry of GFPs per spot corresponds well to the gel filtration data from Joly et al.13 where six subunits of PspA were bound to the hexameric PspF. The minimum stoichiometry observed was 3 molecules per spot and the maximum was 37. It should be noted that the optical resolution of our imaging system does not allow us to distinguish true GFP-PspA oligomers from clusters of disordered GFP-PspA monomers or indeed a mixture of monomers, dimers and higher-order oligomers in close proximity (i.e. less than the spatial resolution limit). However, the stoichiometric agreement with gel filtration data13 makes it likely that the immobile PspA does indeed form a complex containing 6 PspA subunits in vivo. The good population of size classes in the histogram (Fig. 3) between 3 and 18 is also indication that the formation of PspA-rich regions of cell membrane may be a dynamic process involving monomeric and other low-order oligomers of PspA. Whether or not these regions contain higher-order oligomers, similar to those seen of the cyanobacterial PspA homolog, VIPP118 remains to be proven conclusively.
Fig. 3.
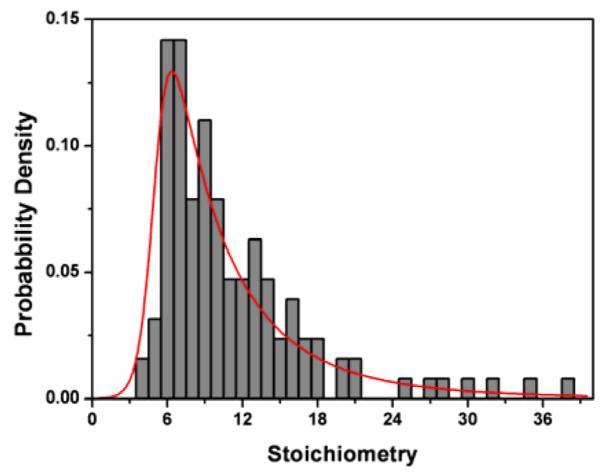
Stoichiometry distribution of 127 PspA complexes. The distribution was fit to a 4-parametre Burr function. The fitted distribution peaks at 6.3 with a FWHM of 5.6, indicating PspA may exist as a hexamer in cell membrane.
The stoichiometry of mobile spots is yet to be determined as this requires implementation of a reliable algorithm which circumvents the varying celluar background in different locations. However, we now have an in vivo method for testing the hypothesis that the oligomeric state of PspA relates to its function as we expect that if this is correct, implementation of the stress regime or indeed removing interacting partners will affect the distribution of GFP-PspA stoichiometries.
This study illustrates clearly the effectiveness of this analytical method in determining in-vivo stoichiometry of proteins in the bacterial membrane, as well as the care which must be taken in interpreting the results. A comparison of this work to other similar studies19, 20 shows that the stoichiometries obtained must be interpreted in the context of membrane compartmentalisation and the a priori biochemical and biological knowledge of the proteins in question.
Because our method uses epi-illumination, it is not limited to study the membrane protein alone, it should be capable of analysing stoichiometry of protein complexes inside living cells, for example in the bacterial nucleoid or nuclei of eukaryotic cells. We also expect that super-resolution fluorescence imaging techniques such as PALM (photoactivated localisation microscopy) or STORM (stochastic optical reconstruction microscopy21) may provide further alternatives to measure the stoichiomtery of immobile protein complexes in living cells since the numbers and positions of individual subunits labelled by photoswitchable fluorescence protein or dyes at a given location can be precisely determined.
Supplementary Material
Acknowledgments
This work was supported by the Biotechnology and Biosciences Research Council (UK). We thank David Klenerman and Mark Leake for discussions.
Footnotes
Electronic Supplementary Information (ESI) available: PspA plasmid, Chung-Kennedy algorithm, pairwise difference distribution function and Burr distribution. See DOI: 10.1039/b000000x/
Notes and references
- 1.Wallrabe H, Elangovan M, Burchard A, Periasamy A, Barroso M. Biophys. J. 2003;85:559. doi: 10.1016/S0006-3495(03)74500-7. [DOI] [PMC free article] [PubMed] [Google Scholar]
- 2.Raicu V, Stoneman MR, Fung R, Melnichuk M, Jansma DB, Pisterzi LF, Rath S, Fox M, Wells JW, Saldin DK. Nat. Photonics. 2009;3:107. [Google Scholar]
- 3.Chen Y, Müller JD. Proc. Natl. Acad. Sci. USA. 2007;104:3147. doi: 10.1073/pnas.0606557104. [DOI] [PMC free article] [PubMed] [Google Scholar]
- 4.Wu B, Chen Y, Müller JD. Proc. Natl. Acad. Sci. USA. 2010;107:4117. doi: 10.1073/pnas.0905670107. [DOI] [PMC free article] [PubMed] [Google Scholar]
- 5.Digmana MA, Wiseman PW, Choic C, Horwitz AR, Grattona E. Proc. Natl. Acad. Sci. USA. 2009;106:2170. doi: 10.1073/pnas.0806036106. [DOI] [PMC free article] [PubMed] [Google Scholar]
- 6.James JR, White SS, Clarke RW, Johansen AM, Dunne PD, Sleep DL, Fitzgerald WJ, Davis SJ, Klenerman D. Proc. Natl. Acad. Sci. USA. 2007;104:17662. doi: 10.1073/pnas.0700411104. [DOI] [PMC free article] [PubMed] [Google Scholar]
- 7.Ulbrich MH, Isacoff EY. Nat. Methods. 2007;4:319. doi: 10.1038/NMETH1024. [DOI] [PMC free article] [PubMed] [Google Scholar]
- 8.Das SK, Darshi M, Cheley S, Wallace MI, Bayley H. ChemBioChem. 2007;8:994. doi: 10.1002/cbic.200600474. [DOI] [PubMed] [Google Scholar]
- 9.Ying LM, Xie SX. J. Phys. Chem. B. 1998;102:10399. [Google Scholar]
- 10.Leake MC, Chandler JH, Wadhams GH, Bai F, Berry RM, Armitage JP. Nature. 2006;443:355. doi: 10.1038/nature05135. [DOI] [PubMed] [Google Scholar]
- 11.Chung SH, Kennedy RA. J. Neurosci. Meth. 1991;40:71. doi: 10.1016/0165-0270(91)90118-j. [DOI] [PubMed] [Google Scholar]
- 12.Kobayashi R, Suzuki T, Yoshida M. Mol. Microbiol. 2007;66:100. doi: 10.1111/j.1365-2958.2007.05893.x. [DOI] [PubMed] [Google Scholar]
- 13.Joly N, Burrows PC, Engl C, Jovanovic G, Buck M. J. Mol. Biol. 2009;394:764. doi: 10.1016/j.jmb.2009.09.055. [DOI] [PMC free article] [PubMed] [Google Scholar]
- 14.Elderkin S, Bordes P, Jones S, Rappas M, Buck M. J. Bacteriol. 2005;187:3238. doi: 10.1128/JB.187.9.3238-3248.2005. [DOI] [PMC free article] [PubMed] [Google Scholar]
- 15.Elderkin S, Jones S, Schumacher S,J, Studholme D, Buck M. J. Mol. Biol. 2002;320:23. doi: 10.1016/S0022-2836(02)00404-7. [DOI] [PubMed] [Google Scholar]
- 16.Hankamer BD, Elderkin SL, Buck M, Nield J. J Biol Chem. 2004;279:8862. doi: 10.1074/jbc.M307889200. [DOI] [PubMed] [Google Scholar]
- 17.Engl C, Jovanovic G, Lloyd LJ, Murray H, Spitaler M, Ying LM, Errington J, Buck M. Mol. Microbiol. 2009;73:382. doi: 10.1111/j.1365-2958.2009.06776.x. [DOI] [PMC free article] [PubMed] [Google Scholar]
- 18.Fuhrmann E, Bultema JB, Kahmann U, Rupprecht E, Boekema EJ, Schneider D. Mol. Biol. Cell. 2009;20:4620. doi: 10.1091/mbc.E09-04-0319. [DOI] [PMC free article] [PubMed] [Google Scholar]
- 19.Lenn T, Leake MC, Mullineaux CW. Mol. Micobiol. 2008;70:1397. doi: 10.1111/j.1365-2958.2008.06486.x. [DOI] [PubMed] [Google Scholar]
- 20.Leake MC, Greene NP, Godun RM, Granjon T, Buchanan G, Chen S, Berry RM, Palmer T, Berks BC. Proc. Natl. Acad. Sci. USA. 2008;105:15376. doi: 10.1073/pnas.0806338105. [DOI] [PMC free article] [PubMed] [Google Scholar]
- 21.Huang B, Bates M, Zhuang XW. Ann. Rev. Biochem. 2009;78:993. doi: 10.1146/annurev.biochem.77.061906.092014. [DOI] [PMC free article] [PubMed] [Google Scholar]
Associated Data
This section collects any data citations, data availability statements, or supplementary materials included in this article.