

Abstract
Efficient and sufficient incorporation of protein flexibility into docking is still a challenging task. Docking to an ensemble of protein structures has proven its utility for docking, but using a large ensemble of structures can reduce the efficiency of docking and can increase the number of false positives in virtual screening. In this paper, we describe the application of our new methodology, Limoc, to generate an ensemble of holo-like protein structures in combination with the relaxed complex scheme (RCS), to virtual screening. We describe different schemes to reduce the ensemble of protein structures to increase efficiency and enrichment quality. Utilizing experimental knowledge about actives for a target protein allows the reduction of ensemble members to a minimum of three protein structures increasing enrichment quality and efficiency simultaneously.
Keywords: Ensemble docking, frame selection, protein flexibility, relaxed complex scheme, Limoc, AutoDock Vina
Introduction
Protein flexibility plays a key role in molecular recognition between a ligand and its target receptor.1 Levels of protein flexibility range from small scale changes such as side-chain rotamer changes to large scale changes such as hinge-bending motions and conformational changes in loop regions.2-5 Recent approaches for improving docking methods have focused on incorporating both small and large scale protein flexibility in search and scoring procedures.4, 6-12 One widely used methodology aims to include backbone and side-chain flexibility into docking by using an ensemble of protein structures (EPS) as docking templates.7 The templates are generated using methods such as molecular dynamics (MD), Monte-Carlo (MC), elastic network model (ENM)13, 14 simulations, or normal-mode analysis (NMA).
Ensemble docking studies15 have found that using an EPS with only a few protein conformations can increase the enrichment in virtual screening, but using a very large EPS often hurts docking performance. The drop in virtual screening performance is due to the inherent inaccuracy of the simplistic scoring methods used in docking. With an increasing number of protein conformations, the potential to generate non-native protein-ligand conformations also increases. Thus, using inaccurate scoring methods in virtual screening may result in an increased potential to generate high ranked decoys and thereby reduce the enrichment quality. Thus, in ensemble docking it is important to consider how many and which protein conformations should be used.
Different strategies have been developed to identify a subset of protein structures that provides a compromise between the amounts of protein flexibility incorporated into docking and the number of structures considered. Amaro et al.16 used methods such as hierarchical clustering based on pairwise root-mean square-deviations (RMSD) between different EPS members to reduce the initial EPS generated by MD simulations to a structurally diverse subset of protein structures. Armen et al.17investigated different strategies to limit the modeled protein flexibility to the fewest degrees of freedom necessary to adequately represent the experimentally observed flexibility (i.e. binding-site side chains and two flexible loops in the studied test case). Bolstad et al.18 developed a selection strategy based on the conservation of the relative orientations of a core of amino acids critical for ligand binding. Atoms of binding site residues that have a conserved relative position in experimentally determined complex structures of the same protein with different bound ligands were manually identified. Distances between the identified atoms were computed for all MD snapshots and compared with the conserved distances in the various X-ray structures. Only MD snapshots that approximately preserve the interatomic distances between the selected protein atoms were chosen as members of the EPS used for docking. This procedure allowed the reduction of the size of the initial EPS, increasing the e ciency and ranking accuracy of ensemble docking.
The relaxed complex scheme (RCS)19, 20 can be viewed as an extension of ensemble docking where MD simulations of the apo form of the protein are used to generate an EPS. Sequential docking to the EPS is performed, and for each ligand, similar binding poses are clustered across all EPS protein templates. The scores of all members of a cluster are averaged to approximate the thermodynamic states of ligand binding. Compared to using individual scores, the average produces a more accurate estimation of the free energy of binding.19, 20
We recently performed docking studies utilizing RCS to an EPS generated by MD simulations on protein systems that involve small-scale conformational changes between the apo and holo structures (RMSD < 1 Å).21 Although the apo form of the protein is typically used to generate the EPS for the RCS scheme, we observed that docking to an EPS generated by short MD simulations with bound ligands outperformed docking to the EPS generated by long MD simulations on the apo form of the protein. We concluded that there are either too many alternative protein conformations generated by the long MD simulations, making the identification of the holo-like structures relevant for docking difficult, or that ligand binding was required to induce the holo conformation of the protein.
These results led us to the development of the ligand-model concept (Limoc), a method that is capable of sampling protein conformations that are relevant for binding structurally diverse ligands.21 In this method, MD simulations are performed with a dynamically changing set of restrained functional groups in the binding site of the protein, essentially representing a large hypothetical ensemble of different chemical species binding to the same target protein. Starting from an apo structure, the ligand-model approach is used to derive an EPS used for docking. The combination of Limoc and RCS has been successfully applied to the prediction of binding modes and affinities of structurally diverse compounds. However, ensemble docking using large EPS and RCS analysis requires significantly more computational resources compared to virtual screening performed on a single static protein structure.
In this manuscript, we want to address the question whether the reduction of ensemble size can improve efficiency and enrichment quality of virtual screening using the Limoc-RCS scheme. We investigated three different strategies to select a subset of protein structures from the original EPS. First, we clustered similar frames based on their pair-wise RMSD. Second, we developed a training process in which protein structures are selected based on their performance to reproduce the experimentally known binding mode of a small set of diverse ligands. Third, frames are selected based on their performance to distinguish actives and decoys using a small training set of ligands.
Material and Methods
Datasets and target proteins
We selected five protein systems as targets for the virtual screening studies: Thrombin (PDB code: 2UUF), estrogen receptor alpha (ERa, 1GWR), cyclin-dependent kinase 2 (CDK2, 1HCL), acetylcholine esterase (AchE, 1EA5) and Pneumocystis carinii dihydrofolate reductase (DHFR, 1DAJ). The protein structures chosen represent the apo (ligand-free) form for thrombin, CDK2, and AChE. As there is no apo structure for ERa and Pneumocystis carinii DHFR in the PDB available, we used a holo structure for our screening studies. The side-chain conformations, tautomers and protonation states of ASN, GLN and HIS were adjusted using the Reduce program.22 Protein structures were subsequently minimized using Amber 10.23 The dictionary of useful decoys (DUD)24 was used to perform the virtual screening studies. For each active in DUD a set of decoys with similar physical properties but dissimilar topology is added to the dataset of compounds used for screening. To reduce computational time, a subset of DUD DHFR ligands was used in this study by randomly selecting one fourth of the total number of actives and decoys. For AChE the dataset used in our study contains 107 actives and 3892 decoys, for CDK2 72 and 2072, for ERa 67 and 2570, for DHFR 102 and 2100, and for thrombin 72 and 2456.
Docking
All docking simulations were performed using AutoDock Vina.25 Protein and ligand preparation for docking was performed using our in-house PyMOL plugin that automatically calls the programs prepare_receptor4.py and prepare_ligand4.py that are part of AutoDockTools.26 To define the search volume for AutoDock Vina, the apo form of a protein is aligned to several holo forms of the same protein and then a cubic box of 25 Å x 25 Å x 25 Å is placed around the co-crystallized ligands of the associated holo forms. Standard docking settings were used and the ten energetically most favorable binding poses were outputted.
Limoc
MD simulations with Limoc21 were used to generate an EPS for ensemble docking and RCS analysis. In this study, we started from the apo protein structure (except for ERa and DHFR). First, the binding site is defined in Limoc by specifying residues within a given radius (default is 5Å) of any atom of the chosen ligand. Then the solvent accessible surface (SAS) of the binding site is computed. Physical-chemical probes representing the ligand model are evenly distributed onto the SAS with properties that are complementary to the nearest binding pocket residue. In the current version of Limoc, we consider three types of probes: hydrogen-bond donor, acceptor and hydrophobic group. To sample the interactions of protein residues with different hydrogen-bonding groups from different ligands, we employed the local enhanced sampling (LES) method.27 To simulate the protein adapting to ligands differing in size and shape, we use locally steered MD simulations to enlarge or decrease the size of the ligand model. The size and direction of movement of the binding pocket residues is determined by the first principle component derived from analyzing the covariance matrix of a 50ps ligand free simulation trajectory. The positions of the ligand model probes are harmonically restrained with a force constant four times greater in the direction parallel to the SAS than perpendicular to the SAS. The steered MD is performed in both directions (locally expanding and reducing the size of the ligand model). The total simulation length (including all induced fit scenarios) was 20 ps using a time step of 1 fs. The Amber03 force field was used and solvation was modeled by a water cap of 25 Å radius. For additional details on Limoc and its default settings we refer to our recent publication on this method.21
Relaxed complex scheme
The MD trajectories using Limoc were clustered using quality threshold (QT) clustering.28 The RMSD criterion was adjusted automatically to generate 180–250 distinct protein conformations, defining the initial EPS. Based on this EPS, different frame selection methods were used to derive sub-ensembles with 1, 2, 3, 5, 10, 20, 50 protein structures. AutoDock Vina was used to perform docking to the full initial ensemble and each sub-ensembles. The top-10 ranked binding poses from each individual docking simulation were outputted and considered for subsequent clustering. The binding poses were clustered using QT clustering (1 Å cluster radius). For the full ensemble (180-250 frames) and the 50-, 20-sub-ensembles, clusters with less than 15, 5, 3 members were discarded, respectively. The predicted score for a binding-mode cluster i, ⟨Gi⟩, was calculated based on the scores of all binding modes j of a cluster i, ΔGj, using
| (1) |
where pi,j is the probability of identifying a pose j in cluster i, and ΔGj is the score of binding pose j. As an alternative scheme to rank the docked ligands, we used the overall lowest score of any binding pose of a ligand.
Frame selection using RMSD
To test the impact of reducing the size of the EPS on virtual screening results using the Limoc-RCS scheme, we used three different methods to select frames from the full ensemble of 180–250 protein structures. In the first scheme, QT clustering is performed on the full EPS using the g_cluster program which is part of the Gromacs 4.5 software suite. The heavy atom RMSD was adjusted to generate 1, 2, 3, 5, 10, 20, 50 clusters. The centroid of each cluster was used as representative structure in the resulting sub-ensemble.
Frame selection by training on experimentally known binding modes
In the second scheme for reducing the size of the original EPS, several holo forms of each protein system were retrieved from the PDB and up to three structurally diverse ligands are chosen based on visual comparison for subsequent training purposes. The selected ligands were docked to the original EPS using AutoDock Vina and ten poses were retrieved from docking to each member of the EPS. RMSD between the predicted docking poses and the experimentally known binding mode was calculated and the docking pose with the smallest RMSD was identified for each EPS member. The sum of lowest RMSD values over all utilized ligands (one to three ligands in our study) was computed and used to rank protein structures in the original EPS. Sub-ensembles were generated from the top ranked structures. As an example, assume that three ligands A, B, and C are docked to two different protein structures, yielding smallest RMSD values among the top-10 ranked poses for the two protein structures of 1.4 Å, 2.4 Å, 2.7 Å, and 1.8 Å, 1.7 Å, 2.3 Å, respectively. Taking the sum of those RMSD values (6.5 Å vs. 5.8 Å) ranks the second protein structure before the first one.
Frame selection by training on enrichment of small subsets
In the third scheme for reducing the size of the full EPS, structures are selected based on the degree of separation achieved between actives and decoys in a virtual screen. Experimentally known actives are mixed with a set of decoy ligands to build a training set; 10, or 20 actives and a corresponding number of decoys were randomly selected from the DUD dataset to construct the training subsets for each protein system. The active:decoy ratio of subsets was kept the same as the ratio of the complete DUD set for each protein system. Mini-enrichment of each ligand training subset was performed using ensemble docking and RCS. The lowest docking score of all binding pose clusters, k, for a ligand, l, was identified for each protein structure, p:
| (2) |
Third, the average score over all actives and decoys is computed for each protein conformation p:
| (3a) |
| (3b) |
Finally, the difference between and was calculated. The different members of the EPS are ranked according to those differences, and the structures with largest negative difference are selected for inclusion in a sub-ensemble.
Measures of virtual screening success
The following standard descriptors for enrichment are utilized to measure the success of our virtual screening studies: The enrichment factors of actives at 1% (EF1), 10% (EF10) and 20% (EF20) of ranked decoys, and the area-under-the-curve (AUC) of the ROC curve displaying fraction of ranked actives at a given fraction of ranked decoys. A slight modification of the AUC value is computed to emphasize the importance of early enrichment in datasets that typically contain a majority of decoys: The logAUC value is the area-under-the-curve using a logarithmic scale of the x-axis (fraction of ranked decoys).
Results and Discussion
Enrichment using full ensemble
Introducing protein flexibility by ensemble docking can enhance correct prediction of native binding poses and quantification of ligand binding affinities,7, 12 but can also result in an increased number of false positives in virtual screening.15 The latter can result in a poor enrichment performance compared to using a single static structure for virtual screening. RCS attempts to mitigate this drawback by clustering similar poses and averaging their scores.
Testing RCS with our Limoc-generated EPS on five protein systems (Figure 1 and Table 1) revealed that, compared to virtual screening using a single protein structure, using the full EPS resulted in improved enrichment for two protein systems (thrombin and DHFR) and gave comparable results for the other three systems (AChE, ERa, CDK2). The AUC is similar for AChE (EPS: 0.58, single structure: 0.61), CDK2 (0.56, 0.56), and ERa (0.82, 0.82), but significantly larger if utilizing the full EPS for DHFR (0.85, 0.71) thrombin (0.71, 0.40).
Figure 1.

Docking enrichment plots for five protein systems using DUD. The fraction of actives ranked by docking score (y-axis) is plotted against the fraction of ranked decoys (x-axis; logarithmic scale). Both, results derived from docking to the Limoc ensemble (LE; blue line) and a static apo/holo (red) structure, are shown. Theoretical results from random selection (black dots) are shown for comparison.
Table 1.
Indicators of enrichment quality for five systems utilizing the full EPS generated using Limoc (LE = Limoc Ensemble) and a static apo or holo protein structure: EF1 (percentage of ranked actives at 1% of the ranked decoys), EF10 (at 10% of the ranked decoys), EF20 (at 20% of the ranked decoys), AUC (area under the curve) and log-AUC (area under the curve using logarithmic scale for the x-axis).
| AChE | CDK2 | DHFR | ERa | Thrombin | ||||||
|---|---|---|---|---|---|---|---|---|---|---|
| apo | LE | apo | LE | apo | LE | holo | LE | apo | LE | |
| EF1 | 2.80 | 3.70 | 6.90 | 5.60 | 8.82 | 12.8 | 37.3 | 40.3 | 5.60 | 8.30 |
| EF10 | 2.80 | 1.40 | 2.78 | 2.64 | 2.25 | 4.80 | 6.27 | 5.52 | 1.39 | 3.89 |
| EF20 | 2.43 | 1.45 | 1.95 | 2.10 | 2.11 | 3.68 | 3.58 | 3.16 | 0.97 | 2.99 |
| AUC | 0.61 | 0.58 | 0.56 | 0.56 | 0.71 | 0.85 | 0.82 | 0.82 | 0.40 | 0.71 |
| logAUC | 0.22 | 0.19 | 0.23 | 0.23 | 0.27 | 0.38 | 0.53 | 0.52 | 0.14 | 0.30 |
We also compared the enrichment plots using the EPS with and without clustering similar poses and averaging their scores (see Supporting Information, Figure S1). Interestingly, only a slight improvement in enrichment for DHFR (0.85 compared to 0.82 for using lowest overall score) and thrombin (0.71 compared to 0.69) is observed after clustering and averaging the scores of similar poses. No differences could be identified for the other three protein systems. In summary, averaging seems to have only a small effect on the enrichment quality for the five protein systems studied.
The improved enrichment for thrombin is consistent with the increased binding pose prediction quality previously observed using Limoc-RCS.21 However, the same trend was not observed for AChE, where increased binding pose prediction quality21 didn’t translate into improved enrichment. Importantly, no significant reduction in enrichment performance was observed for any of the five protein systems.
Frame selection using RMSD
Although the inclusion of protein flexibility in the Limoc-RCS scheme shows some benefit for enrichment in virtual screening, it is computationally demanding, requiring several hours per ligand using AutoDock Vina on a dual quad-core-machine. Thus, it is impractical to use a large EPS for virtual screening of tens to hundreds of thousands of ligands. Reducing the number of protein structures in the ensemble is essential for efficient ensemble docking. The most naive way is to generate sub-ensembles by clustering the full EPS based on their pair-wise RMSD values and use the resulting cluster centers as the sub-ensemble for virtual screening.
Figure 2 displays the enrichment using the most diverse ensemble members by QT clustering. With the exception of DHFR and for very small number of frames in the thrombin system, there is no significant drop in enrichment in comparison with the full EPS (Figure 3, green lines). This is consistent with the results in the previous section, where no significant difference in enrichment between static docking and docking using Limoc-RCS was observed for AChE, ERa, and CDK2.
Figure 2.


Docking enrichment plots for five protein systems using DUD. The fraction of actives ranked by docking score (y-axis) is plotted against the fraction of ranked decoys (x-axis; logarithmic scale). Results docking to the full Limoc EPS (LE; red) and most diverse sub-ensembles with 20 (yellow), 5 (green), and 2 (purple) members are shown.
Figure 3.

AUC as a function of the number of members in the sub-ensembles of protein structures. The results for three different selection schemes are presented: Selection by diversifying the EPS using pairwise RMSD values (yellow line), by training using binding-pose reproduction of three different co-crystallized ligands (red), and by optimizing the difference in scores between a small set of known actives and decoys (using 20 actives: blue; 10 actives: green).
Frame selection by training on experimentally known binding modes
Although clustering for EPS generation is promising, in some protein systems this method resulted in reduced enrichment quality. Motivated by the studies of Anderson and co-workers18 who used visual inspection of experimentally known holo structures of DHFR to guide the ensemble selection process, we hypothesized that automatic selection using a small set of experimental data may increase the accuracy of Limoc-RCS screening. In a first scheme, we used a training set composed of 1-3 holo structures for structure selection. The training set ligands were docked to all members of the EPS and the members that are in best agreement with the experimentally determined binding mode were selected for sub-ensembles. Figures 3 and 4 display the results for using a training set of three ligands. Results using one or two ligands are shown in Supporting Information, Figure S2. Similar to the enrichment results for using the diversified sub-ensembles (see previous section) no significant change in enrichment was observed for AChE, CDK2 and ERa. For DHFR the decrease in enrichment quality was reduced compared to the diversified subsets but remained the same for thrombin. In summary, no significant improvement in enrichment was observed between the RMSD based selection scheme and selection scheme based on binding-pose training.
Figure 4.

Docking enrichment plots for five protein systems using DUD. The fraction of actives ranked by docking score (y-axis) is plotted against the fraction of ranked decoys (x-axis; logarithmic scale). Results docking to the full Limoc EPS (LE; red line) and sub-ensembles with 20 (yellow), 5 (green), and 2 (purple) members are shown. Members of the sub-ensembles were selected based on their potential to predict known binding poses correctly.
Frame selection by training on enrichment of small subsets
Although no significant improvement in enrichment was observed for docking to selected members of the EPS using training of known binding modes, we question whether utilizing training data that is strongly related to the real experiment, i.e. virtual screening, will increase enrichment of the full DUD dataset. Sometimes medicinal chemists gather experimental knowledge about several actives before performing a full (virtual) high screening study. However, this useful information is seldom included in the virtual screening procedure. We tested if selecting structures from the EPS based on a mini-enrichment study using only a few actives, might improve the overall virtual screening quality utilizing sub-ensembles. 10 or 20 actives with the same ratio of actives to decoys, both randomly picked from the DUD dataset, were used in an initial enrichment experiment. Members of the EPS were selected based on their ability to separate actives from decoys using scoring. These sub-ensembles were used for virtual screening of the full ligand dataset not including the actives and decoys utilized in the training process. Figures 3, 5 and Supporting Information, Figure S3 show a general positive trend in using those sub-ensembles, increasing or at least not reducing enrichment compared to the virtual screening results on the full EPS. As expected intuitively, utilizing a larger set of compounds for frame selection (20 vs. 10 actives) typically resulted in a more stable increase of enrichment. For AChE, the AUC value increases with decreasing size of sub-ensemble with the larger training set producing a stronger trend. For DHFR the same positive trend of reducing ensemble size was observed for both training set sizes. For CDK2 and ERa no significant decrease or increase in AUC with reducing ensemble size was observed. For thrombin, using a training set containing 20 actives results in a stable AUC vs. ensemble-size curve. Although the AUC values of a training set with 10 actives decrease for very small ensemble sizes (one or two frames), the curve demonstrates stability for sub-ensembles with 3-50 frames. This displays a significant improvement over the previously tested frame-selection schemes. In general, using 20 actives yields stable enrichment for small number of selected protein structures and with some limitations this observation can also be extended to the use of 10 actives. For several systems, the AUC values are even increasing with number of frames.
Figure 5.

Docking enrichment plots for five protein systems using DUD. The fraction of actives ranked by docking score (y-axis) is plotted against the fraction of ranked decoys (x-axis; logarithmic scale). Results docking to the full Limoc EPS (LE; red line) and sub-ensembles with 20 (yellow), 5 (green), and 2 (purple) members are shown. Members of the sub-ensembles were selected based on their potential to actives from decoys of a small sub-set of ligands from the DUD dataset. The results for using 20 actives are displayed.
Comparison of three frame-selection methods
In the previous sections, we have qualitatively compared the results of three methods for reducing the number of structures in the EPS. Figure 3 provides the first quantitative assessment how the AUC changes as a function of sub-ensemble size. To extend this analysis additional quantitative descriptors for enrichment quality are discussed in this section: EF1, EF10, EF20, logAUC. Graphs for each descriptor as a function of sub-ensemble size were plotted similar to Fig. 3 and linear regression was derived for all quantitative descriptors of virtual screening performance. Slopes of the linear regression models are displayed in Table 2 and Supporting Information, Table S4. It should be noted that the graphs of descriptor versus sub-ensemble size doesn’t necessarily always follow a linear functional form as can be easily observed in Fig. 3. It is not our aim in this analysis to derive optimal regression models but rather to provide trends for how the descriptors change as a function of sub-ensemble size for the three different frame-selection methods. Table 2 demonstrates that among the three selection methods, training on known actives yields the strongest trend for increasing enrichment performance when reducing the number of structures in the sub-ensemble (negative sign), whereas for the other two selection schemes (diversification and training on binding modes) a negative trend (reduced enrichment with reducing sub-ensemble size) was observed for several protein systems.
Table 2.
Slopes of linear regression models on quantitative indicators for enrichment quality using different training methods (diverse = diversification of EPS using pairwise RMSD, l3 = selection of EPS members based on binding pose predictions of three ligands, mini20/min10 = selection of EPS members based on set of 20/10 known actives and decoys). Negative regression (blue color) means increasing enrichment quality with reducing number of EPS members; positive regression in red.
| diverse | Thrombin | DHFR | ERa | CDK2 | ACHE |
| EF1 | 0.014 | 0.018 | 0.007 | 0.004 | 0.000 |
| EF10 | 0.012 | 0.080 | −0.031 | 0.019 | −0.009 |
| EF20 | 0.053 | 0.103 | −0.039 | 0.041 | −0.032 |
| AUC | 0.041 | 0.047 | −0.018 | −0.011 | −0.008 |
| LogAUC | 0.011 | 0.040 | −0.018 | −0.011 | −0.008 |
| l3 | Thrombin | DHFR | ERa | CDK2 | ACHE |
| EF1 | 0.023 | 0.020 | 0.025 | −0.023 | 0.000 |
| EF10 | 0.054 | 0.037 | 0.007 | −0.030 | −0.018 |
| EF20 | 0.113 | 0.063 | 0.000 | 0.006 | −0.051 |
| AUC | 0.066 | 0.016 | 0.001 | 0.000 | −0.013 |
| LogAUC | 0.037 | 0.020 | 0.011 | −0.013 | −0.013 |
| mini20 | Thrombin | DHFR | ERa | CDK2 | ACHE |
| EF1 | −0.002 | −0.030 | 0.046 | 0.003 | 0.001 |
| EF10 | 0.018 | −0.088 | −0.031 | 0.041 | −0.063 |
| EF20 | 0.024 | −0.060 | −0.048 | 0.055 | −0.053 |
| AUC | −0.008 | −0.022 | −0.025 | 0.001 | −0.021 |
| LogAUC | −0.001 | 0.017 | −0.007 | 0.011 | −0.022 |
| mini10 | Thrombin | DHFR | ERa | CDK2 | ACHE |
| EF1 | −0.026 | −0.021 | −0.008 | 0.005 | −0.005 |
| EF10 | 0.008 | −0.088 | −0.034 | 0.002 | −0.041 |
| EF20 | 0.034 | −0.060 | −0.042 | 0.040 | −0.048 |
| AUC | 0.018 | −0.004 | 0.009 | −0.002 | −0.013 |
| LogAUC | −0.009 | −0.016 | −0.015 | 0.006 | −0.013 |
Structural and energetic analysis
In this section we aim to further discuss two observations made throughout our studies: First, why do DHFR and thrombin in particular show improved enrichment quality using the Limoc ensemble compared to docking to a single apo or holo structure? Second, using the scheme in which protein structures are chosen that are able to separate actives from decoys in pre-screening enrichment studies on a small sub-set of ligands, why do DHFR and AChE show most consistent improvement among all protein systems using a small number of selected protein structures (cf. Table 2).
To address the second question, we computed the difference between and for all protein structures p. The cumulative probability over all protein structures is shown in Figure 6. Negative values in the plot correspond to protein structures for which, on average, actives are better ranked (more negative score) than decoys. DHFR (Figure 6, green dashed line) displays a large tail towards negative score differences, and using virtual screening of a subset of actives for protein structure selection, we were able to select protein structures from this tail (Figure 6, green shaded region). By selecting protein structures within the tail region, there is a larger separation distinguishing actives from decoys which ultimately leads to higher enrichment. ERa (cyan) also displays a long tail with negative score differences, however, it should be noted that all structures have a score difference smaller than -0.75. Thus, any selection of protein structures results in an overall good enrichment performance, and selecting few ERa protein structures doesn’t improve enrichment quality with the same significance as for DHFR. The reason why AChE shows significant improvement, when selecting a few protein structures, is that only about 10% of all protein structures display a slightly negative score difference (Figure 6, blue dashed line). Thus, the whole Limoc ensemble includes many structures which actually favor decoys over actives. Consequently, we observe poor enrichment for AChE using the whole Limoc ensemble (Figure 1), but selecting the few protein structures with a negative score difference (Figure 6, blue shaded region) can actually results in increased enrichment performance (Figure 5 and Table 2).
Figure 6.

Cumulative distribution of protein structures as a function of the difference between and . Distributions of all structures of a Limoc ensemble are displayed as dashed lines, the corresponding subpopulations of ten structures selected by training on subsets of actives are displayed as solid lines with transparent fillings. The difference between and for docking to a single apo or holo structure is displayed as vertical arrows below the x-axis including exact values.
To address the question, why DHFR and thrombin display improved enrichment when docking to the Limoc ensemble compared to docking to a single static protein structure, we performed a detailed analysis characterizing the structural changes of the protein relevant to ligand binding by comparing distances between residues of the binding site. This analysis is similar to that used in our previous paper on Limoc RCS docking.21 In detail, the backbone of each amino acid is represented by the Cα atom and one atom represents the side-chain of each residue (except glycine): Cβ for Ala, Nε for Arg, Cγ for Asn, Cγ for Asp, Sγ for Cys, Cδ for Gln, Cδ for Glu, Cγ for His, Cγ1 for Ile, Cγ for Leu, Cε for Lys, Sδ for Met, Cγ for Phe, Cγ for Pro, Oγ for Ser, Cβ for Thr, Cδ2 for Trp, Cζ for Tyr, and Cβ for Val. Distances dij are computed between all those representing atoms of the residues that directly interact with a diverse set of ligands in their bioactive conformations. In the thrombin system, for example, residues His57, Tyr60A, Trp60D, Lys60F, Leu99, Ile174, Asp189, Ala190, Cys191, Glu192, Ser195, Val213, Trp215, Gly216, Glu217, Gly219, and Gly226 were considered to directly interact with the ligands of the three selected PDB structures used for training on known binding modes. We then identified the ten protein structures for each system that displayed the largest negative difference between and . From these ten structures, we computed the range of distances for dij; the minimum dij,min and maximum dij,max value for each distance is identified. Two variables describing the deviations from the optimal range of in positive and negative direction were computed:
| (4a) |
and
| (4b) |
.
This separation into smaller and larger than optimal dij values is due to the assumption that values that are too small might not provide enough space for binding the ligand in this particular moiety of the binding site, whereas excessively large distances might not provide optimal interactions between ligand and protein, resulting in a shift to more unfavorable score values.
Using all protein structures of the Limoc ensemble we correlated the difference between and for each structure with and , to characterize the relative positions of amino acids in the binding site and their deviations from the best ten protein structures. We performed a multi-linear regression analysis for all protein systems using SAS software29 correlating and with the difference between and :
| (5) |
where are the regression coefficients. The results for all five protein systems are presented as Supporting Information S5. For thrombin, nine descriptors are identified in the multi-linear regression model with an overall regression coefficient of r2 = 0.66. The single descriptor d< (Cδ,Glu192 – Cα,Trp215) explains about 30% of the total variance in the score-difference data. This particular distance varies between 12.3 Å and 14.7 Å for the ten selected structures with the largest average score difference between actives and decoys. The same distance in the apo thrombin structure is 1.5 Å smaller than dij,min. This is the largest difference to dij,min or dij,max of any descriptor for any of the five protein system and may strongly contribute to the large difference in enrichment quality between docking to the Limoc ensemble and docking to the static apo structure.
In the context of the X-ray structure in two of the three selected protein structures of thrombin (1a4w, 1d3t; see Figure 7), the side-chain of Glu192 is oriented closer to the opposite site of the binding pocket (here represented by Trp215) and prevents certain classes of thrombin ligands from binding in their native conformation. This inward-pointing conformation of Glu192 is identified in the apo structure, whereas outward-pointing conformations are identified for the ten protein structures with largest difference between and . Thus, docking to the apo structure of thrombin will result in poor enrichment performance (cf. Figure 1).
Figure 7.
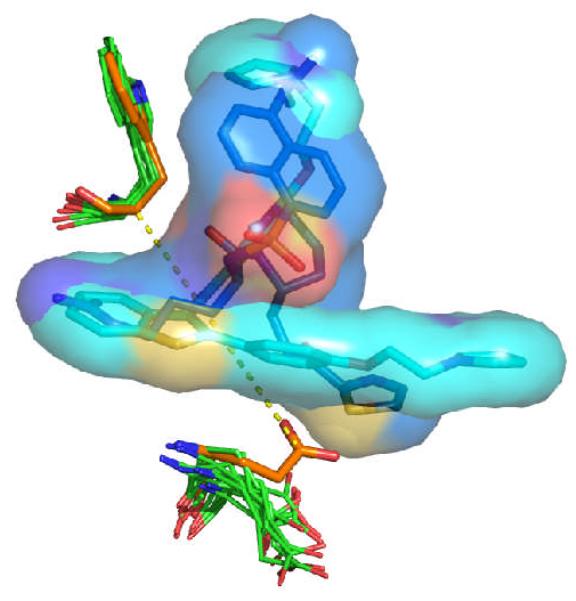
Comparison of the conformations of Glu192 and Trp215 in the apo structure of thrombin (carbon atoms colored in orange) and in the ten structures chosen from the Limoc ensemble with the largest deviation between average scores of actives and decoys (carbon atoms in green). Two representative thrombin ligands in their native binding pose from the PDB databank (1a4w, 1d3t) are displayed with carbon atoms colored in light and dark blue, respectively. Glu192 in the apo structure sterically overlaps with the two ligands. The distance between Cδ of Glu192 and Cα of Trp215 in the apo form of thrombin is shown as yellow dashed line.
Conclusions
We have presented three different schemes to automatically select protein structures as alternative templates for ensemble docking. The initial ensemble of protein structures was generated using our Limoc concept which is able to generate holo-like protein structures. In combination with AutoDock Vina and the RCS concept, we demonstrate that this methodology is capable of enriching datasets of compounds using virtual screening. Furthermore, we found that a balance can be achieved between the amount of protein flexibility incorporated into docking and the increased potential to generate false positives if too many template structures are considered in docking. If the protein structures optimal for virtual screening are selected by a feasible training process on experimental data, ensemble docking can be successfully performed on a very small number (3-5) of protein structures. The most successful selection method in our studies has been to choose protein structures that are able to separate actives from decoys in pre-screening enrichment studies on a small sub-set of ligands. As a consequence of selecting a small number of protein structures for ensemble docking, the efficiency of the screening process can be significantly improved. In the most successful scheme, 10-20 active ligands have to be identified experimentally, but no exact affinity data or knowledge on binding modes of these actives is necessary.
It should be noted that the scoring function of AutoDock Vina, used in our study, was optimized for the correct prediction of binding poses and not for enrichment experiments. Thus, scoring functions that are optimized for virtual screening might increase the observed enrichment rates. We further speculate, if a scoring function optimized in the context of the RCS scheme, considering protein flexibility and dynamics, has the potential to further improve enrichment quality. Research in this direction is ongoing in our lab.
Supplementary Material
ACKNOWLEDGMENT
We thank Laura Kingsley for critical reading of the manuscript. M.A.L. thanks the National Institutes of Health (GM085604 and GM092855) for funding the present research.
Footnotes
SUPPORTING INFORMATION PARAGRAPH. Enrichment performance of docking to the Limoc ensemble using the average score and lowest score; enrichment performance for docking to sub-ensembles obtained by frame selection by training using binding-pose reproduction of one, two and three different co-crystallized ligands; docking enrichment plots for docking to sub-ensembles obtained by frame selection by training on potential of protein structures to separate 10 actives from decoys; slopes of linear regression models on quantitative indicators for enrichment quality using selection of EPS members based on binding pose predictions of one and two ligands; results of multi-linear regression analysis correlating protein structure differences with average differences between scores for actives and decoys. This material is available free of charge via the Internet at http://pubs.acs.org.
REFERENCES
- 1.Teague SJ. Implications of protein flexibility for drug discovery. Nat.Rev.Drug Discov. 2003;2(7):527–541. doi: 10.1038/nrd1129. [DOI] [PubMed] [Google Scholar]
- 2.Bossart-Whitaker P, Carson M, Babu YS, Smith CD, Laver WG, Air GM. Three-dimensional Structure of Influenza A N9 Neuraminidase and Its Complex with the Inhibitor 2-Deoxy 2,3-Dehydro-N-Acetyl Neuraminic Acid. J.Mol.Biol. 1993;232(4):1069–1083. doi: 10.1006/jmbi.1993.1461. [DOI] [PubMed] [Google Scholar]
- 3.Taylor NR, Cleasby A, Singh O, Skarzynski T, Wonacott AJ, Smith PW, Sollis SL, Howes PD, Cherry PC, Bethell R, Colman P, Varghese J. Dihydropyrancarboxamides Related to Zanamivir:□ A New Series of Inhibitors of Influenza Virus Sialidases. 2. Crystallographic and Molecular Modeling Study of Complexes of 4-Amino-4H-pyran-6-carboxamides and Sialidase from Influenza Virus Types A and B. J.Med.Chem. 1998;41(6):798–807. doi: 10.1021/jm9703754. [DOI] [PubMed] [Google Scholar]
- 4.Carlson HA. Protein flexibility and drug design: how to hit a moving target. Curr.Opin.Chem.Biol. 2002;6(4):447–452. doi: 10.1016/s1367-5931(02)00341-1. [DOI] [PubMed] [Google Scholar]
- 5.Cavasotto CN, Abagyan RA. Protein flexibility in ligand docking and virtual screening to protein kinases. J.Mol.Biol. 2004;337(1):209–225. doi: 10.1016/j.jmb.2004.01.003. [DOI] [PubMed] [Google Scholar]
- 6.Teodoro ML, Kavraki LE. Conformational flexibility models for the receptor in structure based drug design. Curr.Pharm.Des. 2003;9(20):1635–1648. doi: 10.2174/1381612033454595. [DOI] [PubMed] [Google Scholar]
- 7.Totrov M, Abagyan R. Flexible ligand docking to multiple receptor conformations: a practical alternative. Curr.Opin.Struct.Biol. 2008;18(2):178–184. doi: 10.1016/j.sbi.2008.01.004. [DOI] [PMC free article] [PubMed] [Google Scholar]
- 8.Beier C, Zacharias M. Tackling the challenges posed by target flexibility in drug design. Expert Opin.Drug Discovery. 2010;5(4):347–359. doi: 10.1517/17460441003713462. [DOI] [PubMed] [Google Scholar]
- 9.Rao C, Subramanian J, Sharma SD. Managing protein flexibility in docking and its applications. Drug Discov.Today. 2009;14(7-8):394–400. doi: 10.1016/j.drudis.2009.01.003. [DOI] [PubMed] [Google Scholar]
- 10.Sotriffer CA. Accounting for Induced-Fit Effects in Docking: What is Possible and What is Not? Curr.Top.Med.Chem. 2011;11(2):179–191. doi: 10.2174/156802611794863544. [DOI] [PubMed] [Google Scholar]
- 11.Lin JH. Accommodating Protein Flexibility for Structure-Based Drug Design. Curr.Top.Med.Chem. 2011;11(2):171–178. doi: 10.2174/156802611794863580. [DOI] [PubMed] [Google Scholar]
- 12.Lill MA. Efficient incorporation of protein flexibility and dynamics into molecular docking simulations. Biochemistry. 2011;50(28):6157–6169. doi: 10.1021/bi2004558. [DOI] [PMC free article] [PubMed] [Google Scholar]
- 13.Bahar I, Lezon TR, Yang LW, Eyal E. Global Dynamics of Proteins: Bridging Between Structure and Function. Ann.Rev.Biophys. 2010;39:23–42. doi: 10.1146/annurev.biophys.093008.131258. [DOI] [PMC free article] [PubMed] [Google Scholar]
- 14.Chennubhotla C, Rader AJ, Yang LW, Bahar I. Elastic network models for understanding biomolecular machinery: From enzymes to supramolecular assemblies. Phys.Biol. 2005;2(4):S173–S180. doi: 10.1088/1478-3975/2/4/S12. [DOI] [PubMed] [Google Scholar]
- 15.Barril X, Morley SD. Unveiling the full potential of flexible receptor docking using multiple crystallographic structures. J.Med.Chem. 2005;48(13):4432–4443. doi: 10.1021/jm048972v. [DOI] [PubMed] [Google Scholar]
- 16.Amaro RE, Baron R, McCammon JA. An improved relaxed complex scheme for receptor flexibility in computer-aided drug design. J.Comput.Aided Mol.Des. 2008;22(9):693–705. doi: 10.1007/s10822-007-9159-2. [DOI] [PMC free article] [PubMed] [Google Scholar]
- 17.Armen RS, Chen J, Brooks CL. An Evaluation of Explicit Receptor Flexibility in Molecular Docking Using Molecular Dynamics and Torsion Angle Molecular Dynamics. J.Chem.Theory.Comput. 2009;5(10):2909–2923. doi: 10.1021/ct900262t. [DOI] [PMC free article] [PubMed] [Google Scholar]
- 18.Bolstad ES, Anderson AC. In pursuit of virtual lead optimization: pruning ensembles of receptor structures for increased efficiency and accuracy during docking. Proteins. 2009;75(1):62–74. doi: 10.1002/prot.22214. [DOI] [PMC free article] [PubMed] [Google Scholar]
- 19.Lin JH, Perryman AL, Schames JR, McCammon JA. Computational drug design accommodating receptor flexibility: the relaxed complex scheme. J.Am.Chem.Soc. 2002;124(20):5632–5633. doi: 10.1021/ja0260162. [DOI] [PubMed] [Google Scholar]
- 20.Lin JH, Perryman AL, Schames JR, McCammon JA. The relaxed complex method: Accommodating receptor flexibility for drug design with an improved scoring scheme. Biopolymers. 2003;68(1):47–62. doi: 10.1002/bip.10218. [DOI] [PubMed] [Google Scholar]
- 21.Xu M, Lill MA. Significant enhancement of docking sensitivity using implicit ligand sampling. J.Chem.Inf.Model. 2011;51(3):693–706. doi: 10.1021/ci100457t. [DOI] [PMC free article] [PubMed] [Google Scholar]
- 22.Word JM, Lovell SC, Richardson JS, Richardson DC. Asparagine and glutamine: Using hydrogen atom contacts in the choice of side-chain amide orientation. J.Mol.Biol. 1999;285(4):1735–1747. doi: 10.1006/jmbi.1998.2401. [DOI] [PubMed] [Google Scholar]
- 23.Case DA, Cheatham TE, III, Darden T, Gohlke H, Luo R, Merz KM, Jr., Onufriev A, Simmerling C, Wang B, Woods RJ. The Amber biomolecular simulation programs. J.Comput.Chem. 2005;26(16):1668–1688. doi: 10.1002/jcc.20290. [DOI] [PMC free article] [PubMed] [Google Scholar]
- 24.Huang N, Shoichet BK, Irwin JJ. Benchmarking sets for molecular docking. J.Med.Chem. 2006;49(23):6789–6801. doi: 10.1021/jm0608356. [DOI] [PMC free article] [PubMed] [Google Scholar]
- 25.Trott O, Olson AJ. AutoDock Vina: improving the speed and accuracy of docking with a new scoring function, efficient optimization, and multithreading. J.Comput.Chem. 2010;31(2):455–461. doi: 10.1002/jcc.21334. [DOI] [PMC free article] [PubMed] [Google Scholar]
- 26.Morris GM, Huey R, Lindstrom W, Sanner MF, Belew RK, Goodsell DS, Olson AJ. AutoDock4 and AutoDockTools4: Automated docking with selective receptor flexibility. J.Comput.Chem. 2009;30(16):2785–2791. doi: 10.1002/jcc.21256. [DOI] [PMC free article] [PubMed] [Google Scholar]
- 27.Elber R, Karplus M. Enhanced sampling in molecular dynamics: use of the time-dependent Hartree approximation for a simulation of carbon monoxide diffusion through myoglobin. J.Am.Chem.Soc. 1990;112(25):9161–9175. [Google Scholar]
- 28.Heyer LJ, Kruglyak S, Yooseph S. Exploring expression data: identification and analysis of coexpressed genes. Genome Res. 1999;9(11):1106–1115. doi: 10.1101/gr.9.11.1106. [DOI] [PMC free article] [PubMed] [Google Scholar]
- 29.The multilinear regression data analysis for this paper was generated using SAS software, Version 9.2 of the SAS system for Windows, Copyright ©2002-2008, SAS Institute Inc. SAS and all other SAS Institute Inc. product or service names are registered trademarks or trademarks of SAS Institute Inc., Cary, NC, USA. 2010.
Associated Data
This section collects any data citations, data availability statements, or supplementary materials included in this article.