Abstract
Objective
The objective of this study is to define the ultrasonographic changes in the cardiovascular and uteroplacental circulation of normal pregnant mice compared to non-pregnant mice using high-frequency, high-resolution ultrasonography.
Methods
Ten to twelve-week-old CD-1 mice (six non-pregnant and six pregnant animals) were used for all experiments. Vevo® 2100 (VisualSonics) was used to evaluate the cardiovascular and uteroplacental circulation physiology. Cardiac echocardiogram and uterine artery Doppler studies were performed on all animals. Pregnant animals were evaluated on embryonic day seven (E7), thirteen (E13) and eighteen (E18). Fetal heart rate and umbilical artery Doppler flows were obtained on pregnant animals. Three-dimensional ultrasonography imaging was utilized for quantification of placental volumes. All data are presented as median {10th–90th percentiles}.
Results
In pregnant mice on E7 compared to non-pregnant mice, there was an increase in cardiac output (p=0.008), stroke volume (p=0.002), ejection fraction, (p=0.02) and fractional shortening (p=0.02). The maternal heart rate increased throughout gestation (p= 0.009). During pregnancy, a gestational sac was clearly visible on E7. Between E13 and E18, the fetal size and fetal heart rate increased (p=0.001) and the umbilical artery peak systolic velocity increased (p <0.001). Minimal diastolic blood flow was observed in the umbilical artery on E13, which increased slightly on day E18 (p=0.01). There was also no change in the uterine artery resistance index between non-pregnant and pregnant mice. The placental volume increased between E13 and E18 (p=0.03).
Conclusion
Several changes noted in cardiovascular and uteroplacental systems occurring during normal murine pregnancy have striking similarities to humans and can be accurately measured using newer ultrasonographic techniques. Further studies are needed to evaluate changes in these vascular beds in mouse models of diseases such as preeclampsia and intrauterine growth restriction.
Keywords: high-frequency ultrasonography, mouse pregnancy, echocardiography, uteroplacental Doppler flow
INTRODUCTION
Mouse models are increasingly being used to study a wide variety of genetic and adult human diseases as it is now easier to construct these models through genetic modifications (such as gene mutation and knockout), surgery or pharmacologic manipulation. (1, 2) Because of similarities in anatomy, physiology, metabolism and genetics, mouse models are suitable to study human pathological processes. (3) Historically, the study of pregnancy in mice has evaluated prenatal growth using ex vivo methods e.g. embryonic and placental weights as measured variables.
Ultrasonography has long been a valuable tool to non invasively assess human pregnancies.(4) It is used for a number of reasons such as estimation of gestational age and fetal growth, assessment of fetal wellbeing, fetal anatomical survey and evaluation of uteroplacental circulation in normal and abnormal pregnancies. In utero ultrasonography has been reported and described in several mouse models of pregnancy and development (5–7); however, unlike ultrasonography used in humans, most of these studies published to date utilize mechanical probes with no color Doppler and a fixed single focal plane, making accurate and precise evaluation of small structures and vessels more than challenging. A recent article by Croy et al. highlights some of these challenges including the difficulty to identify uterine and spiral arteries accurately based solely on waveforms without color Doppler.(8) In addition, assessment of velocity of slow flowing blood is difficult even in highly resolved and correctly identified vessels due to the properties of filters required to discriminate such flow from vessel wall, heart and breathing motions.(8) High-frequency ultrasonography technology, which became available recently, enables imaging of anatomical structures in mice and rats with temporal and spatial resolution sufficient to obtain high quality data.(9)
The objective of this study was to evaluate cardiovascular and uteroplacental changes occurring in normal pregnant compared to non-pregnant mice utilizing Vevo® 2100 intra-vital bio-microscopy platform (VisualSonics, ON, Canada) which is a state-of-the-art high-resolution, high-frequency ultrasound instrument, equipped with dynamic multifocal plane linear array probes with color and pulse wave Doppler capability. We hypothesized that these changes will mimic changes seen in human pregnancies. In our view, this information will be invaluable for the study of mouse models of pregnancy-related human diseases that affect cardiovascular and uteroplacental circulation, such as preeclampsia and intrauterine growth restriction.
METHODS
Animals and experimental protocols
All animal protocols were approved by the Beth Israel Deaconess Medical Center Institutional Animal Care and Use Committee. Ten to twelve week old female CD-1 mice (20–25 gram initial body weight) were purchased from Charles River Laboratories International, Inc. (Wilmington, MA, United States). Pregnant mice were obtained on embryonic day five (E5) of pregnancy and housed at the Animal Research Facility under controlled conditions as recommended. Measurements in pregnant mice (n=6) were done on E7, E13 and E18. Umbilical artery parameters, fetal heart rate and placental volume were measured only on E13 and E18. Echocardiographic parameters and uterine artery measurements also were evaluated in six non-pregnant mice.
For performing ultrasonography, the mice were lightly anesthetized with approximately 1.5% isoflurane in medical air via nose cone. Following that, the animal was placed on the heated stage, and the fur was removed from either the anterior chest wall or anterior abdominal region. Electrocardiogram, respiratory rate and core temperature monitoring was performed continuously throughout the procedure. Pre-warmed gel for sonography was used as a coupling medium. Stage temperature was adjusted in order to maintain a core temperature of 37°C.
Echocardiography
Transthoracic echocardiography of the left ventricle using a 40-MHz multiple array linear scanhead interfaced with the platform was performed to obtain a high-resolution, two-dimensional echocardiogram; B-mode and M-mode images were acquired at a rate up to 1,000 frames-per-second (fps), automatically adjusted by the instrument. These images were used to calculate left ventricular function parameters. A single operator (EVK) performed and analyzed all echocardiograms utilizing a proprietary software package, provided with the Vevo®2100 platform. The measurements obtained included cardiac output, stroke volume, ejection fraction, fractional shortening and maternal heart rate.
Uteroplacental evaluation
A 48 MHz transducer operating at 100 fps was used to transcutaneously image uterine arteries and the embryos within the abdomen of pregnant animals. In Doppler mode, pulsed repetition frequency was set between 4 and 48kHz to detect low to high blood flow velocities, respectively. A 2 to 5 mm pulsed Doppler gate was used and the angle of the Doppler beam and the vessel was recorded and kept <60°. Waveforms were saved for later offline analysis. All scans were performed by the same operator (SR). Ultrasound evaluation was done on four embryos in each mouse - two in the left horn and two in the right horn. Anatomical position and color Doppler mode were utilized to ensure correct identification of vascular structures being studied. The ultrasound parameters obtained included fetal heart rate, umbilical artery pulse wave Doppler, uterine artery pulse wave Doppler and placental volume.
Fetal Heart Rate
The fetal heart was visualized in a four-chamber view in transverse view of the fetal chest. The heart rate was calculated by M-Mode over three cardiac cycles using averaging software.
Umbilical artery pulse wave Doppler
After locating the umbilical cord insertion point into the placenta using color Doppler, umbilical artery peak systolic velocity (UA-PSV) and end diastolic velocity (UA-EDV) were measured over five cardiac cycles that were not effected by motion caused by maternal breathing, and the results were averaged.
Uterine artery pulse wave Doppler
The right uterine artery was identified behind the urinary bladder. The resistive index was calculated (10) as: (S-D)/S where S is peak systolic velocity and D is end diastolic velocity. The pulsatility index (PI) was defined as PI = ((Vmax – Vmin)/Vmax mean) where Vmax is the peak systolic velocity, Vmin is the minimum forward diastolic velocity in unidirectional flow and Vmax mean is the maximum velocity averaged over five cardiac cycles. Velocity time integral (VTI) was measured by outlining three consecutive heartbeat cycles and calculating the integral under the resulting curve. The proprietary software package provided with Vevo® 2100 (VisualSonics) platform was used.
Placental volume
Three-dimensional (3D) surface rendering mode was used to map the placentas from four embryos in each pregnant mouse. The placental volume was calculated offline using volume analysis software provided with Vevo® 2100 (VisualSonics) platform. Briefly, borders of the placenta were outlined using anatomical landmarks in consecutive transverse sections acquired during 3D ultrasonography. Following that, the software algorithm was initialized to perform final 3D rendering and volume measurement.
Statistical analysis
All analyses were performed using SAS 9.2 (SAS institute Inc., Cary, NC). All tests were two sided, and P values <0.05 were considered statistically significant. When more than one measurement was available for a given parameter, the values were averaged for each mouse. Data are presented as median with 10th and 90th percentiles. Comparisons between pregnant and non-pregnant mice were made using an exact Wilcoxon test. The Wilcoxon signed rank test was used to compare paired data from E13 and E18. The Friedman test was used to compare paired data across all three gestational ages.
RESULTS
Echocardiographic evaluation
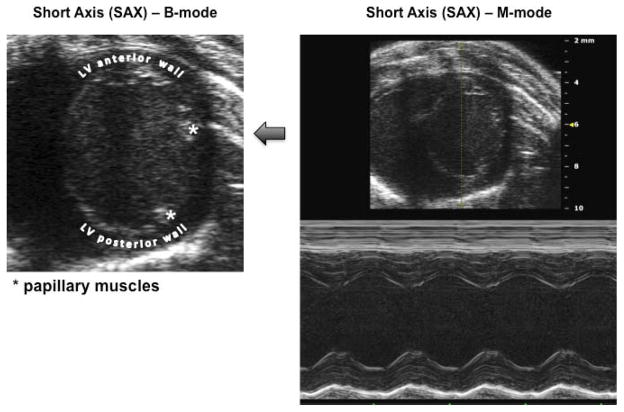
Figure 1 provides an example of a B-mode image highlighting landmarks (e.g. left ventricular (LV) papillary muscle orientation) used to obtain consistent and truthful Short Axis (SAX) images of LV in B-mode and M-mode. In pregnant mice on E7 compared to non-pregnant mice, there was a significant increase in median cardiac output (P=0.008), stroke volume (P=0.002), ejection fraction (P=0.02) and fractional shortening (P=0.02). There was an increase in maternal heart rate with increasing gestational age (P=0.009), but none of the other parameters changed from E7 to E18 (all P>0.30). Data are presented in Table 1.
Figure 1. Echocardiographic landmarks.
B-mode image of the left ventricle (LV) short axis (SAX) and resulting M-mode image showing the projection obtained for measurement of stroke volume and other parameters. In particular, note the position of the mitral valve papillary muscles at 2 and 4 o’clock used to establish correct and consistent transducer positioning.
Table 1.
Echocardiographic parameters in non-pregnant and pregnant mice
| Cardiac Parameters | Not pregnant (n=6) | P* | Embryonic Day 7 (n=6) | Embryonic Day 13 (n=6) | Embryonic Day 18 (n=6) | P** |
|---|---|---|---|---|---|---|
| Echocardiogram | ||||||
| Maternal heart rate (beats/min) | 462.8 (416.1–533.5) | 1.0 | 475.5 (413.0–504.0) | 526.5 (494.1–543.0) | 521.2 88.0–542.0) | 0.009 |
| Cardiac output (ml/min) | 16.5 (13.3–17.7) | 0.008 | 24.4 (20.4–28.4) | 24.6 (22.7–27.8) | 24.8 (23.7–30.4) | 0.86 |
| Fractional shortening (%) | 28.2 (26.5–31.5) | 0.02 | 33.8 (27.7–39.1) | 34.4 (27.7–38.8) | 34.1 (23.5–40.0) | 0.61 |
| Ejection fraction (%) | 53.0 (52.7–60.3) | 0.02 | 62.9 (60.0–74.0) | 63.7 (53.4–69.9) | 63.3 (53.1–71.2) | 0.61 |
| Stroke volume (ul) | 33.7 (29.5–39.6) | 0.002 | 48.0 (42.6–56.7) | 47.5 (43.1–51.7) | 48.4 (43.1–51.7) | 0.31 |
Data are presented as median (10th-90th percentiles)
Exact Wilcoxon test comparing non-pregnant mice to mice on embryonic day 7.
Friedman test for days 7, 13 and 18; Wilcoxon signed rank for days 13 and 18.
Uteroplacental evaluation
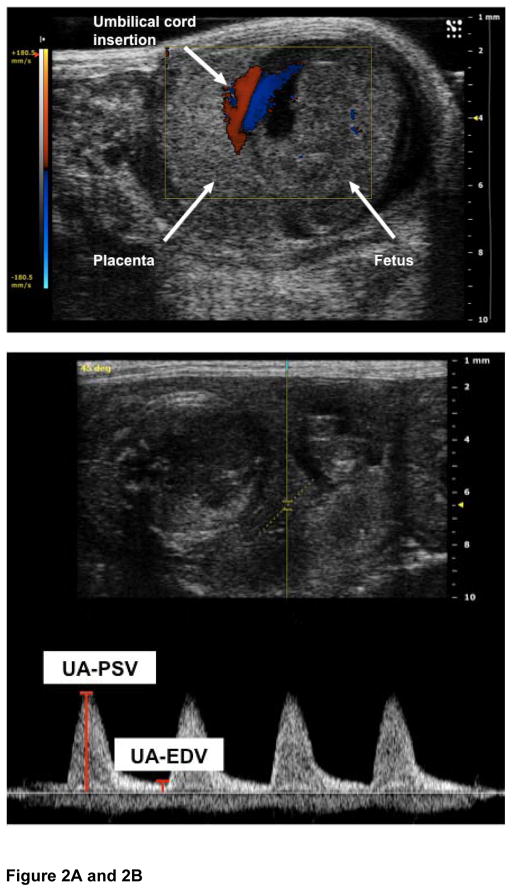
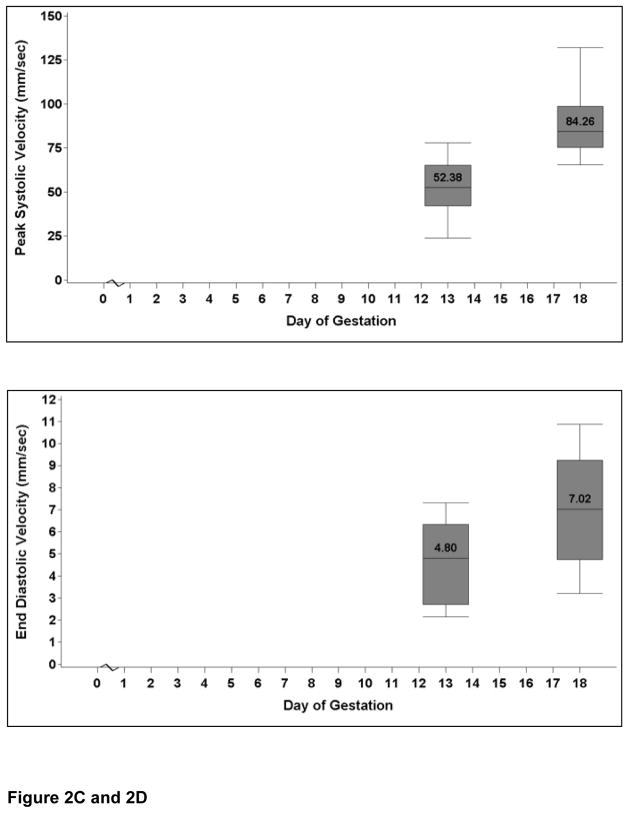
Measurement of fetal heart rate, as well as flow velocities and resistance waveforms within the umbilical artery, was possible from E13 onward. The fetal heart rate increased significantly from E13 to E18 (P=0.001). Figures 2A and 2B show the localization of the placental insertion of the umbilical cord and measurement of the velocities based on arterial waveforms. The umbilical vessel velocity increased throughout gestation as demonstrated by the increase in umbilical artery peak systolic velocity (P<0.001) and end diastolic velocity (P=0.015) from E13 to E18 (Figures 2C and 2D). Umbilical artery resistive index did not change with advancing gestation (P=0.25) Umbilical artery data are presented in Table 2.
Figure 2. Umbilical artery Dopplers.
Figure 2A: The image shows a pregnant mouse on E13. The placenta is visualized as a homogenous mass. The umbilical cord insertion into the placenta is clearly demarcated by use of color Doppler.
Figure 2B: The placental cord insertion was first identified by color Doppler. A waveform was obtained showing the peak systolic velocity (PSV) and end diastolic velocity (EDV). All analysis was done off line. Umbilical vein tracing is also seen.
Figure 2C: The graph shows the change in the umbilical artery peak systolic velocity at E13 and E18. The values are medians, and the whiskers extend to the 10th and 90th percentiles. There is an increase in peak systolic velocity with advancing gestational age (P<0.001).
Figure 2D: The graph shows the change in the umbilical artery end diastolic velocity at E13 and E18. The values are medians, and the whiskers extend to the 10th and 90th percentiles. There is an increase in end diastolic velocity with advancing gestational age (P=0.015).
Table 2.
Uteroplacental evaluation in non-pregnant and pregnant mice
| Cardiac Parameters | Not pregnant (n=6) | P* | Embryonic Day 7 (n=6) | Embryonic Day 13 (n=6) | Embryonic Day 18 (n=6) | P** |
|---|---|---|---|---|---|---|
| Fetal Heart Rate (beats/min) | 146.5 (105.0–171.0) | 193.0 (127.0–216.0) | 0.001 | |||
| Umbilical Artery | ||||||
| Resistive index | 0.9 (0.9–10) | 0.9 (0.9–0.9) | 0.25 | |||
| Peak systolic velocity (mm/s) | 52.4 (23.8–77.8) | 84.3 (65.4–132.0) | <0.001 | |||
| End diastolic velocity (mm/s) | 4.8 (2.1–7.3) | 7.0 (3.2–10.9) | 0.015 | |||
| Systolic/diastolic ratio | 11.9 (7.6–23.0) | 14.8 (8.9–18.4) | 0.33 | |||
| Uterine Artery | ||||||
| Resistive index | 0.7 (0.7–0.9) | 0.59 | 0.7 (0.6–0.7) | 0.5 (0.4–0.7) | 0.6 (0.6–0.7) | 0.11 |
| Peak systolic velocity (mm/s) | 147.0 (23.4–280.4) | 0.94 | 110.5 (72.2–239.2) | 105.7 (43.7–318.4) | 152.3 (87.4–209.1) | 0.51 |
| End diastolic velocity (mm/s) | 26.3 (7.7–92.6) | 0.31 | 34.8 (28.2–64.6) | 51.4 (14.9–175.8) | 56.4 (30.9–73.6) | 0.51 |
| Velocity Time Interval (mm) | 22.9 (2.7–31.4) | 0.82 | 15.5 (11.7–26.3) | 13.5 (5.9–39.0) | 16.0 (9.6–22.5) | 0.31 |
| Pulsatility index | 1.1 (1.1–1.8) | 0.39 | 1.2 (0.9–1.5) | 0.7 (0.5–1.2) | 1.1 (0.9–1.2) | 0.11 |
| Systolic/diastolic ratio | 3.2 (2.9–10.0) | 0.33 | 3.1 (2.3–3.6) | 2.0 (1.6–3.4) | 2.8 (2.5–3.3) | 0.11 |
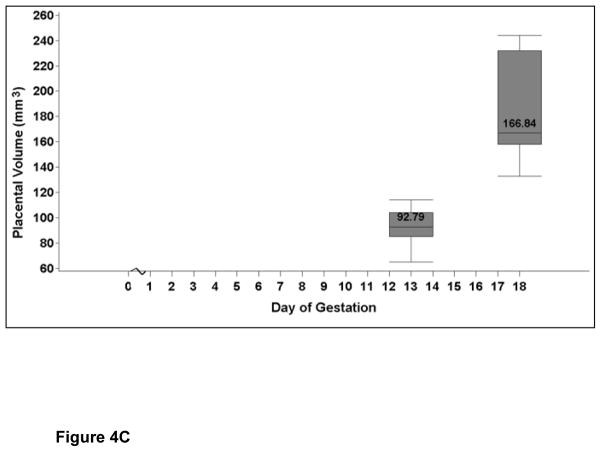
| Placental volume (mm3) | 92.8 (65.1–114.2) | 166.8 (132.7–244.1) | 0.03 | |||
Data are presented as median (10th–90th percentiles)
Exact Wilcoxon test
Friedman test for embryonic days 7, 13 and 18; Wilcoxon signed rank for embryonic days 13 and 18.
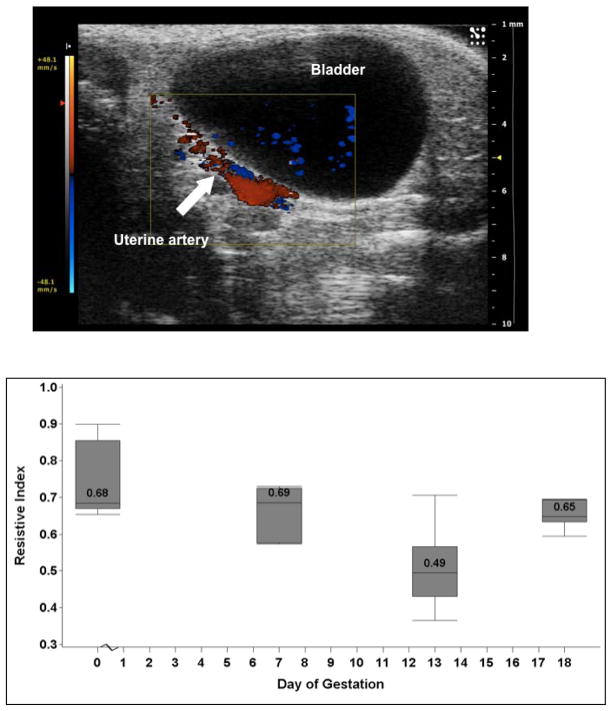
Figure 3A shows the localization of the uterine artery using color Doppler. Waveforms were obtained using pulse Doppler. The uterine artery resistive index was lowest at E13; however, this was not significantly different from E7 and E18 and there was no difference between non-pregnant and pregnant mice (P=0.59; Figure 3B). Similarly, the PI and VTI were lowest at midgestation. Uterine artery data are shown in Table 2.
Figure 3. Uterine artery Dopplers.
Figure 3A: The uterine artery was localized using color Doppler behind the bladder. A waveform was obtained using pulse Doppler and the systolic and diastolic velocities were measured.
Figure 3B: The image shows the uterine artery resistance index in non-pregnant and pregnant mice. The values are medians, and the whiskers extend to the 10th and 90th percentiles. The resistance index is lowest at mid pregnancy, but does not differ throughout gestation (P=0.11).
Placental volume
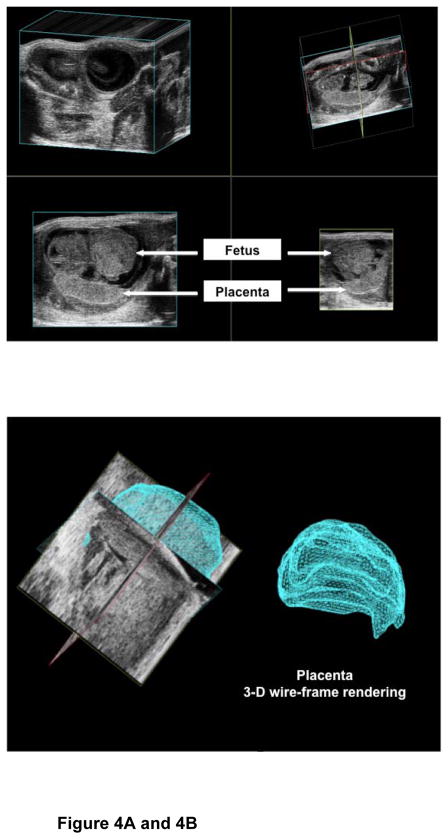
Figure 4A shows the three-dimensional surface-rendering mode to map a representative placenta and calculation of the placental volume (Figure 4B). The placental volume increased between E13 and E18 (P=0.03; Figure 4C and Table 2). The gestational sac on E7 was too small to characterize the placenta separately.
Figure 4. Placental volumes.
Figure 4A: The image shows the acquisition of the placental volume using surface rendering mode.
Figure 4B: The image shows the off-line analysis of the placental volume.
Figure 4C: The image shows the placental volume (mm3) at E13 and E18. The values are medians, and the whiskers extend to the 10th and 90th percentiles. There is an increase in placental volume with advancing gestation (P=0.03).
DISCUSSION
In this study we have shown that accurate assessment of cardiovascular and uteroplacental circulation is possible in mouse pregnancy using high-resolution high-frequency ultrasonography. In addition, we also report that gestation in mice is characterized by hemodynamic changes similar to those observed in human pregnancy.
Human pregnancy is characterized by cardiovascular changes with an increase in cardiac output, stroke volume and heart rate in order to compensate for increasing demands of the fetus and the mother during gestation. (11) In the present work we were able to show that there is an increase in cardiac output, fractional shortening and ejection fraction in mice pregnancy as well. There is also a similar increase in the heart rate throughout gestation.
Measurement of umbilical circulation vasodynamic parameters in human pregnancies allows detection of fetal compromise and is routine in clinical care(12) Similar to humans we found an increase in the umbilical artery peak systolic velocity and late diastolic velocity with progressing gestation. However, we did not observe a decrease in the resistive index or the systolic/diastolic ratio with advancing gestational age contrary to what was previously reported. (6) These observations may be due to small sample size or a different placental physiology that requires resistance to maintain perfusion. Also we were unable to obtain umbilical flow earlier than E13 and cannot comment whether there is a decrease in resistance between early and mid pregnancy.
Measurement of uterine artery Doppler in human pregnancies is performed for identification of high-risk women for complications such as preeclampsia or intrauterine growth restriction.(13) Similar to humans during gestation we showed that there is ample diastolic flow in the uterine artery. We also demonstrated that there is decreased resistance in mid-pregnancy, though non-significant and not as profound as observed in human gestation. This may be due to the fact that in a mouse pregnancy, the trophoblast invasion of uterine arteries is relatively shallow and limited to proximal decidua and the transformation of uterine arteries depends on maternal factors and not on trohphoblast invasion and could thus be species specific.(14)
Conventional two-dimensional (2D) ultrasound has been widely used for the evaluation of the placenta during pregnancy. (15) However it is recently being recognized that three-dimensional ultrasound could facilitate the novel assessment modality of the placenta, such as surface-rendered imaging and volume measurement and can provide qualitative as well as quantitative evaluation of the vascularization and blood flow in this organ.(16) We have shown here that accurate assessment of placental volume is feasible in mouse pregnancy. In our opinion, this non-invasive tool will be invaluable for the study of mouse models of human diseases (e.g. preeclampsia). (17–19)
In a recent paper, Croy et al (8) points out the various challenges in the use of ultrasound for pregnancy evaluation in small animals including poor resolution, inability to detect slow velocity blood flow, slow frame rate speed, single focal plane of imaging and identification of vessels solely based on waveform. We addressed a number of these issues as the ultrasound system that we used is equipped with multiple array, state-of-the-art transducers with significantly higher acquisition frame rates and multiple focal planes providing superior contrast and more detailed resolution over a wider field of view. We also used state of art software for analysis of various cardiac parameters. In addition, the use of color Doppler makes identification of vessels precise and reproducible.
In summary, our study explores normal physiological changes in murine pregnancy and provides the foundation for analysis of mouse models of human diseases during pregnancy and helps monitor therapeutic interventions.
Acknowledgments
S.R. is supported by Harvard Diversity and Community Partnership Faculty Fellowship Award. S. A.K. is an investigator of the Howard Hughes Medical Institute.
References
- 1.Breslow JL. Mouse models of atherosclerosis. Science. 1996 May 3;272(5262):685–8. doi: 10.1126/science.272.5262.685. [DOI] [PubMed] [Google Scholar]
- 2.Daugherty A, Cassis LA. Mouse models of abdominal aortic aneurysms. Arterioscler Thromb Vasc Biol. 2004 Mar;24(3):429–34. doi: 10.1161/01.ATV.0000118013.72016.ea. [DOI] [PubMed] [Google Scholar]
- 3.Waterston RH, Lindblad-Toh K, Birney E, Rogers J, Abril JF, Agarwal P, et al. Initial sequencing and comparative analysis of the mouse genome. Nature. 2002 Dec 5;420(6915):520–62. doi: 10.1038/nature01262. [DOI] [PubMed] [Google Scholar]
- 4.Abuhamad AZ. ACOG Practice Bulletin, clinical management guidelines for obstetrician-gynecologists number 98, October 2008 (replaces Practice Bulletin number 58, December 2004). Ultrasonography in pregnancy. Obstet Gynecol. 2008 Oct;112(4):951–61. doi: 10.1097/AOG.0b013e31818b1fba. [DOI] [PubMed] [Google Scholar]
- 5.Brown SD, Zurakowski D, Rodriguez DP, Dunning PS, Hurley RJ, Taylor GA. Ultrasound diagnosis of mouse pregnancy and gestational staging. Comp Med. 2006 Aug;56(4):262–71. [PubMed] [Google Scholar]
- 6.Mu J, Adamson SL. Developmental changes in hemodynamics of uterine artery, utero-and umbilicoplacental, and vitelline circulations in mouse throughout gestation. Am J Physiol Heart Circ Physiol. 2006 Sep;291(3):H1421–8. doi: 10.1152/ajpheart.00031.2006. [DOI] [PubMed] [Google Scholar]
- 7.Zhao H, Wong RJ, Doyle TC, Nayak N, Vreman HJ, Contag CH, et al. Regulation of maternal and fetal hemodynamics by heme oxygenase in mice. Biol Reprod. 2008 Apr;78(4):744–51. doi: 10.1095/biolreprod.107.064899. [DOI] [PubMed] [Google Scholar]
- 8.Zhang J, Croy BA. Using ultrasonography to define fetal-maternal relationships: moving from humans to mice. Comp Med. 2009 Dec;59(6):527–33. [PMC free article] [PubMed] [Google Scholar]
- 9.Moran CM, Pye SD, Ellis W, Janeczko A, Morris KD, McNeilly AS, et al. A comparison of the imaging performance of high resolution ultrasound scanners for preclinical imaging. Ultrasound Med Biol. 2011 Mar;37(3):493–501. doi: 10.1016/j.ultrasmedbio.2010.11.010. [DOI] [PMC free article] [PubMed] [Google Scholar]
- 10.Pourcelot L. Clinical Applications of Doppler examination transcutaneous. In: Peronneau P, editor. Doppler Ultrasound Velocimetric. Paris: INSERM; 1974. pp. 231–40. (in French) [Google Scholar]
- 11.Duvekot JJ, Peeters LL. Maternal cardiovascular hemodynamic adaptation to pregnancy. Obstet Gynecol Surv. 1994 Dec;49(12 Suppl):S1–14. doi: 10.1097/00006254-199412011-00001. [DOI] [PubMed] [Google Scholar]
- 12.Neilson JP, Alfirevic Z. Doppler ultrasound for fetal assessment in high risk pregnancies. Cochrane Database Syst Rev. 2000;(2):CD000073. doi: 10.1002/14651858.CD000073. [DOI] [PubMed] [Google Scholar]
- 13.Cnossen JS, Morris RK, ter Riet G, Mol BW, van der Post JA, Coomarasamy A, et al. Use of uterine artery Doppler ultrasonography to predict pre-eclampsia and intrauterine growth restriction: a systematic review and bivariable meta-analysis. CMAJ. 2008 Mar 11;178(6):701–11. doi: 10.1503/cmaj.070430. [DOI] [PMC free article] [PubMed] [Google Scholar]
- 14.Carter AM. Animal models of human placentation--a review. Placenta. 2007 Apr;28( Suppl A):S41–7. doi: 10.1016/j.placenta.2006.11.002. [DOI] [PubMed] [Google Scholar]
- 15.Abramowicz JS, Sheiner E. Ultrasound of the placenta: a systematic approach. Part I: Imaging. Placenta. 2008 Mar;29(3):225–40. doi: 10.1016/j.placenta.2007.12.006. [DOI] [PubMed] [Google Scholar]
- 16.Hata T, Tanaka H, Noguchi J, Hata K. Three-dimensional ultrasound evaluation of the placenta. Placenta. 2011 Feb;32(2):105–15. doi: 10.1016/j.placenta.2010.11.001. [DOI] [PubMed] [Google Scholar]
- 17.Kanasaki K, Palmsten K, Sugimoto H, Ahmad S, Hamano Y, Xie L, et al. Deficiency in catechol-O-methyltransferase and 2-methoxyoestradiol is associated with pre-eclampsia. Nature. 2008 Jun 19;453(7198):1117–21. doi: 10.1038/nature06951. [DOI] [PubMed] [Google Scholar]
- 18.Lim HJ, Wang H. Uterine disorders and pregnancy complications: insights from mouse models. J Clin Invest. 2010 Apr 1;120(4):1004–15. doi: 10.1172/JCI41210. [DOI] [PMC free article] [PubMed] [Google Scholar]
- 19.Kumasawa K, Ikawa M, Kidoya H, Hasuwa H, Saito-Fujita T, Morioka Y, et al. Pravastatin induces placental growth factor (PGF) and ameliorates preeclampsia in a mouse model. Proc Natl Acad Sci U S A. 2011 Jan 25;108(4):1451–5. doi: 10.1073/pnas.1011293108. [DOI] [PMC free article] [PubMed] [Google Scholar]


