Abstract
We recently demonstrated that migrating human leukocytes respond to normal physiologic fluid stresses (~1dyn/cm2) by active control of local cytoplasmic extensions (pseudopods). To better understand the governing mechanisms of this response, we determined the fluid stress distributions on individual migrating leukocytes whose shapes were reconstructed with serial confocal microscopy. The flow over adherent leukocytes was computed by solution of the Stokes equation for plasma motion over the cell membrane. The fluid stresses are highest at the top of the cell and lowest in the substrate contact region. Pseudopods experience enhanced shear stresses but at lower values than at the top. Interestingly, leukocytes retract pseudopods in all regions and not only at sites with maximum fluid stresses. Therefore we hypothesized that sub-micron membrane folds (microvilli) serve to locally enhance the fluid stress on the cell. Using a separate model, we found that tips of microvilli experience greatly increased levels of stresses while the troughs between microvilli are shielded from fluid shear. This evidence suggests that the highly irregular shape of active leukocytes leads to fluid stresses that may stimulate local mechanosensory responses at many sites on the plasma membrane, even if they are located close to the cell-substrate contact region.
Keywords: leukocyte, mechanotransduction, fluid shear stress, finite element method
Introduction
Leukocytes in normal circulation are spherical in shape and do not extend cytoplasmic projections in the form of pseudopods because such projections would hinder the passage of cells through small blood vessels. However, upon activation, leukocytes form large pseudopods, which are essential for the cells to make attachment to the endothelium and migrate along and across the vessel wall. It has been shown that fluid shear stress can keep leukocytes in their round passive shape.6, 7, 11 Nevertheless, the mechanisms by which leukocytes sense mechanical stresses are not completely understood. As an important step to explore possible mechanisms involved, we determine the fluid stress distribution on the surface of individual leukocytes with and without pseudopods.
In the past, the fluid shear stress on a single adherent cell was computed with a simplified geometry, such as flat discs,11 smooth spheres,19 or a semi-spherical protrusion on a plane wall.12 Since the stress distribution is quite non-uniform and highly dependent on the fine geometric shape of the membrane, there is a need to determine the fluid stress on the membrane of an active leukocyte with realistic cell shapes.
Here we put forward a novel method for determination of the detailed fluid stress distribution on the surface of single migrating leukocytes. Both normal stress and shear stress will be determined since previous experimental evidence suggests that both may evoke a cellular response.16, 18 The fluid stress distributions on the plasma membrane provide the basis for analysis on how fluid stresses regulate the pseudopod extension/retraction process.
Materials and Methods
Cell Culture
Acute human leukemic promyelocytic cells (HL60, ATCC) between 6 and 12 weeks were used for the experiments after differentiation. The HL60 cells were cultured in RPMI 1640 medium supplemented with 10% fetal bovine serum (FBS) and 1% penicillin/streptomycin. After a 5-day differentiation period in media with 1.5% DMSO, neutrophilic leukocytes (“differentiated HL60 cells”) were generated for use in the flow experiments.
In vitro Flow Chamber Experiments
Differentiated HL60 cells were stained with PKH26 (5×10⁻⁶ M, Sigma-Aldrich) one day prior to experiments. Immediately before the experiment, the cells were incubated with fMLP (1×10⁻⁸ M) for 5 minutes. After injecting into a parallel-plate flow chamber, the cells were allowed to settle and migrate freely on the glass coverslip (Fisherbrand) for ~15min. A laminar flow of calcium-fortified PlasmaLyte (pH 7.4) at 2.2dyn/cm2 was applied by a syringe pump (Harvard Apparatus) for 3 minutes.
Image Acquisition
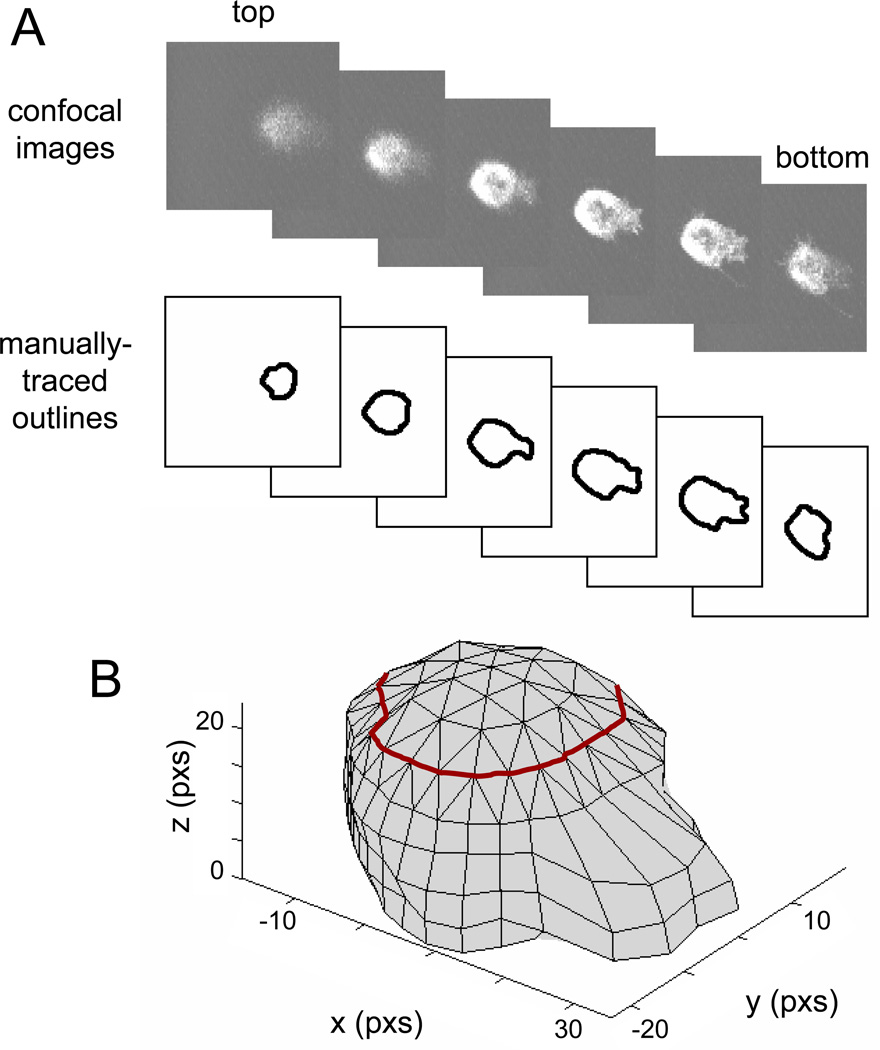
Confocal images (Biorad, OS2 Acquisition, 60× oil objective, 8× digital zoom, 128×128 pixels) of a migrating leukocyte were recorded along the z-direction (i.e., height) in 1µm intervals before and after fluid shear (Figure 1A). The strength of the laser (Krypton/Argon, 4–7mW before entering the confocal, 568nm excitation wavelength), level of gain, and iris size was adjusted for each cell in order to obtain optimal images. To determine the positions at the bottom and at the top of the cell, the focus was changed quickly in an upward direction while keeping the laser on. The upper and lower bounds of the scanning distance were estimated based on visual determination of cellular features (in fluorescence).
Figure 1. Reconstruction of 3D cell shape from 2D confocal images.
A) The 2D outlines of the cell are manually traced from confocal images. B) The outlines are then approximated by polygons and stacked together to form the body of the cell (below the red line). The top of the cell shape (above the red line) is reconstructed from extrapolated points based on the local curvature of the cell body.
Reconstruction of cell morphology
The three-dimensional (3D) shape of the cell was reconstructed numerically on the digitized images (Matlab R14 and FEMLAB 3.0a). The images were first processed digitally to generate enhanced contrast and then passed through a median filter which served to smooth the cell edges with minimal loss of details (Image-Pro Plus, each pixel in the images represents 0.263µm by 0.263µm). The perimeter of the cell was manually traced to generate two-dimensional (2D) contours and each was approximated by a 36-sided polygon (Matlab). The sections were then stacked into a 3D cell shape. To provide a better representation of the uppermost cell cap, the top-most section was represented by a 24-sided polygon. The 24 points were linked to the 36 points of the section below by solid tetrahedrons (Figure 1B). To create a more realistic approximation for the top of the cell, points were extrapolated from the top 3 contours of the cell. The xyz positions of these points were used to generate solid tetrahedrons that form a cap, which sat on top of the cell geometry formed from confocal images (Figure 1B). The coordinates of the complete 3D cell shape were integrated into a numerical analysis to solve the equation of motion for fluid flow over the cell.
Fluid Flow Analysis
The flow was assumed to be at steady state and at low Reynolds number. Plasma is an incompressible and Newtonian fluid with constant viscosity. Based on the flow rate, the applied laminar flow in the parallel-plate flow chamber had a calculated maximum velocity of 1.41cm/s and a wall shear stress of 2.2dyn/cm2 for a channel thickness of 250µm and width of 10.8mm. The entry flow region at low Reynolds number is small.5 We assumed that most cells observed in the center of the flow chamber were under fully developed steady state flow.
The cell was assumed to be a solid with a shape determined by the confocal reconstruction. The applied fluid stresses were not sufficient to cause a significant viscoelastic deformation of the cell.14 Under these conditions the conservation of mass and the momentum equation reduced to the Stokes approximation:
| (2) |
| (3) |
where v⃑ is the velocity vector and p the pressure.
The equations were non-dimensionalized with the characteristic length of 5µm (approximately the radius of a leukocyte) and the characteristic velocity at 1 cm/s (to allow for a, which gave a Reynolds number of 0.05. The dimensionless variables were defined as:
| (4) |
| (5) |
| (6) |
where vi was the dimensional velocity in the i th direction. The viscosity of Plasma-Lyte, the shearing fluid, was measured with a viscometer to be 0.98 centipoise.
Finite Element Model Formulation
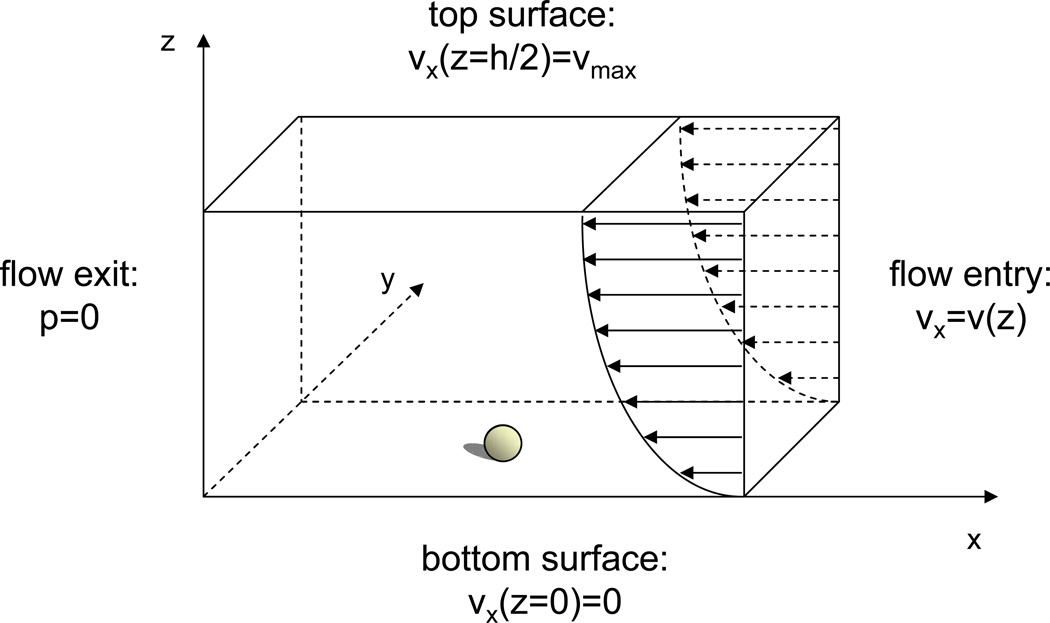
For the finite element analysis, the total modeling volume was selected to a height of 25 characteristic length units, which is equal to half the height of the flow chamber. The entrance length and the exit length were both about 14 units so the flow could develop fully and the flow disturbance from the cell was negligible at the flow entry and exit boundary. The width of the flow chamber was similar to the entrance and exit lengths at approximately 14 units on each side of the cell. The coverslip and the surface of the cell satisfy the no-slip condition (Figure 2). On all other boundary surfaces we assumed zero normal stresses because the flow was unidirectional. A parabolic velocity profile was assumed at the entry to the modeling volume based on a parabolic velocity profile for flow between parallel plates as used in the experiments.
Figure 2. Schematic of the boundary conditions for finite element model.
For the modeling volume, the flow is unidirectional with a parabolic entrance velocity profile. The exit pressure is zero. At the top surface the velocity is tangential to the boundary and was set at 1.4cm/s. The bottom surface (coverslip) and cell plasma membrane satisfy the no-slip velocity condition. There is no flow entering or exiting the front and back surfaces of the volume.
A finite element mesh was generated (in FEMLAB 3.0a) with the highest density of elements on the cell surface and the cell contact areas. The size of the elements depended on the complexity of the surface details and each cell surface was typically covered with ~10,000 nodes that serve to mark the vertices of the finite elements. The numerical results were verified by checking the wall shear stress values away from the cell and comparing the shear distribution to that of a semicircle in the same flow field. The normal fluid stress (i.e. the negative pressure) was computed assuming zero hydrostatic pressure in the computational volume, so that all normal stresses are due to the fluid flow in the computational volume only. Therefore the actual normal fluid stress acting on the cell membrane is the sum of the normal stress due to the fluid flow computed here and the prevailing hydrostatic pressure in which the leukocyte is located.
FEM Modeling of Membrane Folds
Scanning Electron Microscopy (SEM)
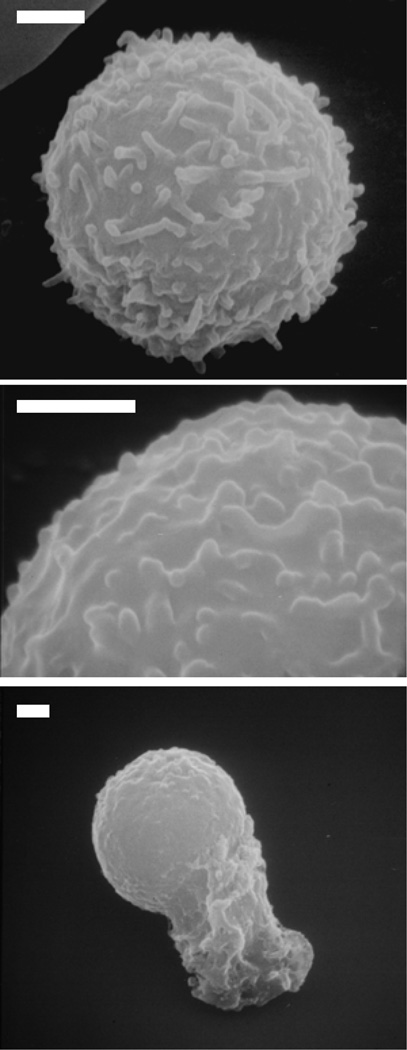
Since confocal microscopy does not resolve the detailed shape of the plasma membrane folds, SEM images (Figure 3) were used for estimation of the typical shape and density of membrane folds in the finite element model. The methods were described previously.13 Briefly, fresh human leukocytes were isolated by sedimentation and fixed with glutaraldehyde. The cells were then dehydrated and coated with gold palladium and viewed in a scanning electron microscope (JSM-25 at 15kV, JEOL Corp., Peabody, MA). The length calibration was obtained from a standard grid.
Figure 3. Scanning electron micrographs of human leukocytes.
The surfaces of human leukocytes are completely covered by sub-micron membrane folds (microvilli) that are on the order of 0.2µm in height. The length and shape of the membrane folds are non-uniform. The top micrograph shows a quiescent leukocyte whereas the bottom image shows an activated cell. The middle image shows the microvilli in more details. Bar = 1µm.
Model of Membrane Folds
Cylindrical microvilli with smooth plasma membrane were used to model membrane folds on human leukocytes based on scanning electron micrographs. The height of each microvillus was 0.2µm, the widest part at the base was 0.3µm in diameter, and they had a semi-spherical cap. In a model for closely-clustered membrane folds, microvilli were spaced in a hexagonal pattern such that the edge of the base of a microvillus contacts its neighbor. For a model of sparsely-spaced membrane folds, adjacent microvilli were separated by 0.75µm (center to center). In each case, there are a total of 7 microvilli positioned in the center of the bottom plane inside the modeling volume. The modeling volume was set at 5µm × 5µm × 2.5µm so that the flow disturbance caused by the microvilli is negligible at the boundaries of the modeling volume. The inflow velocity profile was the same as that for the whole cell analysis described above.
Similar to the whole-cell model, a finite element mesh was generated (FEMLAB) and used to solve equations (1) and (2). The computational results were verified by checking the wall shear stress values away from the microvilli.
RESULTS
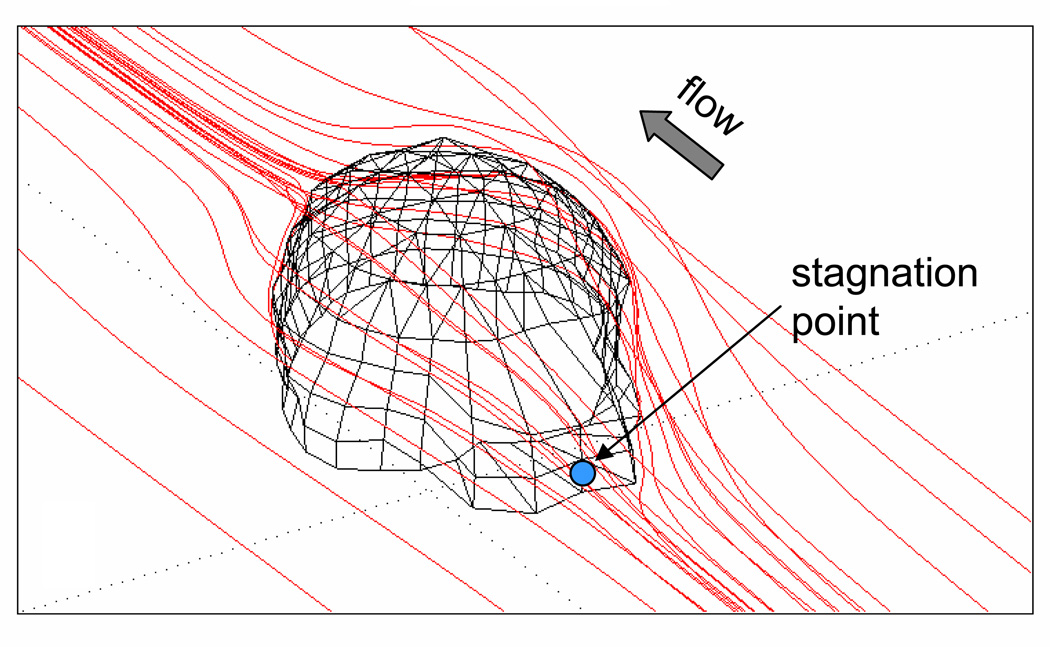
At the low Reynolds number in this problem, the particle paths are curved only in close proximity to the cell. No recirculation zones occur at the resolution provided by the finite element approach and fluid particles do not get trapped in eddies upon passing over the cell surface. There exist stagnation points in the front and back of the cell, where the magnitudes of velocity and shear stresses are zero (Figure 4).
Figure 4. Example of computed fluid particle paths.
There are no flow recirculation zones and there exists a stagnation point in the front (blue dot) of the cell where the flow separates. There is also a stagnation point at the trailing end of the cell (not shown).
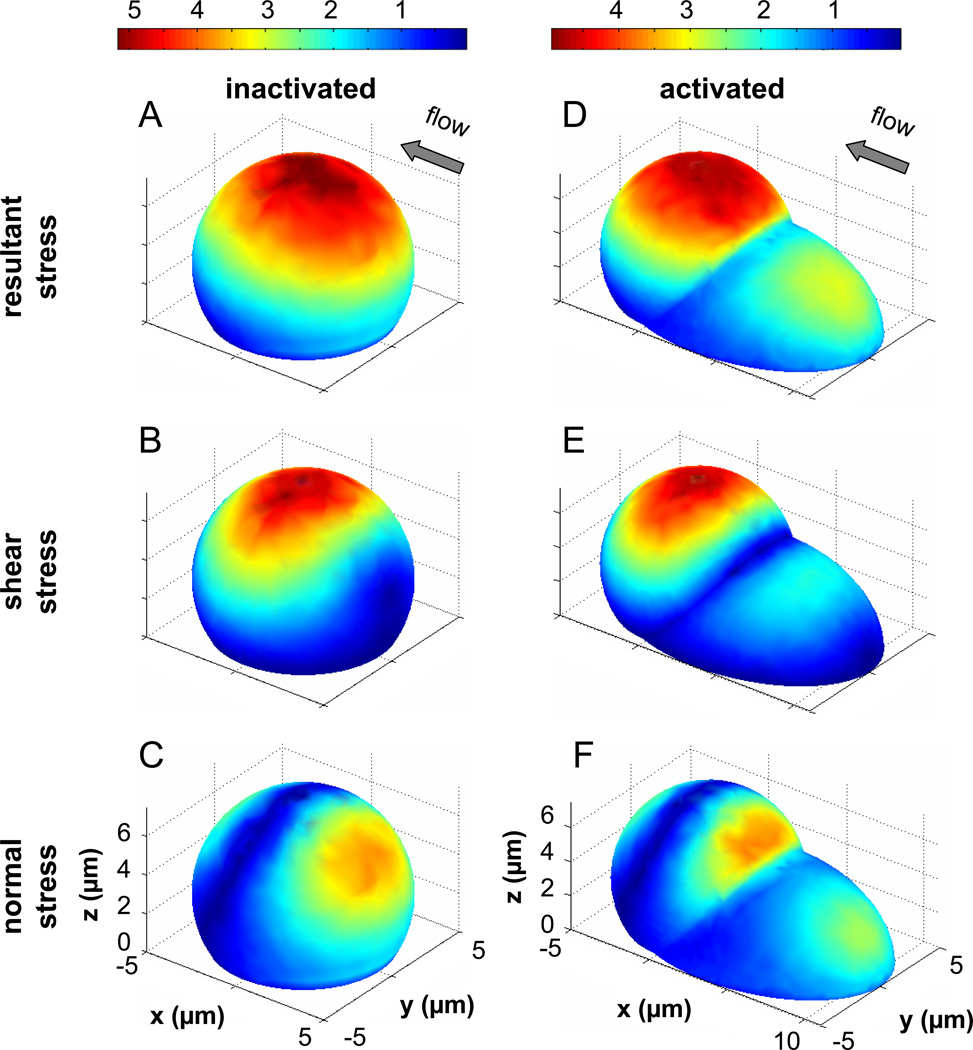
To gain initial insight into the effect of a larger pseudopod on the fluid stress distribution, two idealized models were created in a pilot study (Figure 5): an “inactivated” semi-sphere without pseudopod and an “activated” shape with a model pseudopod in the form of a truncated ellipsoid. The semi-sphere shows maximum shear stresses at the top, with minimum shear stresses forming a ring around the base and also at the flow stagnation points in both the upstream and downstream region (Figure 5B). The magnitude of the normal stresses is much lower than that of shear stresses with higher levels on the upstream side of the semi-sphere than on the downstream side. We computed the resultant stress by addition of shear and normal stress vectors. By definition, the resultant stresses on the membrane act in the direction of flow, shear stresses are tangential, and normal stresses act perpendicular to the membrane. The magnitude of the resultant stress is highest at the top and in an adjacent membrane positioned slightly towards the upstream region.
Figure 5. Fluid stresses on the surface of cell model with typical cell dimension and with smooth surface.
A–C) The normalized fluid stresses on the surface of a truncated sphere used to model an inactivated adherent leukocyte are shown. D–F) The normalized fluid stresses on the surface of a composite geometry that models an activated leukocyte with a large upstream pseudopod are shown. Both geometries have the same maximum height at 6µm and the largest stress value is lower in the case with the pseudopod. The stresses are displayed as a multiple of the applied wall shear stress, e.g. 5 is equivalent to 5×2.2dyn/cm2 = 11dyn/cm2.
The presence of a pseudopod-like structure (Figure 5D–F) leads to enhanced shear and normal stresses on the pseudopod but reduces the area and magnitudes of stresses on the main body (semisphere) even if the main body maintains the same maximum height (6µm).
Fluid Stress on the Membrane of a Cell with and without Pseudopod
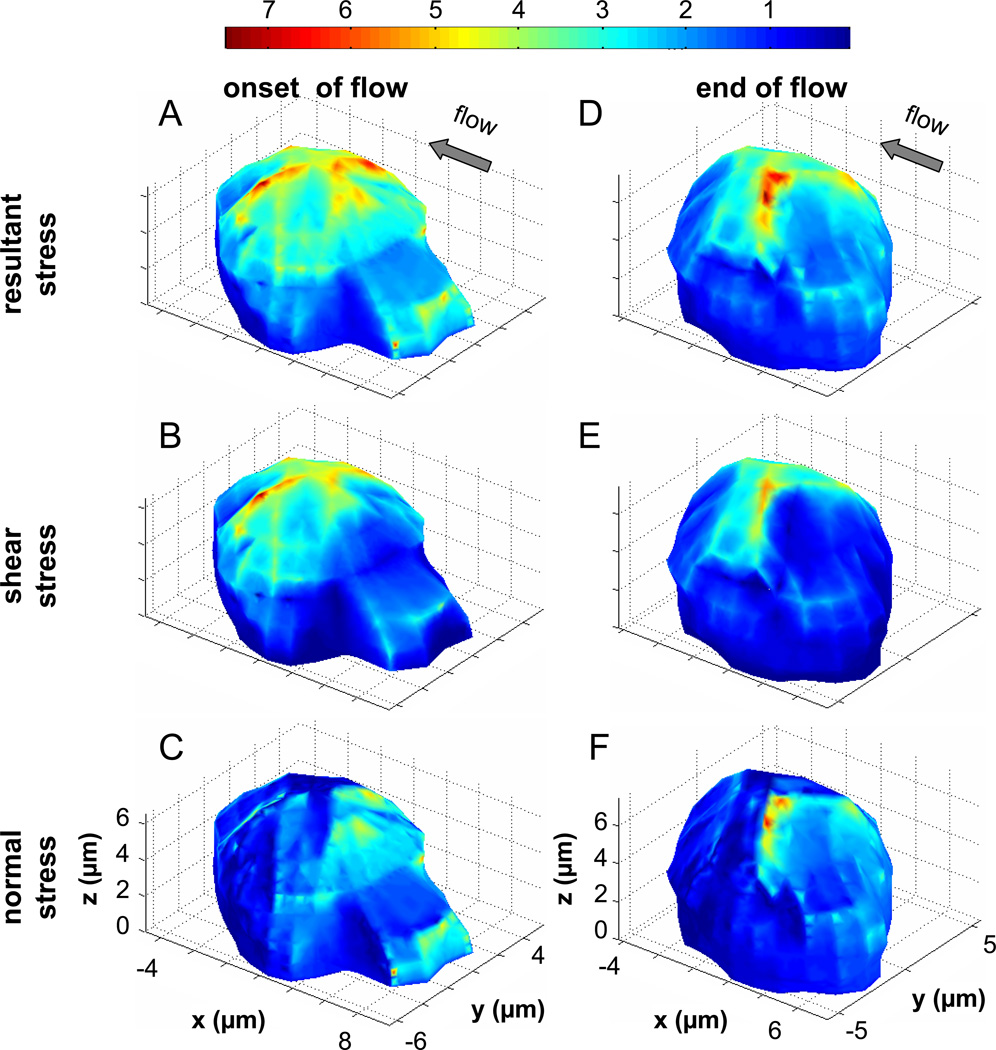
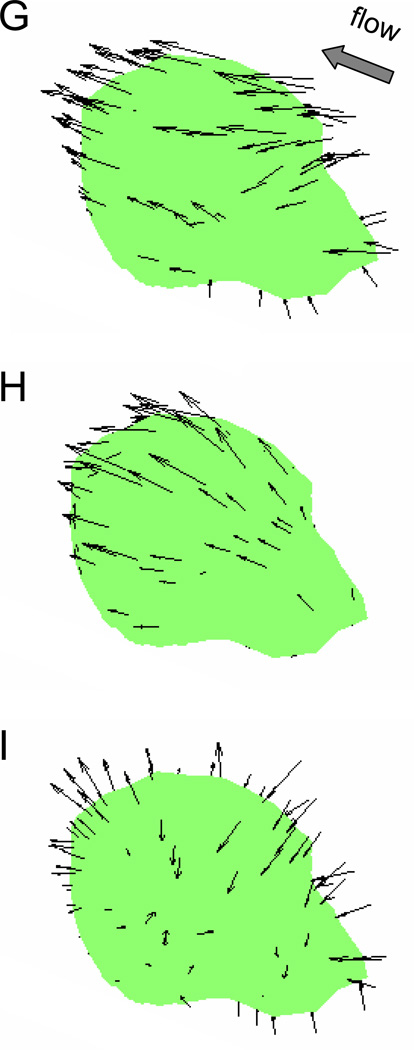
As expected, the fluid stress distribution on the plasma membrane depends on the instantaneous cell shape. With or without pseudopod, the maximum resultant and shear stresses are located at the top of the cell (Figure 6). Sites of elevated fluid stresses also occur at membrane protrusions, such as the top of a pseudopod (Figure 6A–C). However, the magnitude of these stresses is less than those at the top of the cell. The lowest stresses (~0 dyn/cm2) are located in regions where the cell is in contact with the glass coverslip and at concave plasma membrane indentations. The normal stresses due to the flow field, i.e. fluid pressure in the absence of a static hydrostatic pressure, are highest at the front of the cell facing the impinging flow (i.e. compressive normal stress pushing into the membrane). The normal stress magnitude is lowest at the top of the cell in the same region with the highest shear stress and resultant stress. In the downstream membrane region of the cell, there exist enhanced tensile normal stresses (i.e. pulling outwards from the membrane) in the absence of a hydrostatic pressure (evident from the arrow lengths in Figure 6I).
Figure 6. Fluid stress distributions on the surface of a leukocyte.
The normalized resultant stress (A & D), shear stress (B & E) and the normal stress (C & F) distributions are shown for a single migrating leukocyte at the onset of flow and after 3 min of fluid shear. The stresses are displayed as a multiple of the applied wall shear stress (2.2dyn/cm2), e.g. 7 is equivalent to 15.4dyn/cm2. G–I) The directions of the membrane fluid stresses shown in (A–C) are indicated by the arrows. The length of the arrows is representative of the magnitude of the stress. This demonstrates that in a laminar flow without recirculation zones, resultant stresses on the cell membrane are typically in the direction of flow, shear stresses act tangential to the membrane, and the upstream normal stresses are compressive while the downstream normal stresses are tensile.
Besides the relative magnitudes of resultant, shear, and normal stresses (Figure 6A–F) on the cell membrane we also show their directions (Figure 6G–I) at the onset of flow before retraction of its pseudopod. In the absence of a recirculation region, the resultant stresses anywhere on the cell surface always have a component that acts in the direction of flow (in the negative x-direction of Figure 6).
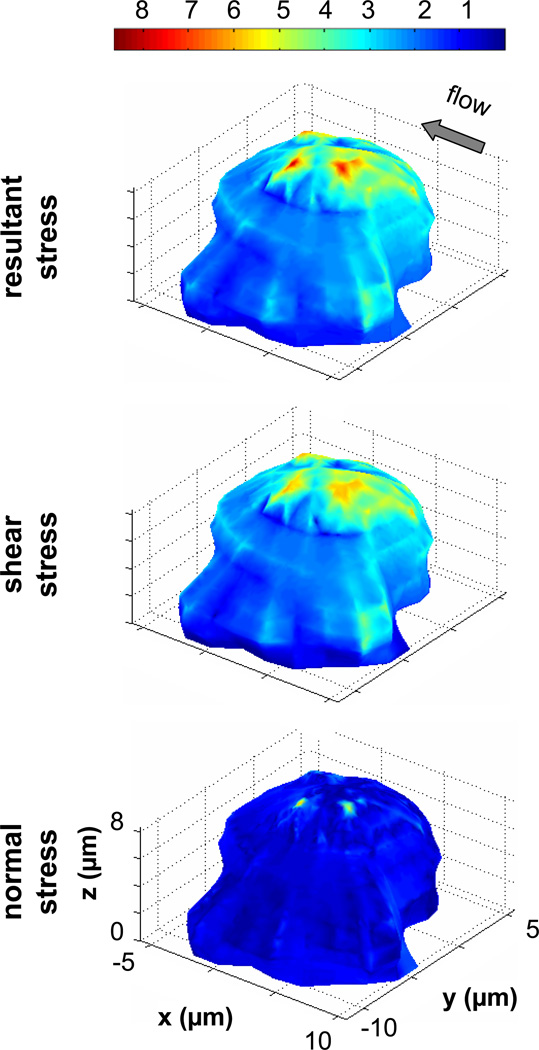
To further understand how the orientation of pseudopod influences the fluid stress distribution on the membrane, we carried out the analysis with different cell shapes. Figure 7 shows a case with a pseudopod projected in the direction almost perpendicular to the fluid shear direction. Similar to the stress distributions seen in Figure 6, the shear and resultant stresses are highest at the top of the cell; the minimum shear stresses are also found around the substrate contact regions. Since this cell protrudes further into the flow, the magnitudes of the shear stresses are higher than the previous cell shape (Figure 6) by about 15%. There are also elevated levels of shear stress across the upper portion of the pseudopod, which extends in the negative y-direction. Interestingly the normal stresses on the front part of the cell are about twice the applied wall shear stress while in the previous cell shape (Figure 6) the normal stresses are about 3–4 times. The directions of the fluid stresses on the membrane resemble the previous two cases (not shown).
Figure 7. Fluid stress distributions on the surface of a leukocyte with pseudopod pointing away from the direction of flow.
The normalized resultant stress (A), shear stress (B) and the normal stress (C) distributions are shown for a single migrating leukocyte with a large pseudopod pointing away from the flow direction. The stresses are displayed as a multiple of the applied wall shear. The top region is subjected to significantly higher fluid resultant and shear stresses compared to the rest of the cell membrane.
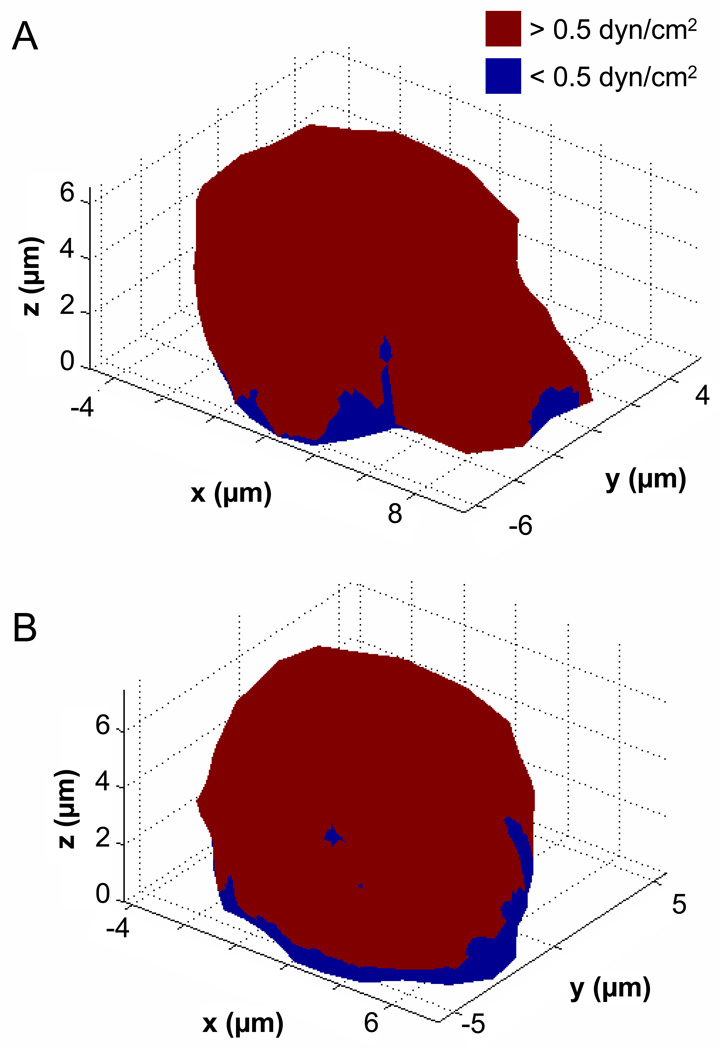
It is worth noting that even though the cell experiences a wide range of fluid shear stresses on its surface, for an applied wall shear stress of 2.2dyn/cm2 most of the plasma membrane is still subjected to a minimum shear stress of 0.5dyn/cm2 (i.e. 22%) (Figure 8), a level that induces cell retraction.10 Membrane areas with less than the aforementioned threshold value are close to the substrate contact regions.
Figure 8. Membrane shear stress threshold plots.
Illustration of the plasma membrane regions that are exposed to a minimum of 0.5 dyn/cm2 of shear stress (in red) as compared to the areas that experience less than 0.5 dyn/cm2 (in blue) at the onset of flow (A, with pseudopod) and at the end of 3min flow (B, without pseudopod). Between 70–75% of the cell membrane experiences a force above 0.5 dyn/cm2.
Fluid Stress Distribution on Membrane Microvilli
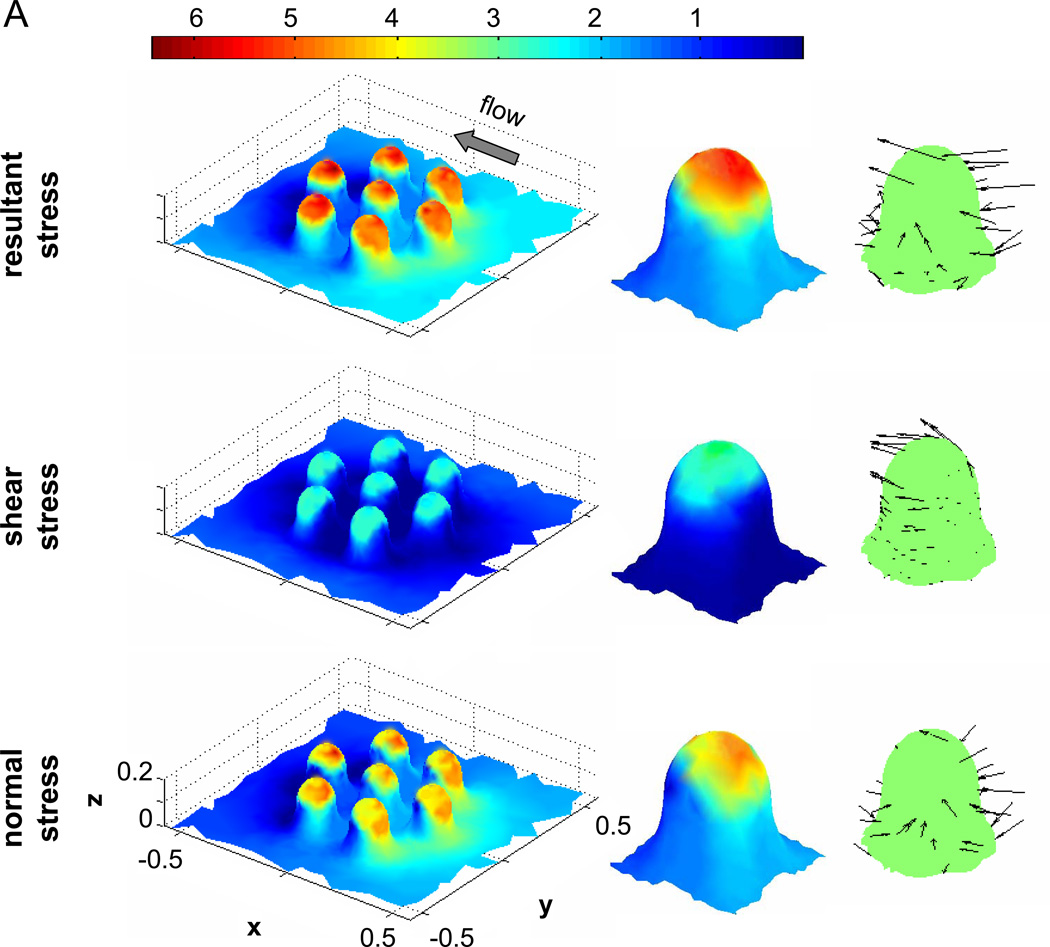
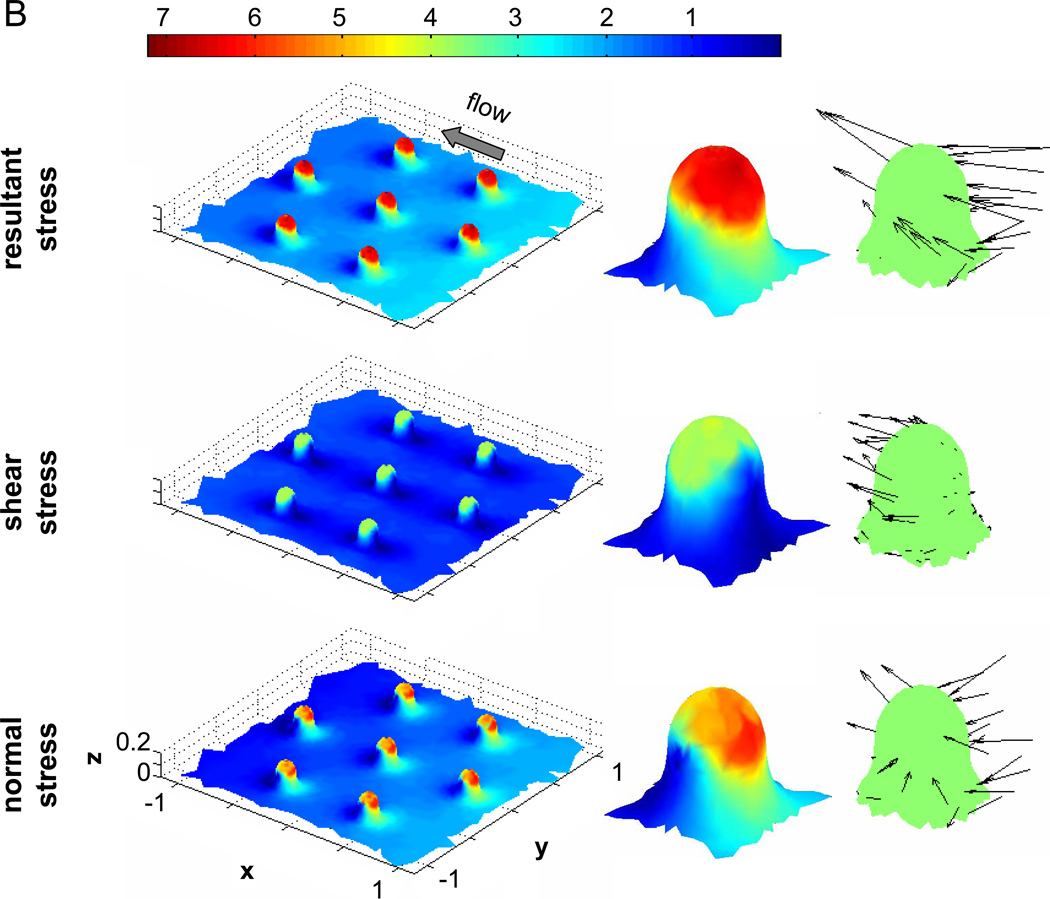
The presence of membrane folds (microvilli) strongly influences the stress distribution on the cell surface. Since the spacing between microvilli changes the surface stresses on these sub-micron protrusions, we examined two representative cases, one with closely spaced microvilli and one with sparse spacing between microvilli.
In a closely clustered microvillus formation (Figure 9A), the tip of each microvillus is exposed to shear stresses about 3 times that of the applied wall shear. The shear stresses in the troughs between microvilli are close to zero. The normal stresses are highest at the front near the tip of each microvillus (~4× of applied wall shear stress), while all around the base, both front and back, there exist low magnitude (~2×) stresses. Similar to shear stresses, zero normal stress is found in the downstream region near the tip of the microvillus and also in the troughs between folds.
Figure 9. Fluid stress distribution on membrane microvilli.
A) Left column shows the resultant, shear, and normal stress distributions on a group of closely-spaced microvilli. The middle column shows an enlarged view of the same fluid stress distributions on a microvillus in the center of the cluster. The right column shows the direction and relative magnitudes of the stresses on the same microvillus. B) The stress distributions for a group of sparsely-spaced microvilli. In both (A) and (B) the size of every microvillus is the same and the resultant stresses are predominantly pointing in the direction of flow. In (B) the fluid stresses are higher than in (A). Also in (B) the direction of the normal stresses on the downstream side of the microvillus is tensile while that of (A) is compressive. The fluid stresses are shown as a multiple of the applied wall shear stress (2.2dyn/cm2), e.g. 5 is equivalent to 11dyn/cm2.
In a sparsely spaced microvillus formation, maximum shear (~4×) and normal stresses (5–6×) are both higher and have higher resultant stresses. The areas on the microvilli exposed to enhanced fluid stresses are larger than the more densely clustered formation. The regions between microvilli are exposed to a shear stress that is close to the applied wall shear stress without membrane folds. As shown by the stress direction (right images, Figure 9A&B), the normal stresses in the downstream region were compressive for the closely clustered microvilli but tensile for the sparsely spaced microvilli. This indicated that when membrane microvilli are close to each other, the unidirectional flow pattern is disturbed and recirculation zones form near the base on the downstream side of each microvillus.
Combining the computational results of fluid stresses on membrane folds and those on a smooth cell shape without microvilli (as recorded with confocal microscopy), the tips of clustered microvilli on the top of a cell is subjected to a fluid stress more than 30 times higher than the applied wall shear, while the troughs between these microvilli experience zero stress. The spatial fluid stress gradient between a microvillus tip and trough on the top of the cell is substantial. The membrane folds also serve to enhance this gradient between the cell top and cell-substrate contact regions.
Discussion and Conclusions
In order to understand the response of circulating leukocytes to fluid stress there is a need to determine in detail the actual stress field imposed on the cell plasma membrane by the fluid flow. The current model is a start in illustrating some general features of the stress distributions and a tool for analyzing how these stresses may affect the cell’s mechanotransduction mechanisms under fluid shear.
Interestingly, the highest shear stresses are found at the top of the cell and their magnitudes are determined mainly by the height of the cell regardless of the presence of pseudopods. Membrane surface projections (e.g. in the form of pseudopods) lead to localized variations in stress values. The upstream surface of the pseudopod (Figure 6C) is subjected to higher normal stresses compared to a retracted cell (Figure 6F). The top of the pseudopod (between 4 & 8µm in the x-direction Figure 6B) experiences enhanced shear stresses compared to the cell without a large pseudopod (between 4 & 6µm in the x-direction of Figure 6E). Similar to the composite geometry of Figure 5, there exists a narrow band of low shear stress where the pseudopod meets the cell body (at the x=4µm of Figure 6B and of Figure 5E). The flow along the band is near zero, comparable to a stagnation point.
The x-component of shear stress on the cell was compared to published results for shear flow over a protuberance of similar shape and height.12 The comparison was made for the cell shown in Figure 5D–F after exposure to a 3-min fluid shear. The cell resembled then a truncated sphere protruding from a plane wall, for which the normalized shear stress values had been previously calculated. The normalized shear stress in the direction of flow at the top of the cell is about 6 times that of the wall shear stress, which is within about 12% of published results.12
With an applied shear stress of 2.2dyn/cm2, a value well within physiological range in microvessels, most of the cell surface experiences a shear stress magnitude of at least 0.5dyn/cm2. This level is within the magnitude of shear stresses that elicit pseudopod retraction in human neutrophils.10 If the cell response to flow is regulated by a threshold shear stress mechanism, then these results suggest that the majority of the cell membrane surface is exposed to fluid shear stresses that are able to switch on the mechanotransduction pathways. This may serve to explain that pseudopod retraction behavior is observed irrespective of the exact position of a pseudopod and not just in the highest shear domains at the top of the cell.6, 11 The orientation of the pseudopod has a relative low effect on the location of maximum fluid stresses (Figure 7). The highest stresses remain at the top of the cell irrespective of the orientation of a pseudopod projecting over the substrate.
The current results also show that maximum shear stress levels increase on the plasma membrane during the course of flow application when a pseudopod retracts.7, 9, 11 The process also leads to increased drag force because the cell becomes more round and extends farther into the flow field. The drag force may lead to detachment of the cell.6 Passive leukocytes that spread along their substrate under flow4 may benefit from the change in their cellular morphology in reducing shear stresses, such as that observed in confluent endothelial cell layers.1
In the current analysis of fluid stress over the cell, as constructed by confocal microscopy, the local cell surface was assumed to be smooth, since surface folds cannot be resolved with this technique. However, SEM images clearly show that neutrophil surfaces are fully covered by folds that are fingerlike or ridge-like (Figure 3) and are typically 0.2µm in height.13 The exact shape of these folds and the spacing between them are non-homogeneous, and our models represent cases in which these folds take on a cylindrical shape and are spaced either closely or sparsely. Also seen in the bottom panel of Figure 3, a leukocyte with a pseudopod has fewer membrane folds compared to a spherical cell. Selectins localize on the tips of leukocyte membrane microvilli2 while integrins tend to cluster at the base.15 Recent evidence suggest that G-protein coupled receptors (GPCRs) in the membrane may also serve as mechanosensors.3, 8 Since the tips and bases of membrane folds experience major differences in fluid stresses, membrane proteins located on different parts of the fold may become activated or deactivated depending on the stress they are subjected to. While receptors at the tips of membrane folds on the top of an adherent cell may experience ~30 times the applied wall shear stress, receptors in the troughs between clustered folds are shielded from shear stresses. Even though the cell membrane and its microvilli near the cell contact regions to a substrate experience a low shear stress (5 to 10×, Figure 8) to the local shear stress at the tip of a microvillus is still considerably amplified (~30×, Figure 9) so that at the tip of microvilli significant shear stresses may exist even though they are close to the contact region. In addition, microvilli near the contact region may be shorter and spaced further apart because the cell membrane is spreading during attachment to the substrate. Membrane stretch will lead to a smoother surface, as on a cell with a pseudopod, and we anticipate that microvilli contribute little to the regulation of the spatial fluid stress gradients near the contact regions. Based on these results and the observation that there are more membrane folds on a spherical than a migrating cell, it is possible that pseudopod retraction of a cell during fluid shear may serve as a mechanism to shield receptors within membrane troughs from fluid shear stresses.
The flow field is disturbed slightly by the clustered membrane folds, leading to compressive normal stresses on the backside (near the base) of membrane microvilli (right column bottom image, Figure 9A). This is different from sparsely spaced microvilli where the membrane folds experience a tensile stress on the backside. It remains to be determined whether a compressive normal stress in only a small portion of the total plasma membrane area would cause that cell region or the entire cell to behave differently (e.g. pseudopod extension instead of retraction under fluid flow).
Even though there exists a distribution of normal stress over the surface of the cell, the current results are determined in the absence of a blood pressure (i.e. compressive normal stress). The range of values from the highest to the lowest normal stresses is of the order of about 5 to 10 times of the applied fluid shear stress, i.e. in the range up to about 22 dyn/cm2 for a typical leukocyte under physiological fluid shear of 2.2dyn/cm2. This range is small compared to the pressures present when a leukocyte is in the circulation, e.g. in a post-capillary venule with even a relatively low pressure of about 5cmH2O (~5000dyn/cm2). Thus, the normal stress on a cell membrane is dominated by the prevailing hydrostatic pressure in the vessel in which the cell is located, and the relative small normal stress differences between front and back of the cell leads to only a small variation of this pressure amplitude. Spatial gradients in normal stress may, however, be considerable.
Retraction of pseudopods on migrating leukocytes during application of fluid shear stress is frequently observed, irrespective of the direction in which the pseudopod is pointing relative to the applied shear direction. Furthermore pseudopods often retract even though they are in contact with the substrate (e.g. as show in Figure 5). Thus pseudopods react to the applied fluid stresses even though they are not exposed to the maximum levels of fluid stress on the plasma membrane. But a major part of the cell membrane, including the pseudopod, may still be exposed to fluid shear stresses that are above a minimum level of shear stress sufficient to achieve a response by the cell. This may explain the lack of a correlation between the location on the cell where pseudopods retract and the magnitude of the fluid stresses in the same region. Our recent evidence suggests that pseudopod retraction may require enzymatic cleavage of membrane adhesion molecules,17 and thus the exact role of the peeling forces required to detach a pseudopod and the fluid stresses acting on the cell membrane requires further analysis.
Acknowledgments
The authors would like to thank Dr. Sheng Tong for his expertise and assistance in Matlab, FEMLAB, and fluid mechanics. Dr. Ayako Makino provided valuable guidance on cell culturing techniques and flow chamber experiments. This study was supported by NIH Grant HL 43062.
Supported by US Public Health Service Program Project Grant HL43026
REFERENCES
- 1.Barbee KA, Mundel T, Lal R, Davies PF. Subcellular distribution of shear stress at the surface of flow-aligned and nonaligned endothelial monolayers. Am J Physiol. 1995;268:H1765–H1772. doi: 10.1152/ajpheart.1995.268.4.H1765. [DOI] [PubMed] [Google Scholar]
- 2.Bruehl RE, Springer TA, Bainton DF. Quantitation of L-selectin distribution on human leukocyte microvilli by immunogold labeling and electron microscopy. J Histochem Cytochem. 1996;44:835–844. doi: 10.1177/44.8.8756756. [DOI] [PubMed] [Google Scholar]
- 3.Chachisvilis M, Zhang YL, Frangos JA. G protein-coupled receptors sense fluid shear stress in endothelial cells. Proc Natl Acad Sci U S A. 2006;103:15463–15468. doi: 10.1073/pnas.0607224103. [DOI] [PMC free article] [PubMed] [Google Scholar]
- 4.Coughlin MF, Schmid-Schonbein GW. Pseudopod projection and cell spreading of passive leukocytes in response to fluid shear stress. Biophys J. 2004;87:2035–2042. doi: 10.1529/biophysj.104.042192. [DOI] [PMC free article] [PubMed] [Google Scholar]
- 5.Fox RW, McDonald AT. Introduction to Fluid Mechanics. John Wiley & Sons, Inc.; 1998. p. 762. [Google Scholar]
- 6.Fukuda S, Yasu T, Predescu DN, Schmid-Schonbein GW. Mechanisms for regulation of fluid shear stress response in circulating leukocytes. Circ Res. 2000;86:E13–E18. doi: 10.1161/01.res.86.1.e13. [DOI] [PubMed] [Google Scholar]
- 7.Makino A, Glogauer M, Bokoch GM, Chien S, Schmid-Schonbein GW. Control of neutrophil pseudopods by fluid shear: role of Rho family GTPases. Am J Physiol Cell Physiol. 2005;288:C863–C871. doi: 10.1152/ajpcell.00358.2004. [DOI] [PubMed] [Google Scholar]
- 8.Makino A, Prossnitz ER, Bunemann M, Wang JM, Yao W, Schmid-Schonbein GW. G protein-coupled receptors serve as mechanosensors for fluid shear stress in neutrophils. Am J Physiol Cell Physiol. 2006;290:C1633–C1639. doi: 10.1152/ajpcell.00576.2005. [DOI] [PubMed] [Google Scholar]
- 9.Marschel P, Schmid-Schonbein GW. Control of fluid shear response in circulating leukocytes by integrins. Ann Biomed Eng. 2002;30:333–343. doi: 10.1114/1.1475342. [DOI] [PubMed] [Google Scholar]
- 10.Moazzam F. PhD Thesis. San Diego, La Jolla, CA: Department of Bioengineering, University of California; 1996. The response of human neutrophils to fluid stress. [Google Scholar]
- 11.Moazzam F, DeLano FA, Zweifach BW, Schmid-Schonbein GW. The leukocyte response to fluid stress. Proc Natl Acad Sci U S A. 1997;94:5338–5343. doi: 10.1073/pnas.94.10.5338. [DOI] [PMC free article] [PubMed] [Google Scholar]
- 12.Pozrikidis C. Shear flow over a protuberance on a plane wall. J Eng Math. 1997;31:29–42. [Google Scholar]
- 13.Schmid-Schonbein GW, Shih YY, Chien S. Morphometry of human leukocytes. Blood. 1980;56:866–875. [PubMed] [Google Scholar]
- 14.Schmid-Schonbein GW, Sung KL, Tozeren H, Skalak R, Chien S. Passive mechanical properties of human leukocytes. Biophys J. 1981;36:243–256. doi: 10.1016/S0006-3495(81)84726-1. [DOI] [PMC free article] [PubMed] [Google Scholar]
- 15.Schmidtke DW, Diamond SL. Direct observation of membrane tethers formed during neutrophil attachment to platelets or P-selectin under physiological flow. J Cell Biol. 2000;149:719–730. doi: 10.1083/jcb.149.3.719. [DOI] [PMC free article] [PubMed] [Google Scholar]
- 16.Shin HY, Smith ML, Toy KJ, Williams PM, Bizios R, Gerritsen ME. VEGF-C mediates cyclic pressure-induced endothelial cell proliferation. Physiol Genomics. 2002;11:245–251. doi: 10.1152/physiolgenomics.00068.2002. [DOI] [PubMed] [Google Scholar]
- 17.Shin HY, Simon SI, Schmid-Schonbein GW. Fluid shear-induced activation and cleavage of CD18 during pseudopod retraction by human neutrophils. Am J Physiol Cell. 2007 doi: 10.1002/jcp.21235. In press, [DOI] [PubMed] [Google Scholar]
- 18.Shiu YT, Li S, Marganski WA, Usami S, Schwartz MA, Wang YL, Dembo M, Chien S. Rho mediates the shear-enhancement of endothelial cell migration and traction force generation. Biophys J. 2004;86:2558–2565. doi: 10.1016/S0006-3495(04)74311-8. [DOI] [PMC free article] [PubMed] [Google Scholar]
- 19.Sugihara-Seki M, Schmid-Schonbein GW. The fluid shear stress distribution on the membrane of leukocytes in the microcirculation. J Biomech Eng. 2003;125:628–638. doi: 10.1115/1.1611515. [DOI] [PubMed] [Google Scholar]


