Abstract
Hemodynamics is thought to be a fundamental factor in the formation, progression and rupture of cerebral aneurysms. Understanding these mechanisms is important to improve their rupture risk assessment and treatment. In this study we analyze the blood flow field in a growing cerebral aneurysm using experimental particle image velocimetry (PIV) and computational fluid dynamics (CFD) techniques. Patient-specific models were constructed from longitudinal 3D computed tomography angiography (CTA) images acquired at one-year intervals. Physical silicone models were constructed from the CTA images using rapid prototyping techniques and pulsatile flow fields were measured with PIV. Corresponding CFD models were created and run under matching flow conditions. Both flow fields were aligned, interpolated, and compared qualitatively by inspection and quantitatively by defining similarity measures between the PIV and CFD vector fields. Results showed that both flow fields were in good agreement. Specifically, both techniques provided consistent representations of the main intra-aneurysmal flow structures, and their change during the geometric evolution of the aneurysm. Despite differences observed mainly in the near wall region and the inherent limitations of each technique, the information derived is consistent and can be used to study the role of hemodynamics in the natural history of intracranial aneurysms.
Keywords: Cerebral aneurysms, hemodynamics, growth, computational fluid dynamics, particle image velocimetry
Introduction
Stroke is the most common life-threatening neurological disease. Non-traumatic subarachnoid hemorrhage (SAH) constitutes approximately 5-10% of all strokes, and roughly 80% of SAH results from rupture of a brain aneurysm [1, 2]. Autopsy studies estimate that as much as 5% of the population may harbor undiscovered brain aneurysms [3, 4]. The fatality rate in aneurysmal rupture remains high (45% overall during the first year) [4]. In more than half of the survivors, the level of disability is major, and 64% of those patients never achieve the quality of life they enjoyed before the aneurysm ruptured [5, 6]. Whether unruptured brain aneurysms should be treated has been debated for the last decade [7-10]. This is particularly important in aneurysms less than 12 mm in the greatest diameter [9]. Recent developments in neuroimaging have detected more incidental brain aneurysms in routine clinical practice. Planning elective surgery requires a better understanding of the process of aneurysm formation, progression, and rupture so that a sound judgment between the risks and benefits of possible therapies can be made.
Hemodynamics is thought to play a fundamental role in the mechanisms of cerebral aneurysm formation, growth, and stabilization or rupture [11]. Understanding these mechanisms is important to improve current diagnosis and treatment of intracranial aneurysms. Most previous studies of the hemodynamics of cerebral aneurysms have been limited to aneurysms imaged only once [12-14]. However, in order to improve our knowledge of the mechanisms governing the evolution of cerebral aneurysms it has become necessary to analyze aneurysms that have been longitudinally followed during their natural evolution [15]. Only a few studies of the patient-specific hemodynamics in growing cerebral aneurysms longitudinally followed with 3D imaging have been carried out. This is a challenging task because typically most aneurysms are preventively treated and only a few which are considered to carry a low rupture risk are conservatively observed. In one such studies, Jou et al.[16] analyzed a growing and a stable fusiform basilar artery aneurysm that were followed for two years with MRI. They reported abnormally low WSS values in the area of aneurysmal growth and that the flow patterns did not change during the observation period. Similarly, Boussel et al. [15] analyzed seven growing cerebral aneurysms also longitudinally followed with MRA, and again concluded that aneurysm growth occurs at regions of abnormally low WSS. Tateshima et al. [17] studied with PIV the flow dynamics in a growing middle cerebral aneurysm harboring a bleb. They observed little change in the flow fields before and after growth. They also observed flow separation at the margins of the bleb and a decrease in the flow and wall shear stress within the expanding bleb. In most previous studies of cerebral aneurysms, the flow dynamics has been analyzed using both experimental [17-19] and computational [13, 20, 21] modeling. Several approximations and assumptions are made with each technique and each approach has its own set of limitations. Thus, the motivation of this study was twofold. The primary objective was to investigate whether experimental and computational models derived from longitudinal 3D medical images would produce consistent descriptions of the hemodynamics in cerebral aneurysms and its variations during the aneurysm progression. The second objective was to describe the blood flow fields observed during the evolution of a growing aneurysm. Note that the goal was not to exactly reproduce the experimental results with numerical models, but rather to investigate whether experimental and computational models constructed from the same images and under similar but not exactly matching assumptions and boundary conditions would yield consistent descriptions of the blood flow fields. Validation studies comparing CFD and PIV using patient-specific cerebral aneurysm geometries have been previously carried out [22]. This work extends those previous studies by considering a growing aneurysm and allowing for some freedom in the choice of approximations and assumptions typically made with each modeling strategy.
Methods
Clinical and Image Data
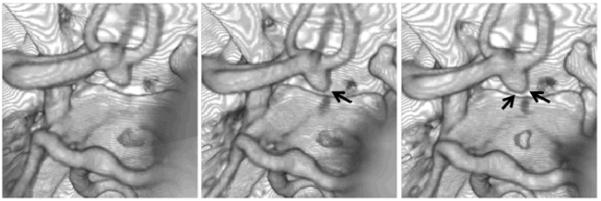
An intracranial aneurysm with documented growth was selected from a database of unruptured, untreated cerebral aneurysms longitudinally followed with non-invasive 3D imaging [17]. Aneurysms in this database are classified as growing if their size changes by at least 0.5 mm in any direction, as determined by experienced neuroradiologists. The selected patient was a 51 years old male with a 6.5 mm aneurysm located in the anterior communicating artery (Acom). Typically, aneurysms in this location receive blood from two sources, the A1 segments of the left and right anterior cerebral arteries (ACA). However, in this particular patient, the aneurysm is only fed from the left A1, the contralateral (right) A1 is missing (hypoplastic or aplastic). This patient has three A2 segments of the ACA, one irrigating the left hemisphere and two the right hemisphere. All these three A2 segments are supplied by the single left A1 segment. This aneurysm was imaged at one year intervals for four years between 2004 and 2008 using computed tomography angiography (CTA). The CTA images consisted in 330 to 360 slices with 512×512 pixels, an in plane resolution of 0.39 mm and a slice thickness of 0.5 mm. Because the aneurysm exhibited growth during the follow up period it was subsequently treated endovascularly with coils. Figure 1 shows volume renderings of the three longitudinal CTA images used in this study, corresponding to the initial exam and follow up observations at 8 and 27 months. Arrows in this figure point to the regions of the aneurysm observed to enlarge. The volumes of the aneurysm region defined by a surface passing through the neck at each examination time were 0.33 cm3, 0.32 cm3, and 0.49 cm3.
Figure 1.
Volume rendered longitudinal CTA images at three time points during the evolution of a growing cerebral aneurysm at the anterior communicating artery. Arrows point to the enlarging regions.
In Vitro Models
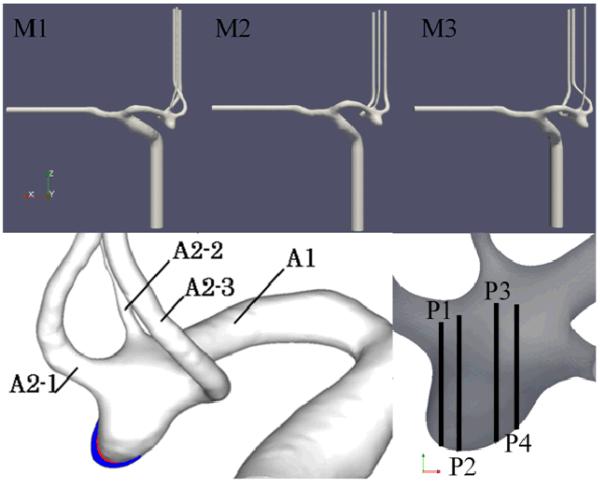
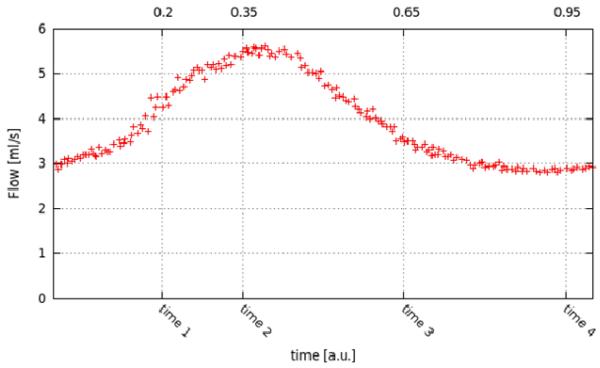
The aneurysm and connected arteries were manually segmented from the CTA images corresponding to each examination during the observation period. The resulting surfaces were smoothed to remove any stair-stepping artifacts and saved in stereolithographic (STL) format. The three vascular models (named M1, M2 and M3) are shown in Figure 2 (top row). This figure also shows the regions of aneurysmal enlargement (bottom left) and the locations of four planes (named P1, P2, P3, and P4) later used to compare experimental and computational flow fields (bottom right). The STL surfaces were scaled 3:1 with respect to the in vivo anatomical dimensions and used to build corresponding silicon models using rapid prototyping techniques and a 3D printer (R-Tec Corporation, Japan). An example is shown in Figure 3. These models were placed in a pulsatile flow loop and the velocity field was measured using PIV. The silicon models were condidered rigid since the distance from the inner wall to the external flat wall of the block was thick enough to neglect its distention. The PIV system comprised a laser sheet for the visualization of 1 mm thick plane of the flow field, trigged at intervals of 150μs, and a CCD camera with a resolution of 1376×1040 pixels. The camera and laser oscillator were fixed on a commercial stage controller (Sigma Koki Co., Japan) to allow the positioning and rotation of the camera and laser together. The working fluid used was a mixture of glycerin and water. To eliminate optical distortions, the refraction index of the working fluid was matched to that of the silicon resin by continuously varying the content of glycerin while checking the distortion of a pattern observed through the model. A solution of 58% glycerin by weight gave the best match to the silicon refraction index of 1.409. The viscosity and density of this working fluid were μ= 0.0082 Pa.s and ρ=1140 kg/m3, respectively. The PIV system was calibrated using images acquired in the PIV system and the STL data. With a slight change of the refraction index of the working fluid, the outline from the silicone inner wall on a measuring plane could be acquired on the PIV image. Counting the pixels on the image (e.g., the radius of the parent artery), the number of pixels was converted to a length (mm) based on the STL data on the same plane. The velocity vector field was calculated from the double-frame acquired images based on the path of the particles. The pulsatile flow conditions were derived from in vivo ultrasound measurements of flow velocities in ACA’s of normal subjects [23]. The inflow waveform was generated by adding a pulsatile flow to a steady flow. The pulsatile flow was produced by a pulse generator, which consisted of a numerically positioing-control servomotor (VLBS-A11012; Toei Electric, Tokyo, Japan) and a bellows pump (WB-0075629; Eagle Industry, Tokyo, Japan). In order to trigger the PIV system to collect images at the same point in the cardiac cycle, a douser was fixed at the edge of the turn table on the pulse generator. This douser passed a photointerrupter at the start point of each pulsatile cycle, producing a signal which was digitized by a G-program written in Labview software (National Instruments, Co.) in order to transmit the start point to the PIV system and trigger the laser pulse and the camera at the same time via a synchronizer. The PIV data were averaged through 30 cycles. During the PIV experiments, the flow in the A1 segment of the in vitro model was measured with ultrasound (Figure 4), and the inflow waveform was controlled to mimic the waveform shape and to match the Reynolds and Womersley numbers of the in vivo measurements. The Reynolds number based on the ACA diameter varied in the range of 450-800 and the Womersley number was 2.7. The flows in the outflow branches were set proportional to the corresponding vessel areas. Straight vessel segments were added at the model inlet/outlets to minimize boundary effects and allow for flow development. Because this PIV system cannot measure three-dimensional flow fields, the in-plane components of the flow velocity were measured on two sets of orthogonal planes separated by 1.0 mm at four instants of time during the cardiac cycle. The sets consisted in 19 planes perpendicular to the x-direction and 15 planes perpendicular to the y-direction. Each plane had a resolution of 43×32 points, and the separation between points was 0.82 mm in each direction for the first set and 0.78 mm for the second set. An estimation of the error or uncertainty of the PIV velocity measurements was obtained by comparing the z-velocity component, which was measured twice, once in the set of planes normal to x and again in the set of planes normal to y. Each measurement is the average over the 30 cardiac cycles. The absolute difference between the z-velocity of each measurement was calculated and averaged over the region of interest. The difference varies during the cardiac cycle between 4% and 10% of the peak systolic velocity. More details about the experimental setup and PIV measurements can be found in [19].
Figure 2.
Top row: Geometrical models of a growing intracranial aneurysm at three time points during its evolution reconstructed from corresponding longitudinal CTA images and used to construct corresponding PIV and CFD models. Bottom left: superposition of the vascular models showing the regions of aneurysm enlargement (white: model M1, red: model M2, blue: model M3). Bottom right: planes used to compare CFD and PIV flow fields.
Figure 3.
: Silicone model of the aneurysm corresponding to the last CTA examination (model M3).
Figure 4.
: Pulsatile flow waveform measured at the A1 segment of the PIV model and used to derive flow boundary conditions for the CFD model, and instants of time at which PIV measurements were performed. The time scale is in units of the cardiac cycle.
Computational Models
Computational fluid dynamics models of the aneurysm at each stage of its evolution were created from the corresponding STL surfaces. The computational models were built with a 1:1 scale with respect to the in vivo geometry. Unstructured grids composed of tetrahedral elements were generated using an advancing front technique and a minimum resolution of 0.02 cm [24, 25]. The resulting grids contained approximately 1.92 million, 1.77 million and 1.84 million elements, respectively. Blood flows were mathematically modeled using the unsteady 3D Navier-Stokes equations for an incompressible Newtonian fluid. The governing equations were advanced in time using a fully implicit scheme [26] that recasts the original equations as a steady-state problem in pseudo-time (ϑ) at each time-step (n):
| (1) |
| (2) |
where u is the velocity, p the pressure, ξ the kinematic viscosity, un denotes the velocity at the previous timestep and uζ=(1−ζ) un + ζ un+1. These equations are solved using a pressure-projection method where the spatial discretization is carried out using an edge-based upwind finite element method [24]. The discretized momentum equation is solved using a Generalized Minimal Residuals (GMRES) method and the discretized pressure Poisson equation is solved using an efficient deflated preconditioned conjugate gradients method [27]. The flow waveform measured in the A1 segment of the PIV model (Figure 4) was scaled to get matching Reynolds and Womersley numbers for the CFD model. The flow rate at the CFD inlet boundary in the internal carotid artery and the outflow through the middle cerebral artery were adjusted to match the scaled waveform at the A1 segment as closely as possible. A fully developed Womersley velocity profile was imposed at the model inlet. Traction-free boundary conditions were prescribed at the outlets and no-slip boundary conditions on the vessel walls. The pulsatile simulations were carried out using 100 timesteps per cardiac cycle, for a total of two cardiac cycles. Results are presented for the second cycle.
Post-Processing
The two sets of orthogonal PIV measurements of in plane flow velocities were used to recover a 3D velocity field at each instant during the cardiac cycle and for all the aneurysm geometries. Both sets of planes were interpolated and combined into a new data set. The combined volume was limited to the intersection of both sets, as it was necessary to have information of all three velocity directions. The resulting grid consisted of approximately 20,000 points. The velocity vector field was linearly interpolated to each point and the z-component (measured in both sets) was averaged between the two original sets. This new 3D PIV dataset included points within the fluid volume and points in the external space. Therefore, this dataset was masked to identify the points that belong to the fluid volume (i.e. with a non-zero velocity). Because the construction process of the in vitro model does not preserve the coordinate reference frame of the original CTA image data, it was necessary to align the 3D PIV and CFD dataset. This alignment was carried out manually until the models visually matched as closely as possible. Once aligned, the 3D PIV velocity data was interpolated to the CFD mesh points for comparison. Finally, in order to compare the flow fields of dynamically similar models (i.e. with same Reynolds and Womersley numbers but different scales) it was necessary to adimensionalize the velocity fields. This was done using the corresponding peak systole velocity magnitudes as the velocity scales. Subsequent flow visualizations and quantitative comparisons were carried out using the dimensionless velocity fields.
Flow Visualization
The instantaneous intra-aneurysmal flow patterns were visualized using streamlines color coded according to the local velocity magnitude. In order to depict the overall flow structure, a total of 100 streamlines were initiated at randomly selected locations within the aneurysm volume and traced in the forward and backward velocity directions. The flow structure was also visualized using a vortex coreline detection algorithm. Vortex corelines are defined in this work by the locus of points which share two of the following properties [28, 29]: (1) the velocity and acceleration vectors are parallel, and (2) the instantaneous streamline curvature is zero. Mathematically, these conditions can be expressed in the form of an eigenvalue equation:
| (3) |
that is satisfied by points in the computational domain where the velocity vector is an eigenvector of the velocity gradient tensor U. Corelines are computed algorithmically in the computational domain using the eigenvector method of Sujudi and Haimes [30]. For each tetrahedral element, the following steps are applied:
▪ Compute and diagonalize the Jacobian matrix for the host element.
▪ Verify that the eigenvalue spectrum consists of one real eigenvalue and a pair of complex conjugate eigenvalues. If this condition is not satisfied, skip to the next element.
▪ Form a reduced velocity vector w at each node in the element by subtracting the components of the velocity that point along the eigenvector associated with the real eigenvalue ζR. The reduced velocity can then be expressed as w = u − (u · ζR)ζR .
▪ For each face on the element, use linear interpolation to determine if there is a point on that face where the reduced velocity is zero. If two faces are found to have a zero point, the element is marked to contain a coreline segment.
Comparison
In order to quantitatively compare the CFD and PIV velocity fields, two simple indices for measuring their similarity were defined inspired in the measures described in [31]. The first measure, called the angular similarity index (ASI), is defined as the cosine of the angle subtended by the CFD and PIV velocity vectors at a given point in space:
| (4) |
This index varies in the range [−1,1], 1 being the highest angular similarity. The second measure, denoted the magnitude similarity index (MSI), is based on the absolute difference between normalized velocities, and is defined as:
| (5) |
This index varies in the range [0,1], 1 being the highest magnitude similarity. Finally, corresponding global similarity measures were then obtained from the point-to-point similarity indices as the volume integral of angular and magnitude similarities over the region of interest divided by the aneurysm volume.
Results
Realistic in vitro and computational hemodynamics models at three time points during the natural evolution of a growing intracranial aneurysm were constructed using the patient-specific geometry derived from longitudinal CTA images and pulsatile flow conditions. These models were used to compare the CFD and PIV flow fields, and to describe the intra-aneurysmal hemodynamics and its change during the aneurysm progression.
Flow Description and Qualitative Comparison between CFD and PIV
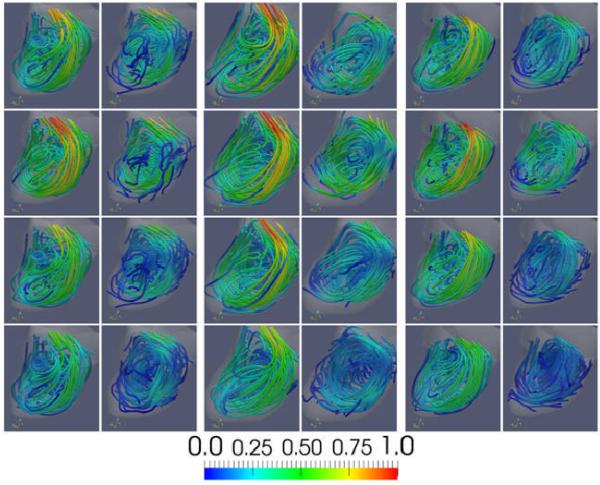
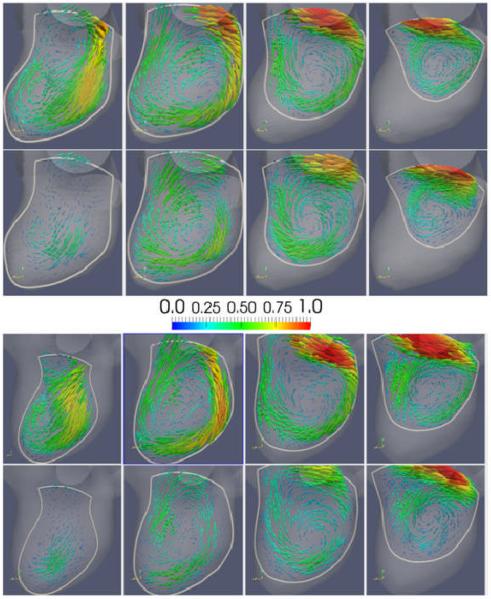
Visualizations of the intra-aneurysmal flow patterns are presented in Figure 5. Each panel of this figure (left, center and right) shows the CFD (left column) and PIV (right column) flow fields at the four instants of time during the cardiac cycle (rows), using instantaneous streamlines colored with the local velocity magnitude. It can be seen that the CFD and PIV flow fields are in good qualitative agreement and that both techniques yield a consistent description of the intra-aneurysmal hemodynamics for all geometries and all times during the cardiac circle. Specifically, these visualizations show that a thin layer of blood enters the aneurysm at the distal part of the orifice, impacts against the distal part of the aneurysm body, recirculates within the aneurysm sac and swirls into the three daughter branches (A2′s), although the most proximal A2 branch (A2-2) receives most of its flow from the proximal parent vessel and exhibits much less swirling. It can be seen that the overall flow structure persists during the cardiac cycle and that the main recirculation region expands and contracts as the flow accelerates and decelerates from the systolic to the diastolic phase. As the aneurysm grows, the main recirculation region becomes more elongated towards the aneurysm dome and changes slightly the position and orientation of its axis of rotation.
Figure 5.
: Visualizations of the aneurysmal blood flow pattern. The panels from left to right show the flow pattern at the three time points during the evolution of the aneurysm (corresponding to models M1, M2, and M3 of Figure 2). The left column of each panel shows the CFD flow field, while the right column the PIV flow field. The four rows show the flow fields at four instants of time during the cardiac cycle (time 1, 2, 3 and 4 of Figure 4).
Although the CFD and PIV techniques yield consistent flow patterns, there are differences between the corresponding flow fields that can be observed in Figure 5. First, it can be seen that in general the velocity magnitudes are higher in the CFD models than in the corresponding PIV models. Secondly, it can be seen that several of the PIV streamlines stop inside the aneurysm, near the wall. Thirdly, the PIV velocity magnitude is noticeably smaller close to the wall in the flow impingement region. In particular, the PIV velocity magnitude along streamlines seems to decrease as the streamline approaches the wall at the impingement location and then recovers its original values after the impingement zone.
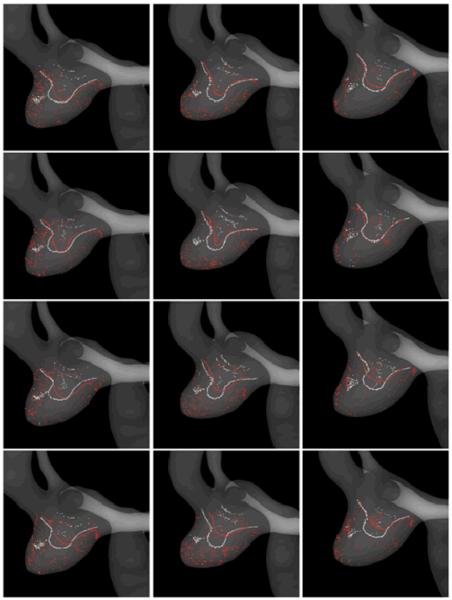
In order to analyze the similarities and differences of the CFD and PIV flow patterns and their variability during the cardiac cycle and during aneurysmal evolution, vortex corelines were computed and visualized. Figure 6 presents the CFD and PIV vortex corelines detected in the CFD (white) and PIV (red) flow fields for each of the aneurysm geometries (columns) and time instants during the cardiac cycle (rows). Again, these visualizations show that the CFD and PIV techniques yield consistent descriptions of the intra-aneurysmal flow structures. Essentially, the flow swirls around one main vortex coreline aligned with the outflow vessels (A2 branches) and bent towards the dome of the aneurysm. For each aneurysmal geometry, the main structure of the flow does not change substantially during the cardiac cycle, although some variability in the shape and location of the vortex corelines can be observed. It can be seen that the CFD and PIV vortex corelines tend to coincide. The largest differences are observed at end diastole, where the PIV lines have smaller curvatures and penetrate less towards the aneurysm dome than the CFD lines. This difference in turn results in a larger variability of the PIV flow structures during the cardiac cycle than the CFD data. The differences observed between the vortex corelines detected in the CFD and PIV flow fields are consistent with the differences in the velocity magnitudes observed in the streamline visualizations presented in Figure 5. For instance, the CFD lines are seen to penetrate deeper towards the aneurysm dome, consistent with higher velocities observed in the CFD flow field. As the aneurysm progresses, changes in the flow structure can also be observed. The aneurysm geometry expands mainly in the distal and right side of the wall (left on Figure 6). As the aneurysm elongates, the vortex corelines increase their curvatures and elongate accordingly (see changes from the left to the middle column in Figure 6). As the aneurysm continues to expand (from the middle column to the right column of Figure 6), the corelines recover a smoother shape but now penetrate less towards the dome; this is consistent with the previously described elongation of the main flow recirculation region observed in Figure 5. These changes in the aneurysm flow structure during its evolution are consistently observed in both the CFD and PIV data.
Figure 6.
: Visualizations of the CFD (white) and PIV (red) flow structures using vortex coreline detection algorithms. Columns correspond to the three time points during the aneurysm evolution (models M1, M2 and M3 of Figure 2), while the rows to the four instants of time during the cardiac cycle (time 1, 2, 3 and 4 of Figure 4).
Visualizations of the CFD and PIV velocity fields at peak systole (time 2) on four selected cut planes (P1-P4) are presented in Figure 7 for models M1 and M3. These visualizations show cuts of the main vortex structure within the aneurysm volume. It can be seen that the CFD and PIV techniques provide consistent descriptions of the velocity field. The major differences between the CFD and PIV velocity fields are observed near the walls. For instance on plane P1 (left most column of Figure 7) which is close to the aneurysm side wall, as well as near the flow impaction zone at the distal aneurysm wall. As the aneurysm progresses from geometry M1 to M3, it can be seen that the core of the main vortical structure has enlarged. Additionally, these visualizations show that before enlargement (model M1) the flow is attached to the wall at the dome, but as the aneurysm grows (model M3) a region of slow flow develops at the location of geometric progression and the flow seems to separate from the wall (see the bottom part of the aneurysm in planes P2 and P3 of Figure 7). These features are consistently observed in the CFD and the PIV flow fields.
Figure 7.
: Visualizations of CFD and PIV flow fields on four selected cut-planes at peak systole (time 2 of Figure 4). Columns show the four cut-planes (P1, P2, P3 and P4) indicated in Figure 2. Top panel shows model M1 and bottom panel model M3. Top row of each panel shows CFD fields, and bottom row PIV fields.
Quantitative Comparison between CFD and PIV
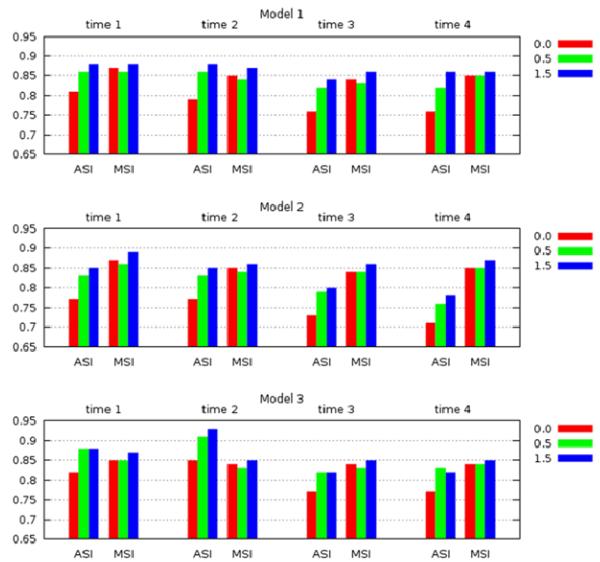
The CFD and PIV flow fields were quantitatively compared using the angular and magnitude similarity measures described before. As explained before the PIV data was interpolated to the CFD grid points and the similarity measures were then computed on the CFD grid. At the vessel wall, where the velocity is zero, the angular similarity yields a zero similarity, while the magnitude similarity yields a value of one. Furthermore, the PIV technique is known to suffer from larger measurement errors close to the walls. Thus, in order to study the influence of near wall errors, grid points close to the wall at progressively increasing distances to the wall were discarded and the similarities were re-calculated. In other words, the total similarity was computed as the integral of the similarity over the aneurysm region discarding a thin layer close to the wall. The thickness of this layer was varied from zero (thus including the entire aneurysm volume) to 1.5 p, where p represents the in plane pixel size of the PIV measurements (0.78 mm). The results are presented in Figure 8. This figure shows the total angular and magnitude similarities computed for each geometrical model at the four time instants during the cardiac cycle. The different bars indicate the values obtained after excluding a layer of 0.0 (red), 0.5 p (green) and 1.5 p (blue) from the aneurysm wall. Other intermediate values were computed (0.25p and 1.0p) but are not displayed in this figure as they do not add extra information. These results indicate that the CFD and PIV have a quantitative agreement above 75% for all models and all times, except for the angular similarity of model 2 at times 3 and 4 which only reaches 70%. If a layer along the aneurysm wall of thickness equal to a half of the PIV measurement pixel size (0.5 p) is excluded, the total similarity is above 80%, and if the layer thickness is increased to 1.5 p, then the overall similarity is above 85%. These results suggest that the CFD and PIV flow fields are in good quantitative agreement, especially in the interior of the aneurysm volume.
Figure 8.
: Total angular and magnitude similarity measures between the CFD and PIV flow fields, for each of the three model geometries and at each of the four instants of time during the cardiac cycle. Values are plotted after discarding points in a layer near the vascular wall of thickness corresponding to 0, 0.5 and 1.5 PIV pixels.
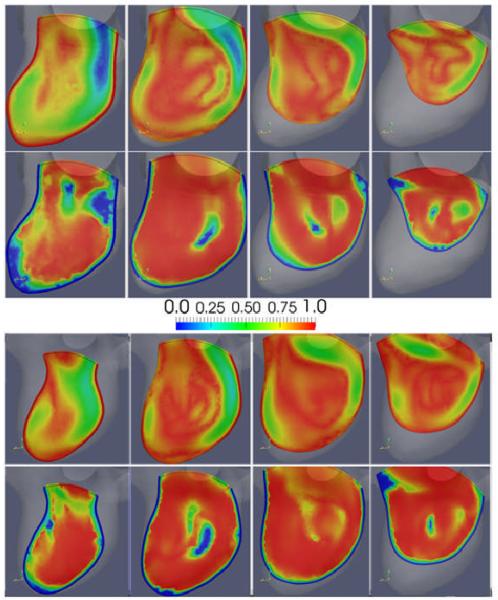
In order to illustrate the differences between the CFD and PIV flow fields, the magnitude and angular similarity measures plotted on the four selected cut-planes are presented in Figure 9 for models M1 (top panel) and M3 (bottom panel). Overall, these visualizations show good quantitative agreement between the two fields. The largest differences or lower similarities are observed near the wall. In particular, PIV seems to under-resolve the flow structure in the region where the thin inflow stream impacts the aneurysm wall, where the PIV inflow stream seems to disappear right before the impaction against the wall and to re-appear after the impingement region. Additionally, low angular similarities are observed in regions of low flow velocity.
Figure 9.
: Visualizations of the local similarities between the CFD and PIV flow fields on four selected cut-planes at peak systole (time 2 of Figure 4). Columns show the four cut-planes (P1, P2, P3 and P4) indicated in Figure 2. Top panel shows model M1 and bottom panel model M3. Top row of each panel shows magnitude similarity (MSI), and bottom row angular similarity (ASI).
Discussion
The results of the current study indicate that image-based CFD and PIV models yield consistent representations of the blood flow patterns in growing intracranial aneurysms, and their change during the natural evolution of the aneurysms. In particular, it was found that in the aneurysm considered, although the intra-aneurysmal flow pattern did exhibit some changes during aneurysmal progression these changes were not dramatic. This implies that the geometrical deformation of this aneurysm is small enough not to cause substantial changes in the structure of the intra-aneurysmal flow pattern, suggesting also a relatively slow aneurysmal progression. This observation is consistent with previous studies describing the hemodynamics in other growing cerebral aneurysms using CFD techniques in which the flow patterns were seen to persist (not change significantly) during the evolution of the aneurysms [15, 32]. However, some interesting observations at the location of aneurysm progression were made, consistently in both the CFD and PIV flow fields. Specifically, it was observed that as the aneurysm grew, a region of slow flows develops at the location where the wall expands, and that the flow in this region seems to separate from the wall. This observation is consistent with previous results related to bleb formation which suggested that as blebs form new counter current recirculation regions with slow flows are formed within the blebs, and that the blebs progress to states of lower wall shear stress [33]. Further investigations of the relationship between hemodynamics and aneurysm progression, including more aneurysms and analysis of the wall shear stress fields are needed in order to further understand the mechanisms of aneurysm evolution. This will be the subject of future studies.
The CFD and PIV results were found to be in good qualitative as well as quantitative agreement for all time instants during the cardiac cycle and for all stages of the evolution of the aneurysm. However, differences in the corresponding flow fields were observed. There are a number of sources of error and uncertainties that are briefly discussed in what follows. First, higher velocity magnitudes were observed in the CFD flow fields. This is likely due to an imperfect match of the non-dimensional parameters characterizing the flow, namely the Reynolds number and the Womersley number. The Reynolds number was computed from ultrasound velocity measurements obtained at the A1 branch proximal to the aneurysm in the in vitro model. In order to match the experimental Reynolds number, the inflow boundary conditions in the CFD model were adjusted to obtain similar maximal velocity values at roughly the same location as the ultrasound measurements. However, the exact location of these measurements was not known, thus this introduces an uncertainty in the flow conditions which likely results in non-matching velocity magnitudes. Secondly, some streamlines computed using the PIV velocity fields stopped inside the aneurysm volume. This implies a non-zero divergence of the PIV velocity field. In order to estimate the error introduced by this effect, the divergence of the normalized PIV velocity field was computed. The error in the velocity introduced by a non-zero divergence was then estimated by calculating the absolute value of the divergence averaged over the volume of the region of interest. This mean divergence induces an average variation in the velocity over a pixel volume of up to about 0.41%. However these errors were larger close to the walls where they reached values of approximately up to 12% to 40% during the cardiac cycle. The PIV measurements obtained on sets of orthogonal planes were combined into a 3D vector field by simple interpolation. The experimental data was not manipulated or filtered to obtain a divergence-free field. Thus, the observed behavior of streamlines is most likely due to measurement and interpolation errors. Thirdly, differences between the CFD and PIV fields were observed close to the aneurysm wall, in particular at the location of the impingement of the thin inflow stream against the aneurysm wall. Probably, these differences arise because of measurement errors of the PIV technique that are expected near the walls [34]. These findings are similar to those described by Ford et al. [22]. In particular, they observed stronger flows and higher velocities in the CFD than in the PIV models. They also reported that the PIV measurements did not capture details of the flow fields in the near wall region, and observed disagreements between the CFD and PIV fields in a few regions in the interior of the aneurysm volume away from the walls. Finally, differences in the experimental and computational modeling assumptions could also have introduced discrepancies in the flow fields. Both the PIV and CFD models were constructed starting from the same STL data in order to discard differences due to different segmentations which have been previously studied [35]. However, the final physical in vitro model constructed from the STL data may have geometric differences with the original STL data that can influence the flow results. Additionally, traction free boundary conditions were used at the outflows of the CFD models. This is a common approximation in many CFD models where it can reasonably be assumed that the distal vascular beds of the corresponding vessels (A2′s in this case) have comparable resistances to flow. However, in the PIV experiments the outflow rates were modulated with the vessel area. This difference in the modeling assumptions may introduce differences between the CFD and PIV flow fields. The differences in the CFD and PIV fields in turn affect the angular and magnitude similarity measurements. These similarities are also affected by any misalignment of the CFD and PIV models or slight differences in the location of the corresponding flow structures. Furthermore, the angular similarity is prone to produce large differences in regions of slow flow, as has been illustrated in Figure 7 (right panel, center of plane-cut). Finally, it was observed that the largest differences between the CFD and PIV results occur during the diastolic phase. This observation also suggests that if this assertion could be generalized, then hemodynamic variables based on systolic values defined for assessing risk of growth or rupture would probably have less dispersion and variability than variables based on diastolic values.
Conclusions
Image-based CFD and in vitro PIV models based on patient-specific geometries of a growing cerebral aneurysm were in good qualitative and quantitative agreement despite different assumptions and approximations made with each approach. The main differences between the two methods were found in regions close to the wall, in regions of slow flow and during the diastolic phase. Despite these differences, the representations of the intra-aneurysmal hemodynamic patterns provided by each technique were remarkably similar. The two techniques provided consistent descriptions of the intra-aneurysmal flow patterns and their variability during the cardiac cycle and during the natural evolution of the aneurysm. This implies that both approaches can be used to study the role of hemodynamics in the mechanisms governing the pathogenesis, growth and rupture of intracranial aneurysms. However, each approach has its own limitations, which must be carefully considered when interpreting the results produced by each technique.
Acknowledgements
This work was suppoted by the National Institutes of Health (grant # R01NS059063) for financial support. We also thank Philips Healthcare for financial support.
References
- 1.Kassell NF, Torner JC. Aneurysmal rebleeding: a preliminary report from the Cooperative Aneurysm Study. Neurosurgery. 1983;13:479–481. doi: 10.1227/00006123-198311000-00001. [DOI] [PubMed] [Google Scholar]
- 2.Weir B, Macdonald RL. Intracranial aneurysms and hemorrhage: an overview. In: Wilkins RS, RH, editors. Neurosurgery. McGraw-Hill; New York: 1996. pp. 2191–2213. [Google Scholar]
- 3.Rinkel GJ, Djibuti M, van Gijn J. Prevalence and risk of rupture of intracranial aneurysms: a systematic review. Stroke. 1998;29:251–259. doi: 10.1161/01.str.29.1.251. [DOI] [PubMed] [Google Scholar]
- 4.Wiebers DO, Torner JC, Meissner I. Impact of unruptured intracranial aneurysms on public health in the United States. Stroke. 1992;23:1416–1419. doi: 10.1161/01.str.23.10.1416. [DOI] [PubMed] [Google Scholar]
- 5.Kelly PJ, Stein J, Shafqat S, Eskey C, Doherty D, Chang Y, Kurina A, Furie KL. Functional recovery after rehabilitation for cerebellar stroke. Stroke. 1983;32:530–534. doi: 10.1161/01.str.32.2.530. [DOI] [PubMed] [Google Scholar]
- 6.Ropper AH, Zervas NT. Outcome 1 year after SAH from cerebral aneurysm. Management morbidity, mortality, and functional status in 112 consecutive good-risk patients. Journal of Neurosurgery. 1984;60:909–915. doi: 10.3171/jns.1984.60.5.0909. [DOI] [PubMed] [Google Scholar]
- 7.Juvela S, Porras M, Heiskanen O. Natural history of unruptured intracranial aneurysms: a long-term follow-up study. Journal of Neurosurgery. 1993;79:174–182. doi: 10.3171/jns.1993.79.2.0174. [DOI] [PubMed] [Google Scholar]
- 8.Murayama Y, Vinuela F, Duckwiler G, Gobin YP, Guglielmi G. Embolization of incidental aneurysms by using the Guglielmi detachable coil system. Journal of Neurosurgery. 1999;90:207–214. doi: 10.3171/jns.1999.90.2.0207. [DOI] [PubMed] [Google Scholar]
- 9.Wiebers DO, Whisnant JP, Huston J.r., Meissner I, Brown RDJ, Piepgras DG, Forbes GS, Thielen K, Nichols D, O’Fallon WM, Peacock J, Jaeger L, Kassell N, Kongable-Beckman GL, Torner JC. International Study of Unruptured Intracranial Aneurysms Investigators. Unruptured intracranial aneurysms: natural history, clinical outcome, and risks of surgical and endovascular treatment. Lancet. 2003;362(9378):103–110. doi: 10.1016/s0140-6736(03)13860-3. [DOI] [PubMed] [Google Scholar]
- 10.Tsutsumi K, Ueki K, Morita A, Kirino T. Risk of rupture from incidental cerebral aneurysms. Journal of Neurosurgery. 2000;93:550–553. doi: 10.3171/jns.2000.93.4.0550. [DOI] [PubMed] [Google Scholar]
- 11.Sforza D, Putman CM, Cebral JR. Hemodynamics of Cerebral Aneurysms. Ann Rev Fluid Mechanics. 2009;41:91–107. doi: 10.1146/annurev.fluid.40.111406.102126. [DOI] [PMC free article] [PubMed] [Google Scholar]
- 12.Cebral JR, Castro MA, Burgess JE, Pergolizzi R, Sheridan MJ, Putman CM. Characterization of cerebral aneurysm for assessing risk of rupture using patient-specific computational hemodynamics models. AJNR American Journal of Neuroradiology. 2005;26:2550–2559. [PMC free article] [PubMed] [Google Scholar]
- 13.Shojima M, Oshima M, Takagi K, Torii R, Hayakawa M, Katada K, Morita A, Kirino T. Magnitude and role of wall shear stress on cerebral aneurysm: computational fluid dynamic study of 20 middle cerebral artery aneurysms. Stroke. 2004;35(11):2500–2505. doi: 10.1161/01.STR.0000144648.89172.0f. [DOI] [PubMed] [Google Scholar]
- 14.Valencia A, Morales H, Rivera R, Bravo E, Galvez M. Blood flow dynamics in patient-specific cerebral aneurysm models: the relationship between wall shear stress and aneurysm area index. Med Eng Phys. 2008;30(3):329–40. doi: 10.1016/j.medengphy.2007.04.011. [DOI] [PubMed] [Google Scholar]
- 15.Boussel L, Rayz V, McCulloch C, Martin A, Acevedo-Bolton G, Lawton M, Higashida R, Smith WS, Young WL, Saloner D. Aneurysm growth occurs at region of low wall shear stress: patient-specific correlation of hemodynamics and growth in a longitudinal study. Stroke. 2008;39(11):2997–3002. doi: 10.1161/STROKEAHA.108.521617. [DOI] [PMC free article] [PubMed] [Google Scholar]
- 16.Jou LD, Wong G, Dispensa B, Lawton MT, Higashida RT, Young WL, Saloner D. Correlation between lumenal geometry changes and hemodynamics in fusiform intracranial aneurysms. AJNR Am J Neuroradiol. 2005;26(9):2357–63. [PMC free article] [PubMed] [Google Scholar]
- 17.Tateshima S, Tanishita K, Omura H, Villablanca JP, Vinuela F. Intra-anerysmal hemodynamics during the growth of unruptured aneurysm: in vitro study using longitudinal CT angiogram database. AJNR American Journal of Neuroradiology. 2007;28:622–627. [PMC free article] [PubMed] [Google Scholar]
- 18.Tateshima S, Murayama Y, Villablanca JP. Intraaneurysmal flow dynamics study featuring an acrylic aneurysm model manufactured using computerized tomography angiogram as a mold. Journal of Neurosurgery. 2001;95(6):1020–1027. doi: 10.3171/jns.2001.95.6.1020. [DOI] [PubMed] [Google Scholar]
- 19.Morino T, Tanoue T, Tateshima S, Vinuela F, Tanishita K. Intra-aneurysmal blood flow based on patient-specific CT angiogram. Exp Fluids. 2010;49:485–496. [Google Scholar]
- 20.Steinman DA, Milner JS, Norley CJ, Lownie SP, Holdworth DW. Image-based computational simulation of flow dynamics in a giant intracranial aneurysm. AJNR American Journal of Neuroradiology. 2003;24(4):559–566. [PMC free article] [PubMed] [Google Scholar]
- 21.Cebral JR, Castro MA, Burgess JE, Pergolizzi RS, Sheridan MJ, Putman CM. Characterization of Cerebral Aneurysms for Assessing Risk of Rupture By Using Patient-Specific Computational Hemodynamics Models. Am J Neuroradiol. 2005;26(10):2550–2559. [PMC free article] [PubMed] [Google Scholar]
- 22.Ford MD, Nikolov HN, Milner JS, Lownie SP, DeMont EM, Kalata W, Loth F, Holdsworth DW, Steinman DA. PIV-measured versus CFD-predicted flow dynamics in anatomically realistic cerebral aneurysm models. J Biomech Engr. 2008;130(2):021015-1/9. doi: 10.1115/1.2900724. [DOI] [PubMed] [Google Scholar]
- 23.Hennerici M, Rautenberg W, Sitzer G, Schwartz A. Transcranial Doppler ultrasound for the assessment of intracranial arterial flow velocity--Part 1. Examination technique and normal values. Surg Neurol. 1987;27(5):439–48. doi: 10.1016/0090-3019(87)90251-5. [DOI] [PubMed] [Google Scholar]
- 24.Löhner R. Applied CFD techniques. John Wiley & Sons; 2001. [Google Scholar]
- 25.Cebral JR, Castro MA, Appanaboyina S, Putman CM, Millan D, Frangi AF. Efficient pipeline for image-based patient-specific analysis of cerebral aneurysm hemodynamics: Technique and sensitivity. IEEE Transactions in Medical Imaging. 2005;24(1):457–467. doi: 10.1109/tmi.2005.844159. [DOI] [PubMed] [Google Scholar]
- 26.Cebral JR, Löhner R, Appanaboyina S, Putman CM. Image-Based Computational Hemodynamics Methods and Their Application for the Analysis of Blood Flow Past Endovascular Devices. In: Leondes CT, editor. Biomechanical Systems Technology: (1) Computational Methods. World Scientific; 2007. pp. 29–85. [Google Scholar]
- 27.Mut F, Aubry R, Löhner R, Cebral JR. Fast numerical solutions in patient-specific simulations of arterial models. Comm Num Meth Eng. 2009 doi: 10.1002/cnm.1235. DOI 10.1002/cnm.1235. [DOI] [PMC free article] [PubMed] [Google Scholar]
- 28.Roth M, Peikert R. A higher-order method for finding vortex core lines. Proc. IEEE Visualization Conference ‘98.1998. pp. 143–150. [Google Scholar]
- 29.Peikert R, Roth M. The parallel vectors operator-A vector field visualization primitive. Proc. IEEE Visualization Conference ‘99.1999. pp. 263–270. [Google Scholar]
- 30.Sujudi D, Haimes R. Tech. Report. Dept. of Aeronautics and Astronautics; MIT, Cambridge, MA: 1995. Identification of swirling flow in 3D vector fields. [Google Scholar]
- 31.Li H, Shen I. Similarity measure for vector field learning. Lecture Notes in Computer Science. 2006;3971:436–441. [Google Scholar]
- 32.Jou LD, Wong G, Dispensa B, Lawton MT, Higashida RT, Young WL, Saloner D. Correlation between lumenal geometry changes and hemodynamics in fusiform intracranial aneurysms. Am J Neuroradiol. 2005;26(9):2357–63. [PMC free article] [PubMed] [Google Scholar]
- 33.Cebral JR, Sheridan MJ, Putman CM. Hemodynamics and Bleb Formation in Intracranial Aneurysms. AJNR American Journal of Neuroradiology. 2010;31(2):304–310. doi: 10.3174/ajnr.A1819. [DOI] [PMC free article] [PubMed] [Google Scholar]
- 34.Raffel M, Willert CE, Kompenhans J. Particle image velocimetry: a practical guide (experimental fluid mechanics) Springer-Verlag; New York: 2007. [Google Scholar]
- 35.Venugopal P, Schmitt H, Duckwiler G, Valentino DJ. Effects of segmentation on patient-specific numerical simulation of cerebral aneurysm hemodynamics. Progress in Biomedical Optics and Imaging. 2006;7(1):F1–12. [Google Scholar]


