

Abstract
Objective
Prostate-specific antigen (PSA)-based prostate cancer (CaP) screening has been shown to reduce CaP mortality at the expense of detecting some tumors that might never cause symptoms. PSA velocity (PSAV) has been shown to predict cancer-specific mortality after treatment. Our objective was to determine whether PSAV risk count (i.e. number of times PSAV exceeds a specific cutpoint) could increase the specificity of screening for biopsy-detectable CaP and potentially life-threatening tumors.
Patients and Methods
From 1989 to 2001, we calculated 2 serial PSAV measurements in 18,214 CaP screening study participants, of whom 1125 (6.2%) were diagnosed with CaP. PSAV risk count was determined as the number of PSAV measurements >0.4 ng/ml/year (0, 1, or 2). We used receiver operating characteristic and reclassification analyses to examine the ability of PSAV risk count to predict screen-detected CaP and high-grade CaP.
Results
PSAV exceeded 0.4 ng/ml/year twice (risk count=2) in 40% of CaP cases compared to only 4% without cancer (p<0.0001). After adjusting for age and PSA, a PSAV risk count of 2 was associated with an 8.2-fold increased risk of CaP (95% CI, 7.0–9.6, p<0.0001) and 5.4-fold increased risk of Gleason score 8–10 CaP on biopsy. Compared to a model with age and PSA, the addition of PSAV risk count significantly improved discrimination (AUC 0.625 vs. 0.725, p=0.031) and reclassified individuals with respect to the risk of high-grade CaP (net reclassification, p≤0.0003).
Conclusion
Sustained rises in PSA indicate a significantly greater risk of CaP, particularly high-grade disease. Compared to men with a risk count ≤1, those with two PSAV measurements >0.4 ng/ml/year (risk count=2) had an 8-fold increased risk of CaP and 5.4-fold increased risk of Gleason 8–10 disease on biopsy, adjusting for age and PSA. Compared to PSA alone, PSAV risk count may be useful to reduce unnecessary biopsies and the diagnosis of low-risk CaP.
Keywords: prostate cancer, PSA velocity, risk count, screening, PSA
INTRODUCTION
Prostate-specific antigen (PSA)-based screening has become increasingly common in the United States and abroad.[1] According to data from the 2001 Behavioral Risk Factor Surveillance System, 54% of men aged 50 to 69 years had an up-to-date PSA test.[2] A separate cross-sectional survey of male physicians reported that 87% of those age 50 and older had undergone PSA testing.[3] In the 2005 National Health Interview Survey, 49% of men aged 50 to 79 reported a PSA test within 2 years.[4]
Two randomized trials of PSA-based screening with conflicting results were recently reported. The Prostate, Lung, Colorectal, Ovarian (PLCO) trial reported no difference in mortality between the screening and control arms.[5] By contrast, in the European Randomized Study of Screening for Prostate Cancer (ERSPC), PSA screening was associated with a 20% reduction in CaP mortality and 41% reduction in metastatic disease at diagnosis.[6] Nevertheless, ERSPC authors estimated that 1410 men would need to be screened and 48 treated to prevent one CaP death at 9 years. More recent studies have demonstrated a reduction in NNT with longer follow-up.[7, 8] Nevertheless, the ongoing controversy regarding the diagnosis of CaP that may not cause harm highlights the need for screening modalities with greater specificity for clinically significant CaP.
Both the PLCO and ERSPC used the absolute PSA level to recommend a prostate biopsy.[5, 6] PSA velocity, or the change in PSA units per year, was not included in the protocol for either trial. Although there is conflicting evidence,[9] some studies have shown an association between PSAV with CaP-specific mortality after surgery and radiation therapy[10, 11].
In 2007, Carter et al. proposed a novel way to evaluate PSA dynamics, a concept known as the PSAV risk count.[12] It is calculated by counting the number of times that PSAV exceeds a specific threshold value. Among 717 non-screened men from an aging study, the relative risk was 1.49 (i.e. ~50% increased risk) for high-risk CaP when the PSAV exceeded 0.4 ng/ml/year more than once (risk count >1). Moreover, the addition of PSAV risk count to a model with PSA, age and date significantly improved model fit.
The PSAV risk count concept has not been examined in a screening population. We sought to determine whether PSA velocity risk count could improve the specificity of PSA screening for CaP and specifically for high-grade disease.
METHODS
Study Population
From 1989 to 2001, 35,536 men participated in a CaP screening study. PSA and DRE were performed at 6 to 12 month intervals, as previously described.[13] Prostate biopsy was recommended for PSA levels >4 ng/ml (before 1995) or >2.5 ng/ml (after 1995), and/or suspicious findings on DRE. The study protocol was approved by the institutional review board, and all participants provided informed consent.
We excluded 17,332 (48.8%) men with <3 PSA measurements prior to CaP diagnosis or censorship, for whom a PSAV risk count calculation was not possible. Of excluded individuals, 2444 (14.1%) were diagnosed with CaP. The final study population consisted of the remaining 18,214 men, including 1125 (6.2%) diagnosed with CaP.
PSAV Risk Count Calculation
Two successive PSAV calculations were performed, PSAV2 and PSAV1. PSAV2 included the final PSA (at diagnosis or censorship) and the PSA measurements prior to that. PSAV1 was defined as the PSAV leading up to PSAV2. In all cases, the PSAV calculation was restricted to PSA values separated by at least 6 months and a maximum of 24 months.
The PSAV risk count was then calculated by counting the number of times that PSAV exceeded the cutpoint 0.4 ng/ml/year. This threshold value was selected based upon the original risk count description by Carter and associates[12], as well as by our own recent studies demonstrating the association between a single PSAV measurement >0.4 ng/ml/year with CaP detection,[14] and with the presence of clinically significant CaP at radical prostatectomy.[15] Also, the 2011 NCCN Guidelines recommend considering prostate biopsy for men with total PSA levels ≤2.5 ng/ml and a PSAV ≥0.35 ng/ml/year.[16]
In the current study, a risk count of 0 indicated that neither PSAV2 nor PSAV1 exceeded 0.4 ng/ml/year. A risk count of 1 signified that either PSAV2 or PSAV1 was greater than 0.4 ng/ml/year but not both; whereas, a risk count of 2 meant that both PSAV2 and PSAV1 were >0.4 ng/ml/year.
Statistical Analysis
We used SAS for LINUX for all statistical analysis. Demographic characteristics and PSAV risk count were compared using the t-test, Wilcoxon rank sum, chi-square and Fisher’s exact tests. The Armitage chi-square test was used to test for trend between a risk count of 0, 1 and 2. Logistic regression was used for multivariate analysis to predict CaP using age (continuous), PSA at diagnosis/censorship (continuous), and PSAV risk count. A separate model also including family history was performed in the 16,230 (89.1%) men with family history data.
CaP-free survival curves were generated using the Kaplan-Meier method and were compared by the log rank test. Receiver operating characteristic (ROC) analysis was used to examine the discrimination of a model including age and PSA at diagnosis/censorship, and to determine whether the addition of PSAV risk count significantly improved discrimination.
We also performed several subset analyses. Due to the reduction in our PSA threshold for biopsy (from 4 to 2.5 ng/ml) in 1995, separate logistic regression models were performed to examine the utility of PSAV risk count in the time intervals before and after this change in the study protocol. We performed separate logistic regression models to evaluate PSAV risk count after stratifying the study population into the following total PSA ranges: <2.6, 2.6–4.0, and >4.0 ng/ml. We performed a separate analysis including the 14,024 men with at least 4 successive PSA measurements to determine the utility of PSAV risk count calculated over a longer interval. In this subgroup, we determined the association between risk counts ranging from 0 to 3 with CaP detection. A risk count of 3 indicated that all 3 serial PSAV measurements exceeded 0.4 ng/ml/year.
Finally, due to the possibility for misclassification in participants who did not undergo a biopsy,[17] we performed a subgroup analysis in 1524 men undergoing a first prostate biopsy with at least 3 PSA measurements prior to the biopsy from which to calculate PSAV risk count. These data were used to examine the association between PSAV risk count with the presence or absence of CaP on biopsy and with the detection of high-grade CaP.
We used ROC analysis to determine whether PSAV risk count improved discrimination of high-grade disease. ROC analysis represents the area under the plot of sensitivity versus false positive rate (1-specificity), and is equivalent to the probability that a predictive model will assign a higher probability of an event to subjects who subsequently have an event.
Because ROC analysis may be insensitive to the addition of new risk factors unless they have extremely high risk ratios,[18] we also used net reclassification analysis to determine whether PSAV improved the prediction of high-grade disease using two different criteria for high-risk disease (Gleason score ≥7 and Gleason score 8 to 10). As described by Pencina et al.,[19] net reclassification analysis was designed to assess the improvement in prediction using a new risk factor for an event when added to standard risk factors. It is based on the net reclassification improvement (NRI) defined when comparing the estimated probability of having an event for a model with standard risk factors to that of a model which adds the new risk factor. NRI represents the sum of the improvement in sensitivity and improvement in specificity when the new risk factor is added to standard risk factors. By assuming independence between event and non-event subjects, a z test was developed to test whether the null hypothesis that NRI is zero can be rejected.
RESULTS
Table 1 shows the demographic characteristics of the study population. Men diagnosed with CaP were slightly younger at the last PSA measurement (67 vs. 68 years, p=0.003) and were significantly more likely to have a family history of CaP. PSA at diagnosis/censorship was significantly higher in men with CaP than those without it, as was PSAV (0.8 versus 0.1 ng/ml/year, p<0.0001).
Table 1.
Demographics of the study population.
| Overall | Cancer | No Cancer | P value | |
|---|---|---|---|---|
| Mean age at last PSA (years) | 67 (41–95) | 67 (41–89) | 68 (41–95) | 0.003 |
| Race (% white) | 17036 (94%) | 938 (83.4%) | 16098 (94%) | 0.20 |
| Family history (%) | 2330 (14%) | 128 (19%) | 2202 (14%) | 0.0005 |
| Median PSA (ng/ml) | 1.3 (0.0–164.0) | 4.1 (0.1–45.3) | 1.2 (0.0–164.0) | <0.0001 |
| Median last PSAV (ng/ml/year) | 0.1 (−34.9–132.0) | 0.8 (−32.3–38.1) | 0.1 (−34.9–132.0) | <0.0001 |
Of the men diagnosed with CaP, 230 (20%), 440 (39%), and 455 (40%) had a PSAV risk count of 0, 1, and 2, respectively. By contrast, the majority of men without CaP (68%) had a PSAV risk count of 0, 4755 (28%) had a risk count of 1, and only 674 (4%) had a risk count of 2 (p<0.0001 comparing trend in CaP vs. non-CaP).
Table 2 shows the results of multivariate analysis in the overall study population. After adjusting for age and PSA, PSAV risk count was associated with an 8.2-fold increased odds ratio for CaP (95% CI, 7.0–9.6, p<0.0001). Similar results were found with the addition of family history to the model (family history OR 1.3, 95% CI 1.1–1.6, p=0.02).
Table 2.
Multivariate analysis for the prediction of prostate cancer in the overall study population.
| OR | 95% CI | P value | |
|---|---|---|---|
| Age | 0.99 | 0.98–1.00 | 0.13 |
| PSA | 1.25 | 1.22–1.28 | <0.0001 |
| PSAV Risk Count 2 vs. 0–1 | 8.2 | 7.0–9.6 | <0.0001 |
On ROC analysis to predict overall CaP, a model including PSA and age had an AUC of 0.89, which improved significantly with the addition of PSAV risk count (AUC 0.90, p=0.026). Overall, a PSAV risk count of 2 was associated with 40% sensitivity, 96% specificity, 40% positive predictive value, and 96% negative predictive value.
Kaplan-Meier survival analysis for freedom from CaP diagnosis is shown in Figure 1. 7-year screening study-detectable cancer-free survival was 96% for men with a PSAV risk count of 0 to 1, versus 61% with a risk count of 2 (p<0.0001).
Figure 1.
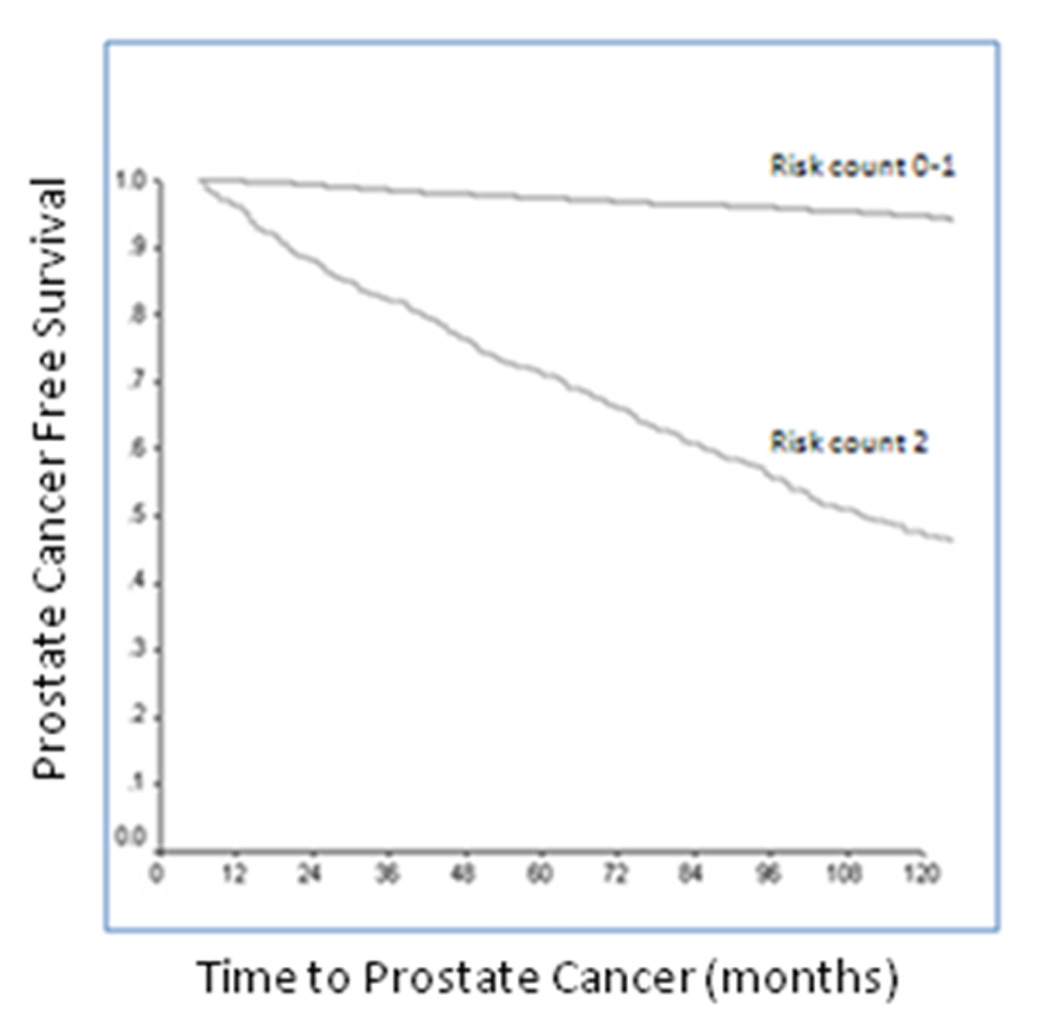
Kaplan-Meier curve for cumulative freedom from prostate cancer, stratified by a PSAV risk count of 0–1 versus 2.
The results of subset analyses before and after 1995 (when the total PSA threshold for biopsy was reduced from 4.0 to 2.5 ng/ml) are shown in Table 3. Irrespective of the time interval, both PSA and PSAV risk count were significantly associated with CaP risk after adjustment for age.
Table 3.
Multivariate models to predict prostate cancer in the subsets (a) before and (b) after the PSA threshold for biopsy was lowered in 1995.
| (a) | |||
|---|---|---|---|
| OR | 95% CI | P value | |
| Age | 1.02 | 1.00–1.04 | 0.05 |
| PSA | 1.18 | 1.12–1.25 | <0.0001 |
| Risk 2 vs. 0,1 | 7.8 | 5.6–10.9 | <0.0001 |
| (b) | |||
| OR | 95% CI | P value | |
| Age | 0.99 | 0.98–1.00 | 0.09 |
| PSA | 1.22 | 1.19–1.26 | <0.0001 |
| Risk 2 vs. 0,1 | 6.9 | 5.7–8.4 | <0.0001 |
Multivariate models were also performed after stratification by the total PSA level. In the strata with PSA levels <2.6, 2.6–4.0, and >4.0 ng/ml, PSAV risk count maintained a significant association with CaP detection, with OR’s of 4.2 (p=0.0002), 2.3 (p<0.0001), and 3.6 (p<0.0001), respectively.
Among 14,024 men with at least 4 PSA measurements, 142 (15%) men with CaP had a risk count of 3, compared to 87 (1%) without CaP (p<0.0001). On multivariate analysis with age and PSA, a risk count of 3 (compared to a risk count of 0 to 2) was associated with a 7.4-fold increased OR for CaP (95% CI, 5.5–10.0, p<0.0001).
Finally, in 1524 men undergoing a first prostate biopsy, 390 (25.6%) were diagnosed with CaP. The Gleason score was 6 in 318 (81.5%), 7 in 48(12.3%), 8 to 10 in 21(5.4%), and missing in 3 (0.8%) men.
Prior to biopsy, 140 (36%) of men diagnosed with CaP had a PSAV risk count of 2, compared to 245 (22%) men with a negative biopsy (p<0.0001). In this subgroup, a risk count of 2 prior to a first prostate biopsy was associated with a 1.9-fold increased odds (95% CI, 1.5–2.4, p<0.0001) for detecting CaP on biopsy after adjusting for age and PSA.
Table 4 shows the robust univariate association between PSAV risk count and biopsy Gleason grade (p=0.007). On multivariate analysis, PSAV risk count (OR 5.4, 95% CI 2.2–13.3, p=0.0002) was more strongly associated with Gleason 8 to 10 CaP than PSA (OR 1.07, 95% CI 0.95–1.20, p=0.29) or age (OR 1.06, 95% CI 0.99–1.13, p=0.07).
Table 4.
The association between PSA velocity risk count and Gleason grade on first prostate biopsy.
| Risk Count | Gleason 6 | Gleason 7 | Gleason 8–10 | p-value |
|---|---|---|---|---|
| 2 | 106 (33.3%) | 20 (41.7%) | 13 (61.9%) | 0.007 |
| 0,1 | 212 (66.7%) | 28 (58.3%) | 8 (38.1%) |
Figure 2 shows ROC analysis for the prediction of Gleason 8 to 10 CaP on biopsy. A model with PSA and age had an AUC of 0.625 which increased to 0.725 with the addition of PSAV risk count (p=0.031). Finally, Figure 3 shows the results of net reclassification analysis. Overall, PSAV risk count (using a scale of 0–2) significantly altered the probability of Gleason score ≥7 (z=6.5, p=3.0e–11) and Gleason score ≥8 CaP (z=3.5, p=0.0003), beyond age and the total PSA level. Similarly, in the subset with 3 serial PSAV measurements, the addition of risk count (using a scale of 0–3) to a model with age and total PSA significantly altered the probability of Gleason score ≥7 (z=6.9, p=2.4e–12) and Gleason score ≥8 (z=3.6, p=0.0002) CaP.
Figure 2.

ROC analysis for the prediction of Gleason 8 to 10 prostate cancer on needle biopsy in a base model with PSA and age, and with the addition of PSA velocity risk count to the model.
Figure 3.

Net reclassification analysis comparing the predicted probability of Gleason>=7 and Gleason>=8 prostate cancer based upon a model with PSA and age (x-axis), versus the expanded model also including PSAV risk count (y-axis).
COMMENT
PSA screening has somewhat fallen victim to its own success. The widespread use of PSA has led to a considerable stage migration, and CaP death rates have decreased more than for any other cancer. However, the previous concern over high rates of advanced disease at diagnosis has been replaced by concern over the identification of indolent tumors through screening.
Despite considerable refinement in radical prostatectomy and radiation therapy over the past few decades,[20] all forms of definitive CaP treatment are associated with potential morbidity.[21] An alternative management approach for low-risk CaP is active surveillance. However, the majority of men diagnosed with low-risk CaP in the United States undergo definitive therapy within 12 months of diagnosis.[22] Additionally, active surveillance is controversial due to the limitations of assessing “true” disease extent and grade on prostate biopsy, and heterogeneity in existing surveillance protocols with respect to patient selection and triggers for intervention.[23] These complex issues make the diagnosis of cancers that may not cause harm an important concern.
A possible aid in reducing diagnosis of potentially harmless cancer is to increase the specificity of screening for clinically significant CaP through the use of PSA kinetics. D’Amico et al. previously showed that PSAV predicted the risk of CaP-specific mortality after CaP treatment.[10, 11] Also, in the Baltimore Longitudinal Study of Aging, a PSAV >0.35 ng/ml/year more than 10 to 15 years prior to diagnosis predicted life-threatening CaP.[24] More recently, in our surgical series, we found that men with a single preoperative PSAV <0.4 ng/ml/year were twice as likely to have pathologically “insignificant” CaP in the prostatectomy specimen.[15]
However, other studies have found differing results. For example, Wolters et al. examined the utility of PSAV to predict “insignificant” CaP based upon a nomogram probability in men with PSA ≥3 ng/ml who underwent biopsy in the second round of the ERSPC Rotterdam.[25] Unlike our study, the authors calculated PSAV using two PSA measurements separated by 4 years. Although PSAV was significantly associated with “significant” CaP on univariate analysis, it lost significance in the multivariable model. Possible explanations for the conflicting findings in prior studies include the use of different criteria to define insignificant disease and different methods of PSAV calculation.
In the context of CaP screening, men frequently present to the clinic with a prior PSA history of variable length, and it is unclear how to best organize these data in a clinically meaningful fashion. To this end, Carter et al. proposed counting the number of times that serial PSAV measurements exceed a specific cutpoint (0.4 ng/ml/year).[12] In their non-screened population from the Baltimore Longitudinal Study of Aging, PSAV risk count was significantly associated with the probability of life-threatening CaP.
In the current study, we tested the utility of PSAV risk count for CaP screening. After adjusting for PSA and age, men with 2 serial PSAV measurements >0.4 ng/ml/year (risk count =2) had an 8.2-fold increased risk of CaP compared to those with a risk count ≤1. The statistically significant independent association between PSAV risk count and CaP was maintained in subset analyses stratifying by the study interval or total PSA ranges. Additionally, men with a PSAV risk count of 2 prior to prostate biopsy had a 5.4-fold increased risk of Gleason 8 to 10 CaP on multivariate analysis. Both ROC analysis and net reclassification analysis revealed a significant improvement in the prediction of high-grade CaP using PSAV risk count, as compared to PSA and age alone. These findings suggest that a prostate biopsy trigger based on the PSAV risk count might reduce the number of unnecessary prostate biopsies, the diagnosis of low grade, indolent cancer, and correspondingly the potential over-treatment of these cancers.
A limitation of our study is the potential for verification bias.[26] To reduce the potential for misclassification, we performed subgroup analysis including only those individuals who underwent a prostate biopsy, confirming a robust independent association between PSAV risk count and histological findings.
Another limitation of our study is that despite the large sample size (n=18,214), an additional 17,322 men were excluded who did not have sufficient PSA measurements prior to CaP diagnosis or censorship to enable a PSAV risk count calculation. The requirement for multiple PSA values introduces a bias, as suggested by the higher CaP detection rate in the excluded population. Furthermore, CaP diagnosed through serial screening is more likely to have favorable features,[27] as demonstrated by significantly higher median PSA and a greater proportion of palpable disease among the excluded men from our screening study.
The requirement for multiple PSA values will also preclude the use of PSAV risk count for patients who present to the clinic with a limited PSA history; however, when feasible, our results confirm that risk count has a robust association with CaP risk, and especially with high-grade disease.
Another limitation of our study is that the majority of men were Caucasian, potentially limiting the generalizability of these findings to other ethnic groups. Overall, as in prior studies,[25] there are significant drawbacks to the examination of PSA kinetics in screening programs not designed to evaluate this issue. Future studies are warranted to prospectively evaluate the use of PSAV risk count as an indication for prostate biopsy, as well as its possible role in multivariable predictive tools.
CONCLUSION
Men with two successive PSAV measurements >0.4 ng/ml/year (risk count =2) had approximately an 8-fold increased risk for CaP, controlling for age and serum PSA concentration. Among men undergoing prostate biopsy, there was a 5-fold increased risk of Gleason >8 CaP with a PSAV risk count of 2 when compared to a risk count of 0 or 1. Furthermore, the addition of PSAV risk count to a model with PSA and age significantly improved the discrimination for Gleason ≥ 8 CaP on biopsy and led to net reclassification improvement. These results suggest that PSAV risk count may be useful to reduce the number of unnecessary prostate biopsies and the diagnosis of low-risk CaP when compared to PSA alone.
ACKNOWLEDGEMENT
We would like to thank Dr. H. Ballentine Carter for critical review of the manuscript.
WJC’s research is supported in part by the Urological Research Foundation, Prostate SPORE grant (P50 CA90386-05S2) and the Robert H. Lurie Comprehensive Cancer Center grant (P30 CA60553). Disclosures for WJC are Beckman Coulter, Inc., Nanosphere, Inc., OHMX (manufacturers of PSA tests), and deCODE Genetics. EJM is supported by the Intramural Research Program of the National Institute of Health, National Institute on Aging. SL, DK, and KAR have no disclosures.
REFERENCES
- 1.Kvale R, Auvinen A, Adami HO, et al. Interpreting trends in prostate cancer incidence and mortality in the five Nordic countries. J Natl Cancer Inst. 2007 Dec 19;99:1881–1887. doi: 10.1093/jnci/djm249. [DOI] [PubMed] [Google Scholar]
- 2.Sirovich BE, Schwartz LM, Woloshin S. Screening men for prostate and colorectal cancer in the United States: does practice reflect the evidence? Jama. 2003 Mar 19;289:1414–1420. doi: 10.1001/jama.289.11.1414. [DOI] [PubMed] [Google Scholar]
- 3.Chan EC, Barry MJ, Vernon SW, Ahn C. Brief report: physicians and their personal prostate cancer-screening practices with prostate-specific antigen. A national survey. J Gen Intern Med. 2006 Mar;21:257–259. doi: 10.1111/j.1525-1497.2006.00327.x. [DOI] [PMC free article] [PubMed] [Google Scholar]
- 4.Ross LE, Berkowitz Z, Ekwueme DU. Use of the prostate-specific antigen test among U.S. men: findings from the 2005 National Health Interview Survey. Cancer Epidemiol Biomarkers Prev. 2008 Mar;17:636–644. doi: 10.1158/1055-9965.EPI-07-2709. [DOI] [PubMed] [Google Scholar]
- 5.Andriole GL, Crawford ED, Grubb RL, 3rd, et al. Mortality results from a randomized prostate-cancer screening trial. N Engl J Med. 2009 Mar 26;360:1310–1319. doi: 10.1056/NEJMoa0810696. [DOI] [PMC free article] [PubMed] [Google Scholar]
- 6.Schroder FH, Hugosson J, Roobol MJ, et al. Screening and prostate-cancer mortality in a randomized European study. N Engl J Med. 2009 Mar 26;360:1320–1328. doi: 10.1056/NEJMoa0810084. [DOI] [PubMed] [Google Scholar]
- 7.Hugosson J, Carlsson S, Aus G, et al. Mortality results from the Goteborg randomised population-based prostate-cancer screening trial. Lancet Oncol. 2010;11:725–732. doi: 10.1016/S1470-2045(10)70146-7. [DOI] [PMC free article] [PubMed] [Google Scholar]
- 8.Loeb S, Vonesh EF, Metter EJ, Carter HB, Gann PH, Catalona WJ. What is the true number needed to screen and treat to save a life with prostate-specific antigen testing? J Clin Oncol. 2011 Feb 1;29:464–467. doi: 10.1200/JCO.2010.30.6373. [DOI] [PMC free article] [PubMed] [Google Scholar]
- 9.Vickers AJ, Savage C, O'Brien MF, Lilja H. Systematic review of pretreatment prostate-specific antigen velocity and doubling time as predictors for prostate cancer. J Clin Oncol. 2009 Jan 20;27:398–403. doi: 10.1200/JCO.2008.18.1685. [DOI] [PMC free article] [PubMed] [Google Scholar]
- 10.D'Amico AV, Chen MH, Roehl KA, Catalona WJ. Preoperative PSA velocity and the risk of death from prostate cancer after radical prostatectomy. N Engl J Med. 2004 Jul 8;351:125–135. doi: 10.1056/NEJMoa032975. [DOI] [PubMed] [Google Scholar]
- 11.D'Amico AV, Renshaw AA, Sussman B, Chen MH. Pretreatment PSA velocity and risk of death from prostate cancer following external beam radiation therapy. Jama. 2005 Jul 27;294:440–447. doi: 10.1001/jama.294.4.440. [DOI] [PubMed] [Google Scholar]
- 12.Carter HB, Kettermann A, Ferrucci L, Landis P, Metter EJ. Prostate-specific antigen velocity risk count assessment: a new concept for detection of life-threatening prostate cancer during window of curability. Urology. 2007 Oct;70:685–690. doi: 10.1016/j.urology.2007.05.010. [DOI] [PMC free article] [PubMed] [Google Scholar]
- 13.Smith DS, Catalona WJ. Rate of change in serum prostate specific antigen levels as a method for prostate cancer detection. J Urol. 1994 Oct;152:1163–1167. doi: 10.1016/s0022-5347(17)32528-4. [DOI] [PubMed] [Google Scholar]
- 14.Loeb S, Roehl KA, Nadler RB, Yu X, Catalona WJ. Prostate specific antigen velocity in men with total prostate specific antigen less than 4 ng/ml. J Urol. 2007 Dec;178:2348–2352. doi: 10.1016/j.juro.2007.08.016. discussion 52-3. [DOI] [PubMed] [Google Scholar]
- 15.Loeb S, Roehl KA, Helfand BT, Kan D, Catalona WJ. Can PSA Velocity Thresholds Reduce the Detection of Insignificant Prostate Cancer? J Urol. 2010 doi: 10.1016/j.juro.2009.08.156. (in press) [DOI] [PMC free article] [PubMed] [Google Scholar]
- 16. [Accessed June 25, 2011];National Comprehensive Cancer Network Clinical Practice Guidelines in Oncology. 2011 http://www.nccn.org/professionals/physician_gls/pdf/prostate_detection.pdf.
- 17.Thompson IM, Pauler DK, Goodman PJ, et al. Prevalence of prostate cancer among men with a prostate-specific antigen level< or =4.0 ng per milliliter. N Engl J Med. 2004 May 27;350:2239–2246. doi: 10.1056/NEJMoa031918. [DOI] [PubMed] [Google Scholar]
- 18.Cook NR. Use and misuse of the receiver operating characteristic curve in risk prediction. Circulation. 2007 Feb 20;115:928–935. doi: 10.1161/CIRCULATIONAHA.106.672402. [DOI] [PubMed] [Google Scholar]
- 19.Pencina MJ, D'Agostino RB, Sr, D'Agostino RB, Jr, Vasan RS. Evaluating the added predictive ability of a new marker: from area under the ROC curve to reclassification and beyond. Stat Med. 2008 Jan 30;27:157–172. doi: 10.1002/sim.2929. discussion 207-12. [DOI] [PubMed] [Google Scholar]
- 20.Walsh PC, Lepor H, Eggleston JC. Radical prostatectomy with preservation of sexual function: anatomical and pathological considerations. Prostate. 1983;4:473–485. doi: 10.1002/pros.2990040506. [DOI] [PubMed] [Google Scholar]
- 21.Sanda MG, Dunn RL, Michalski J, et al. Quality of life and satisfaction with outcome among prostate-cancer survivors. N Engl J Med. 2008 Mar 20;358:1250–1261. doi: 10.1056/NEJMoa074311. [DOI] [PubMed] [Google Scholar]
- 22.Miller DC, Gruber SB, Hollenbeck BK, Montie JE, Wei JT. Incidence of initial local therapy among men with lower-risk prostate cancer in the United States. J Natl Cancer Inst. 2006 Aug 16;98:1134–1141. doi: 10.1093/jnci/djj308. [DOI] [PubMed] [Google Scholar]
- 23.Klotz L. Active surveillance for prostate cancer: for whom? J Clin Oncol. 2005 Nov 10;23:8165–8169. doi: 10.1200/JCO.2005.03.3134. [DOI] [PubMed] [Google Scholar]
- 24.Carter HB, Ferrucci L, Kettermann A, et al. Detection of life-threatening prostate cancer with prostate-specific antigen velocity during a window of curability. J Natl Cancer Inst. 2006 Nov 1;98:1521–1527. doi: 10.1093/jnci/djj410. [DOI] [PMC free article] [PubMed] [Google Scholar]
- 25.Wolters T, Roobol MJ, Bangma CH, Schroder FH. Is prostate-specific antigen velocity selective for clinically significant prostate cancer in screening? European Randomized Study of Screening for Prostate Cancer (Rotterdam) Eur Urol. 2009 Feb;55:385–392. doi: 10.1016/j.eururo.2008.02.046. [DOI] [PubMed] [Google Scholar]
- 26.Punglia RS, D'Amico AV, Catalona WJ, Roehl KA, Kuntz KM. Effect of verification bias on screening for prostate cancer by measurement of prostate-specific antigen. N Engl J Med. 2003 Jul 24;349:335–342. doi: 10.1056/NEJMoa021659. [DOI] [PubMed] [Google Scholar]
- 27.Roehl KA, Eggener SE, Loeb S, Smith ND, Antenor JA, Catalona WJ. Survival results in patients with screen-detected prostate cancer versus physician-referred patients treated with radical prostatectomy: early results. Urol Oncol. 2006 Nov-Dec;24:465–471. doi: 10.1016/j.urolonc.2005.11.039. [DOI] [PubMed] [Google Scholar]