Abstract
Introduction
This cross sectional study was conducted to test reproducibility of analysis of MRI parameters in carotids and thoracic descending aorta (TOA), evaluate the correlation of plaque burden and associations with subject age and gender.
Methods
Three hundred subjects, with cardiovascular risk factors, underwent a black blood MRI of both carotids and TOA. Mean wall area, wall thickness, lumen area, total vessel area and wall area/total vessel area (WA/TVA) ratio were manually measured. Inter-reader and intra-reader-reproducibility was tested on 187 and 20 randomly chosen subjects respectively.
Results
The intra-observer-reproducibility for the analysis was high (Intraclass-Correlation-Coefficients (ICC’s >0.8), except mean WA/TVA ratio of TOA. Similarly, the inter-observer reproducibility was acceptable (ICC’s >0.7 for mean wall area, lumen area and total vessel area). MRI parameters in aorta and carotids increased with age for both sexes (p<0.001). Except for mean wall thickness of TOA and WA/TVA ratio, MRI parameters were significantly higher in males than in females. All MRI measurements except the mean wall thickness and WA/TVA ratio were highly reproducible. There was good correlation for mean wall area between carotids and aorta compatible with the systemic nature of atherosclerosis. Similar to clinical presentation of cardiovascular diseases we found greater values in most MRI parameters (except for WA/TVA ratio) in males than in females and with increasing age.
Conclusions
These data suggest that analysis of most MRI measurements of plaque burden is reproducible and that there is correlation between plaque burden between carotids and aorta validating the systemic distribution of the disease.
Introduction
Atherosclerosis progresses slowly and silently over decades, a prolonged course that provides a window of opportunity for diagnosis before symptoms occur. Until recently, cardiovascular imaging has been able to detect only advanced atherosclerotic disease, but developments in imaging technology offer new prospects for early detection of atherosclerosis, individual risk stratification, assessment of the results of treatment, and enhanced understanding of the biology of atherosclerosis (1).
MRI has evolved into an excellent modality for the noninvasive evaluation of the vessel wall in atherosclerotic cardiovascular disease with the advantage of not exposing the patient to ionizing radiation. MRI has been used to examine various large arteries including the coronary arteries (2), carotids (3, 4), aorta (5) and peripheral arteries (6, 7). The majority of MRI studies of atherosclerosis have been directed at relatively advanced disease. However, most of the reproducibility of MRI has only been assessed in studies with a small number of subjects with advanced rather than intermediate disease (8–11). In early atherosclerosis plaque morphology approaches the spatial resolution of MRI and reproducibility of image analysis becomes an important problem.
The aim of this cross sectional retrospective study was therefore to assess the intra- and inter-observer reproducibility of the manual measurement/analysis of atherosclerotic plaque burden in both the carotid arteries and the thoracic descending aorta. A cohort of 300 subjects, with cardiovascular disease risk factors over a wide range of severity was examined by non invasive MRI. Additional aims of this study were to evaluate the systemic correlation of plaque burden between the aorta and the carotids and the importance of subject age and gender.
Methods
In order to assess the atherosclerotic burden in patients with a broad range of atherosclerotic risk factors a heterogeneous sample of 300 subjects (Table 1) was recruited from clinics in the New York Metropolitan area between January 2003 and December 2006 to undergo a black blood MRI of the carotids and aorta. From a network of area physicians, patients with 2 or more risk factors for atherosclerosis such as diabetes, hypertension, hypercholesterolemia, smoking, obesity or family history were enrolled in the study. Several physicians with patients under their care determined if any their patients had 2 or more risk factors for cardiovascular disease. If it was determined that any of the patients had 2 or more risk factors, the patient was sent to Mount Sinai for an MRI of the carotids and aorta to look for atherosclerosis in these vascular beds. Before the patient arrived for the MRI visit, the patients’ charts were reviewed to ensure that they fit the eligibility criteria of 2 or more risk factors for cardiovascular disease.
Table 1.
Demographics and cardiovascular risk factors
| Number of subjects | Mean ± SD | |
|---|---|---|
| Age (years) | 300 | 53.0 ± 7.4 |
| Male sex (%) | 300 | 57 |
| Ethnicity (%) | 297 | |
| Caucasian | 50.8 | |
| Asian | 3.0 | |
| African-American | 22.9 | |
| Hispanic | 19.9 | |
| Other | 3.4 | |
| Height (m) | 271 | 1.68 ± 0.1 |
| Weight (kg) | 271 | 75 ± 18.6 |
| Body Mass Index (kg/m2) | 269 | 26.9 ± 9.1 |
| Hypertension (%) | 281 | 43.8 |
| Diabetes (%) | 288 | 26.7 |
| Smoking status (%) | 252 | |
| Active | 29.8 | |
| Ex | 26.2 | |
| Never | 44.0 | |
| Family History (%) | 181 | 42.5 |
| History of CAD (%) | 209 | 23.4 |
| History of stroke (%) | 281 | 7.5 |
| Statins use (%) | 259 | 47.9 |
| Total cholesterol (mg/dl) | 211 | 192.0 ± 72.9 |
| LDL cholesterol (mg/dl) | 207 | 113.7 ± 52.7 |
| HDL cholesterol (mg/dl) | 210 | 50.5 ± 16.2 |
| Triglycerides (mg/dl) | 210 | 139.6 ± 107.8 |
CAD: Coronary Artery Disease; LDL, low-density lipoprotein; HDL; high-density lipoprotein. Data are mean ± SD.
These subjects underwent an MRI of the carotids as well as the thoracic aorta to establish a database of MRI images. Informed consent was obtained from all the subjects. The study was approved by the Institutional Review Board of the Mount Sinai School of Medicine.
Prior to the MRI study subjects were asked, to complete a detailed medical history questionnaire. The most recent lipid profile in each subject’s physician’s file was recorded within three months of the MR imaging. All subjects underwent a black blood MRI acquisition of both carotids and the thoracic aorta.
MR imaging system and pulse sequences
All imaging was undertaken at Mount Sinai School of Medicine on a 1.5T whole body MR imaging system (Siemens Sonata, Erlangen, Germany). The system had a maximum gradient amplitude of 40 mT/m and a slew rate of 200 mT/m/ms. The integrated body coil was used for transmission. For the carotid images a custom built 4-channel carotid array was used for signal reception (12) and for the aortic images, a 6 channel cardiac coil in conjunction with the spine array was, used for signal reception.
Carotid Imaging
Twelve to 24 non-overlapping cross sectional slices centred around the carotid bifurcation were obtained using the rapid extended coverage double inversion recovery turbo spin echo black blood (REX) pulse sequence (13). Imaging parameters were as follows: proton density weighted (PDW) non-gated sequence imaging 12 slices simultaneously (slice pack) (TR/TE = 2130/5.6 ms), with a field of view of 12 × 12 cm, bandwidth of 488 Hz/pixel, matrix size of 256 × 256, a turbo factor of 15 and 2 signal averages. The slice thickness for carotid acquisition (non-gated) was 3 mm. The gap between the slices was 0.3 mm. A chemical shift suppression pulse was used to suppress signal from perivascular fat, not affecting the signal from intraplaque lipids. Approximately 40% (5–10 slices) of the images scanned consisted of the common carotid arteries with the rest of the images spanned the carotid bifurcation and the internal carotid arteries. The blocks of 12 images obtained were not contiguous as they were positioned manually. Care was taken to ensure that the slices did not overlap with other slice packs.
Aorta Imaging
Twenty four to 36 transverse images from the top of the aortic arch of the iliac bifurcation were obtained. For the aorta we used a gated proton density weighted (PDW) imaging sequence. The field of view was 20 cm. For the aortic acquisitions (gated), the slice thickness was 5 mm with a slice gap of 0.5 mm. The other imaging parameters were similar for carotid imaging. The total examination lasted 60 to 90 minutes.
The images were obtained in multiple acquisitions (typically this was 3–4 acquisitions for the entire aorta and 2–3 acquisitions for the extracranial carotids). 12–16 slices were acquired per acquisition and the imaging parameters for each of these acquisitions are described above.
MR imaging analysis
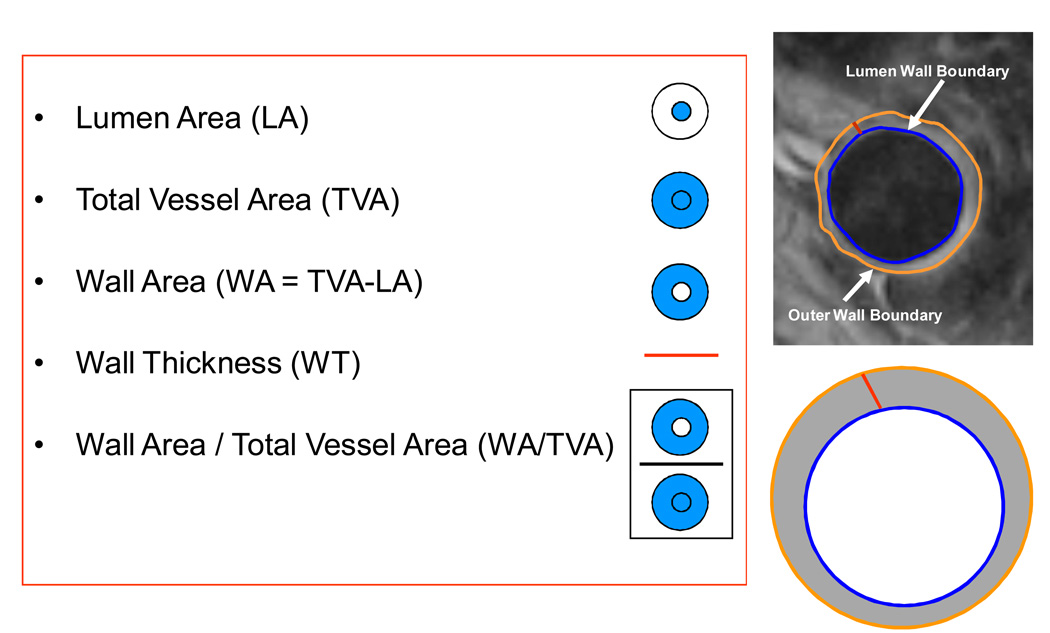
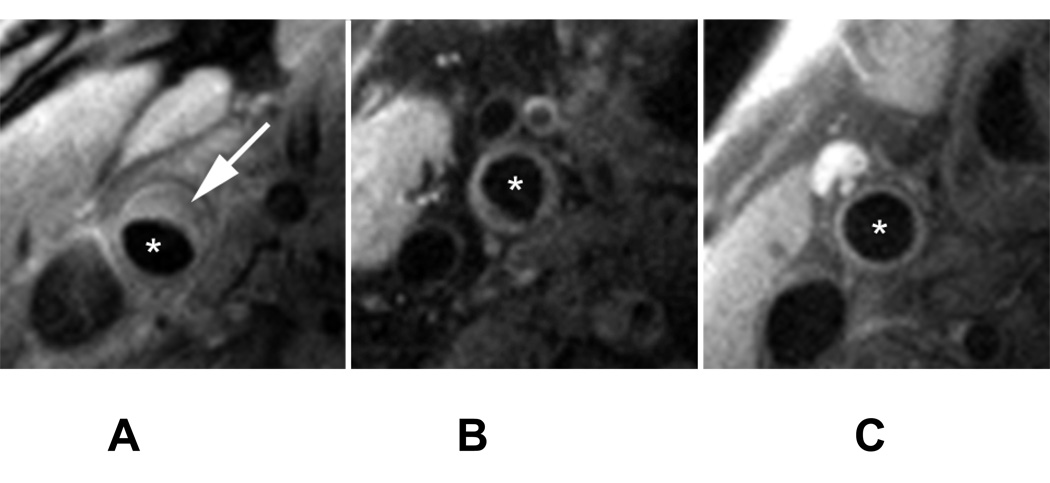
After MR images were acquired, they were transferred to a dedicated MR workstation for analysis. An experienced observer (KBW) scored the image quality. The criteria for selecting good qualtity images were quite stringent. Images were graded subjectively using 4 criteria (overall image quality, vessel wall delineation, flow suppression and artifacts) (14). A 5 point scale ranging from 1 being the worst to 5 being the best was used. If the subjective score for any of the 4 criteria were ≤2, the image was excluded from analysis. The vessel wall boundaries were then manually traced. The outer wall and inner wall were manually traced for both the common carotids and thoracic descending aorta (Figure 1). Mean wall area, mean wall thickness, mean lumen area and mean total vessel area were calculated (semi) automatically (Figure 2). In order to control for the difference in arterial size i.e., larger vessels have a larger areas, we divided the mean wall area by the mean total vessel area (WA / TVA ratio).
Figure 1.
A: Thoracic Descending Aorta. The lumen and outer wall boundary are manually traced. Asterisk indicates the lumen and the arrow points to the plaque. B: Schematic representation of the MRI parameters with their definitions.
Figure 2.
MR Images of the Common Carotid of subjects with atherosclerosis. A: mean wall area: 39 mm2, B: mean wall area: 30 mm2, C: mean wall area: 17 mm2. Arrow points to atherosclerotic plaque and asterisk indicate the lumen. The imaging parameters were as follows: proton density weighted (PDW) non-gated sequence imaging 12 slices simultaneously (TR/TE = 2130/5.6 ms), with a field of view of 12 × 12 cm, bandwidth of 488 Hz/pixel, matrix size of 256 × 256, a turbo factor of 15 and 2 signal averages. A chemical shift suppression pulse was used to suppress signal from perivascular fat, not affecting the signal from intraplaque lipids.
Wall thickness measurements were based on the Centerline method as previously described by van der Geest et al (15). Briefly, local wall thickness measurements were obtained at 100 evenly spaced positions along the circumference of the vessel wall. The standard deviation of the 100 measures of wall thickness provides the SD of the wall thickness measures for that particular slice.
The manual tracing and measurements were made using VesselMass software (Leiden University Medical Center, The Netherlands) (15).
Intra- and inter-observer reproducibility
An experienced observer (KBW) blinded to patient information analyzed all the images of the 300 recruited subjects. For the intra-observer reproducibility the first observer (KBW) traced 20 subjects for a second time. The 20 subjects were chosen at random by using a computer based random number generator generating 20 numbers (arbitrarily determined) between 1 to 300. Each patient was assigned a unique ID between 1–300 and the patient number produced by the computer was used for the intra observer variability estimates. The time frame between the first and second reading for intra-observer reproducibility was 123 ± 4 days. The order of cases was determined in the order in which the computer picked the 20 numbers for the intra-observer analysis. The inter-observer reproducibility was assessed after a period of joint working on an image training set acquired independently from this study. The second observer (HT) analyzed 187 randomly selected subjects using a similar process as described above. Both observers were blinded to subject and clinical information.
Statistical analysis
Each MRI variable was assessed for approximate normality using standard methods based on moments, histograms and normal probability plots (16). Variables were then suitably transformed before analyses, to better approximate normality, as required. The logarithmic transformation was used for wall area and thickness and the reciprocal transformation for lumen and total vessel areas. The WA / TVA ratio did not require transformation. Mean values and associated confidence intervals were back transformed for presentation, as required (16). For example, the exponential transformation was applied to the mean and both the confidence limits when the natural logarithmic transformation had been employed.
Intraclass correlation coefficients (ICC) for both intra- and inter-observer reproducibility for mean values within each subject, for each vessel, were obtained using the method of McGraw and Wong (17). An ICC value of 1 indicates perfect agreement. Bland-Altman plots (16,18) were employed to assess inter- and intra-observer variability.
Correlations between vessels, and mean values (and 95% confidence intervals) by age and sex, of MRI parameters were estimated from linear mixed models (16) on the complete data set (all images on all vessels over all subjects), using a heterogeneous compound symmetry correlation structure and Satterthwaite degrees of freedom. Age and sex comparisons were made using least squares means, subsequently back-transformed where appropriate. For the age analyses the subjects were divided in three groups: age ≤ 50, age between 51 and 60; and age > 60 years old.
Statistical analyses were performed using SPSS version 14.0 (SPSS Inc, Chicago, IL) and SAS version 9 (SAS Institute Inc, Cary, NC). A p value of ≤ 0.05 was considered significant.
Results
In total, 300 subjects were enrolled in the study. The demographics and risk profile are listed in Table 1. The mean age was 53 ± 7.4 (8–86) years, 57% were male, 23.4 % had a history of CAD, 7.5 % had a stroke and 47.9 % of the subjects were on statin therapy.
The data from the internal/external carotids, ascending aorta, aortic arch, and descending abdominal aorta were not analyzed and were included in part of the rejection rate. For the carotids, the 12–24 images that were obtained were centered on the carotid bifurcation. This meant that only approximately 5–10 images constituted images from the common carotid. We had a median acceptance rate of 5 for the carotids indicating between 50 to100% acceptance rates.
Similarly, for the aortic images, out of the 25–30 images obtained for the entire aorta, only approximately 8–10 slices span the thoracic descending aorta region. With a median acceptance rate of 6 for the descending thoracic aorta, this will be approximately 60 to 75% acceptance rate.
After selecting only good quality images in the common carotid and descending thoracic aorta; 1,521 images of the LCC; 1,379 images of the RCC and 1,983 images from the TOA were analyzed. If we assume that 2700 (300 × 9 slices) images were available for the thoracic descending aorta, this reflects a 73.4 % acceptance rate for the images. Similarly, if we assume that 2100 (300 × 7 slices) were available for the carotids, it reflects a 72.4% acceptance rate for LCC and 65.6% acceptance rate for the RCC. The exclusion rates in this study are similar to other studies that use multi-slice dark blood imaging techniques that quantify plaque burden (11, 12, 19).
Intra- and inter-observer reproducibility
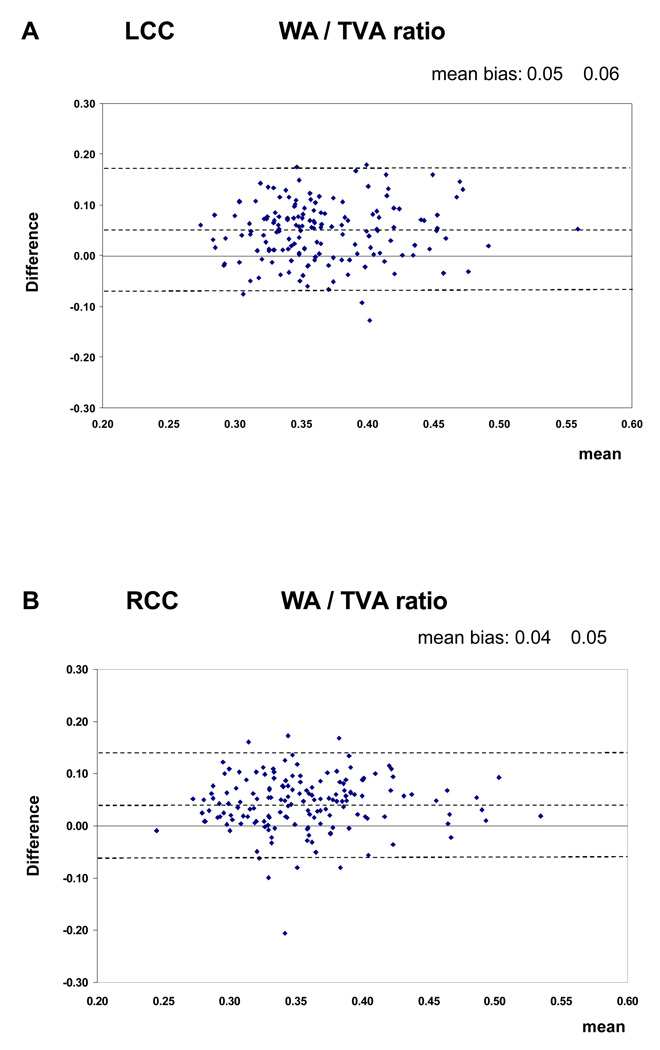
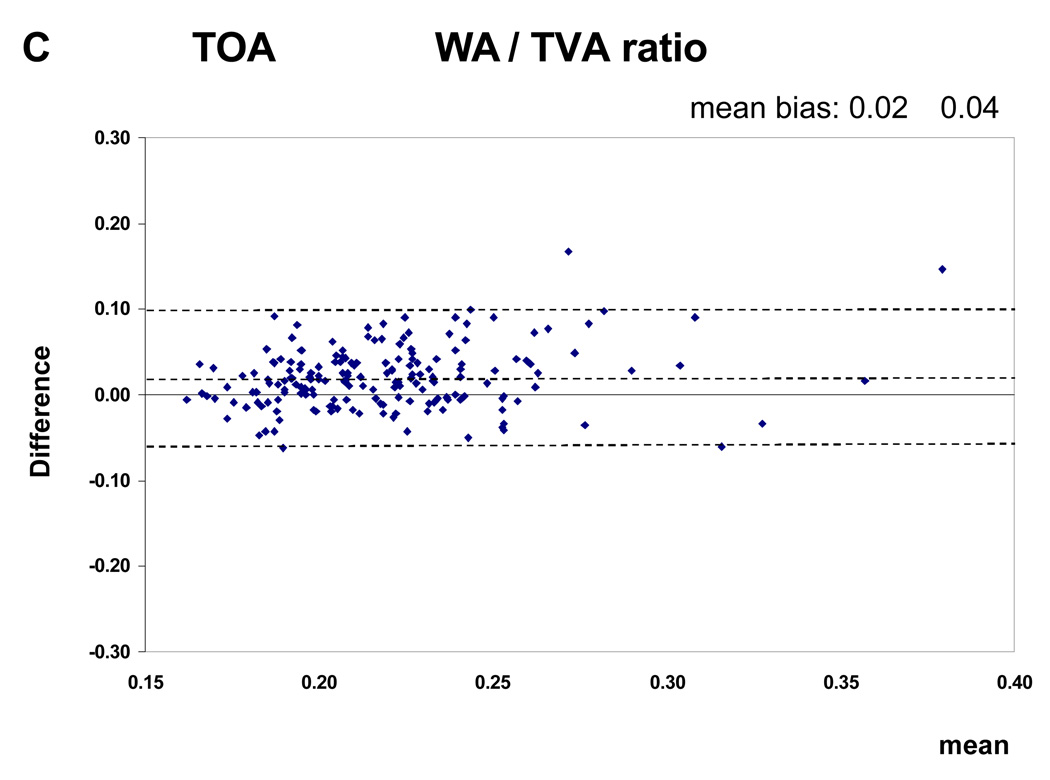
The Intraclass Correlation Coefficients (ICC) with their 95% confidence intervals for the intra-observer and inter-observer reproducibility are shown in Table 2. The ICC values for the intra-observer reproducibility of the analysis of all MRI parameters, except the mean WA / TVA ratio of the TOA, are greater than 0.80. For the inter-observer reproducibility the ICC values of the mean wall area, lumen area and total vessel area are greater than 0.70. The values for the mean WA / TVA ratio and the mean wall thickness are less than 0.70. The intra-observer reproducibility was consistently higher then inter-observer reproducibility. The Bland and Altman plots showed that there was no relation between differences and means (Figure 3)
Table 2.
Reproducibility
| Intra-observer reproducibility n = 20 |
Inter-observer reproducibility n = 187 |
|
|---|---|---|
| Mean wall area | ||
| LCC | 0.93 (0.82–0.97) | 0.72 (0.59–0.80) |
| RCC | 0.94 (0.84–0.98) | 0.78 (0.67–0.85) |
| TOA | 0.93 (0.83–0.97) | 0.86 (0.74–0.92) |
| Mean wall thickness | ||
| LCC | 0.90 (0.75–0.96) | 0.52 (0.24–0.69) |
| RCC | 0.91 (0.76–0.97) | 0.61 (0.33–0.76) |
| TOA | 0.81 (0.59–0.92) | 0.69 (0.47–0.81) |
| Mean lumen area | ||
| LCC | 0.98 (0.94–0.99) | 0.82 (0.15–0.95) |
| RCC | 0.98 (0.95–0.99) | 0.84 (0.16–0.95) |
| TOA | 0.99 (0.99–0.99) | 0.96 (0.94–0.97) |
| Mean total vessel area | ||
| LCC | 0.97 (0.90–0.99) | 0.91 (0.80–0.95) |
| RCC | 0.98 (0.95–0.99) | 0.92 (0.84–0.95) |
| TOA | 0.99 (0.99–0.99) | 0.97 (0.96–0.98) |
| Mean WA / TVA ratio | ||
| LCC | 0.88 (0.72–0.95) | 0.37 (0.02–0.60) |
| RCC | 0.85 (0.63–0.94) | 0.45 (0.07–0.67) |
| TOA | 0.59 (0.20–0.82) | 0.49 (0.26–0.64) |
Intraclass correlation coefficient values, with 95 % confidence intervals in parentheses. n: number of subjects, WA / TVA ratio: mean wall area divided by total vessel area, LCC: Left Common Carotid Artery, RCC: Right Common Carotid Artery, TOA: Thoracic Descending Aorta. Variables analysed on the transformed scale for approximate normality (see text).
Figure 3.
Bland Altman plots (inter-observer reproducibility). This figure shows the mean difference between two measurements against the mean of 2 measurements. The dotted lines represent the value of the mean bias ± 1.96 SDs. The figure shows the plots for the WA / TVA ratio. There was no variation of agreement across the range of values.
Correlation
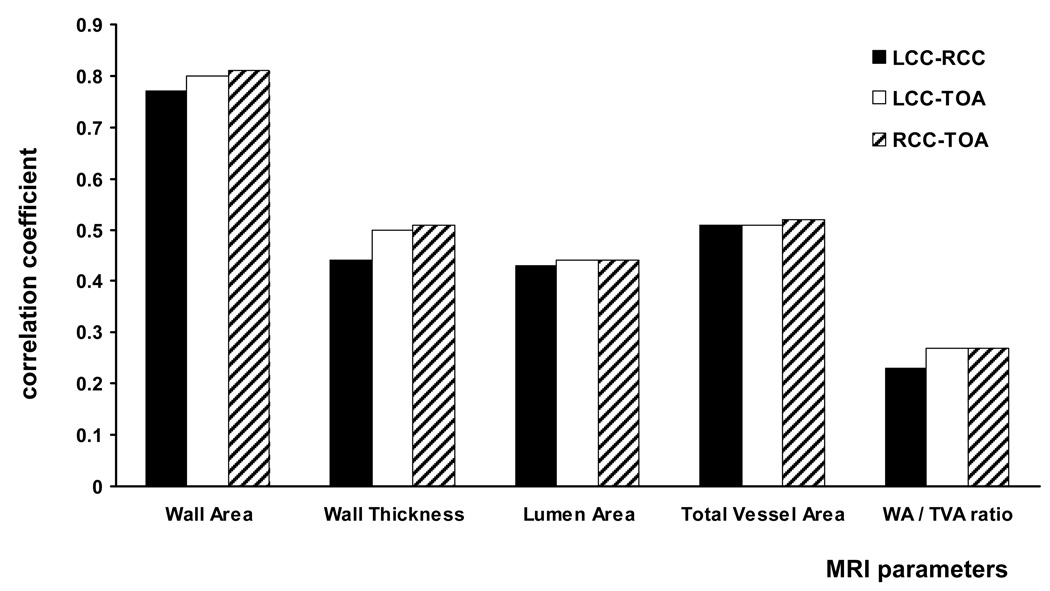
The correlation coefficients for the mean wall area among the three large arteries were between 0.77 and 0.81. The correlations of the other four MRI parameters were poorer, with a correlation coefficient ranging between 0.23 and 0.52. (Figure 4)
Figure 4.
This figure shows the correlation between vessels for the different MRI parameters. The correlation coefficients for the mean wall area were between 0.77 and 0.81 and for the other four MRI parameters between 0.23 and 0.52.
Age and gender
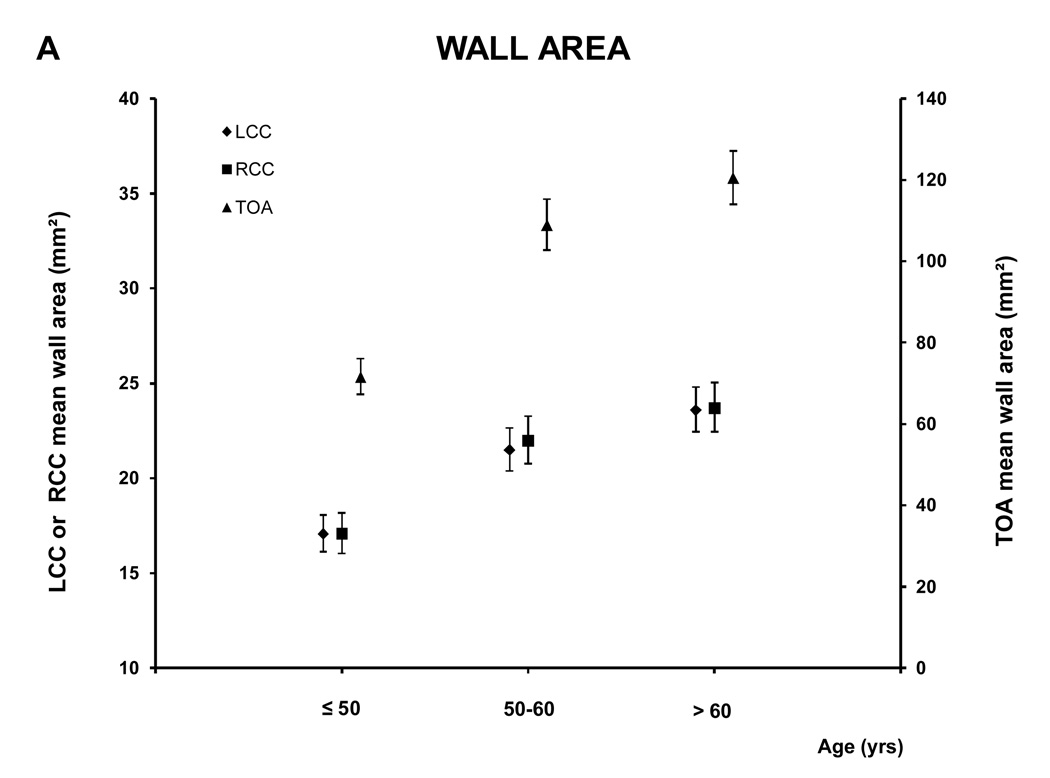
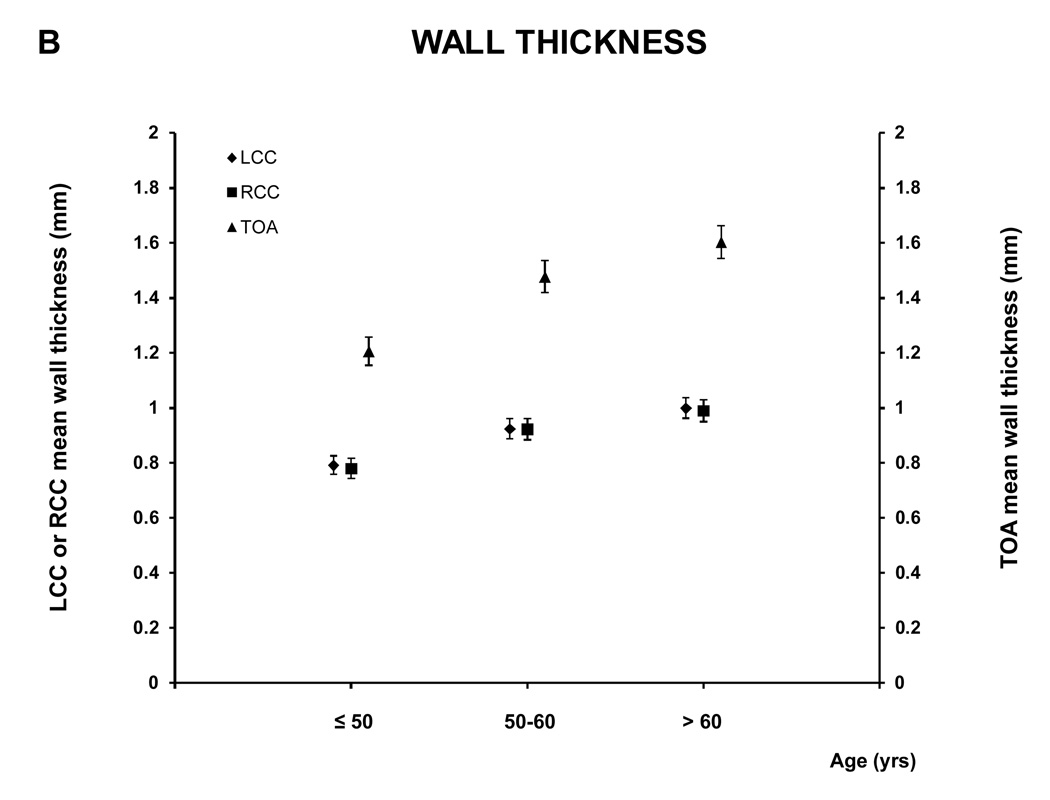
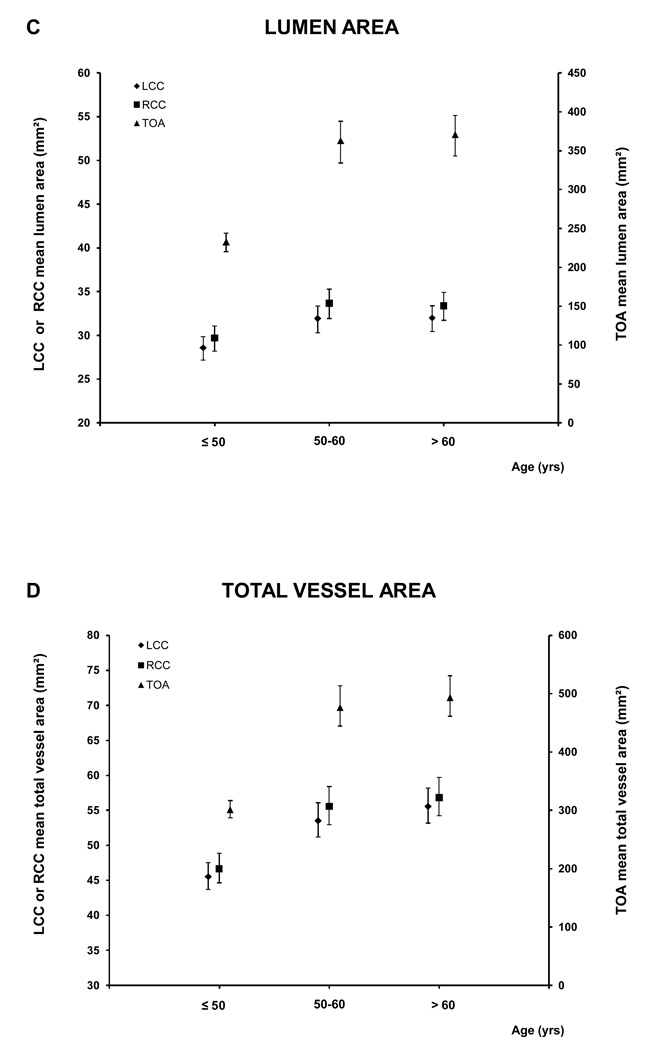
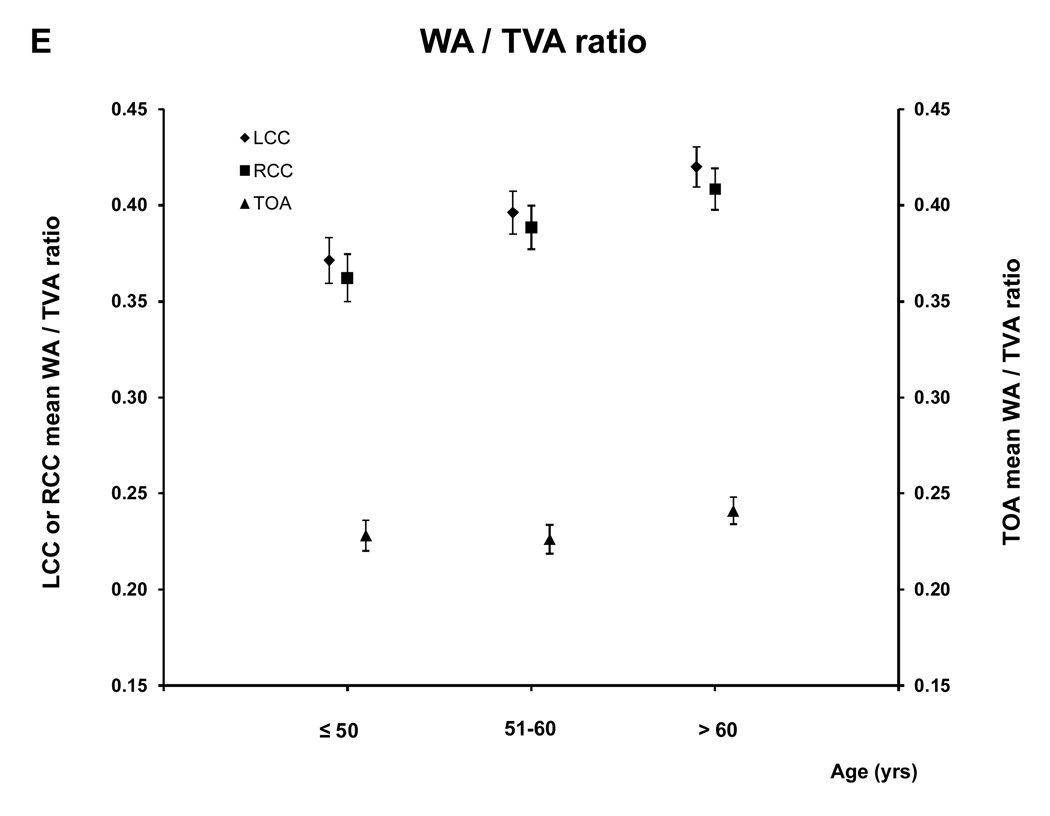
For the age analyses the subjects were divided in three groups: ≤ 50 (88 subjects; 39.1% male), 51–60 (101 subjects; 61.8 % male) and > 60 (111 subjects; 67.6% male) years old. Figure 5 and A.2 show the relationship between age and the MR parameters. All five MRI parameters for the different vessels increased with age.
Figure 5. MRI - Parameters as function of age and vessel.
This figure shows the relation between age and the mean wall area, similar graphs were seen for the other MRI parameters (see A.2). There was a trend to greater values of the different MRI parameters with age for all the vessels (for all the MRI parameters of the three vessels, p<0.0001 except lumen area of LCC and RCC, p= 0.0003 and 0.0005 respectively, and WT /TVA ratio of TOA p=0.02)
A.2.
MRI - Parameters as function of age and vessel
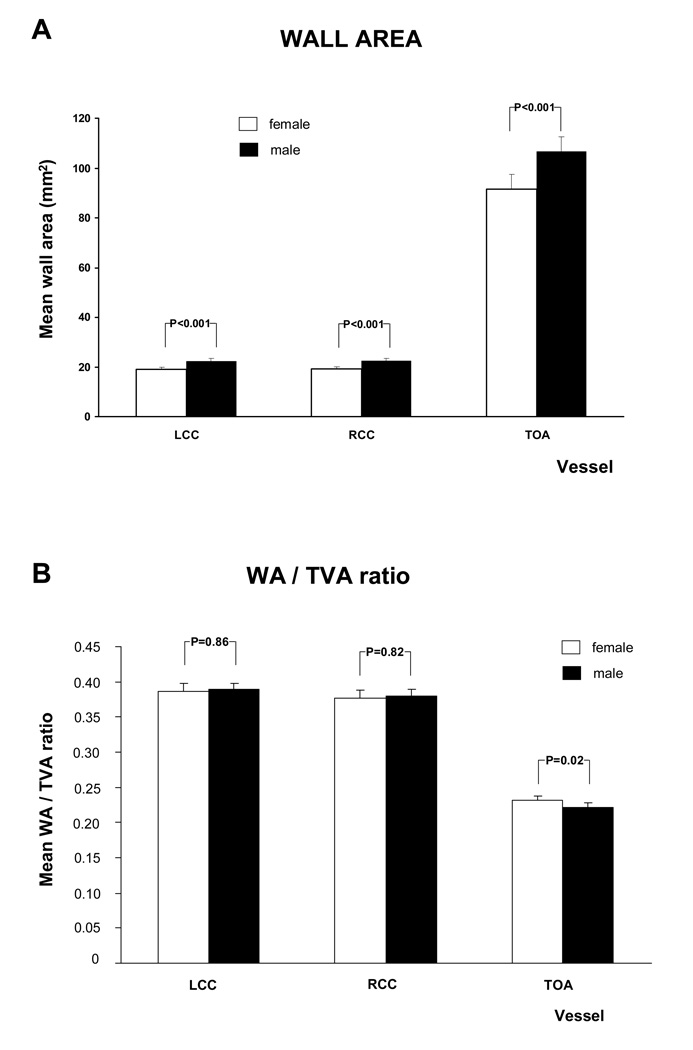
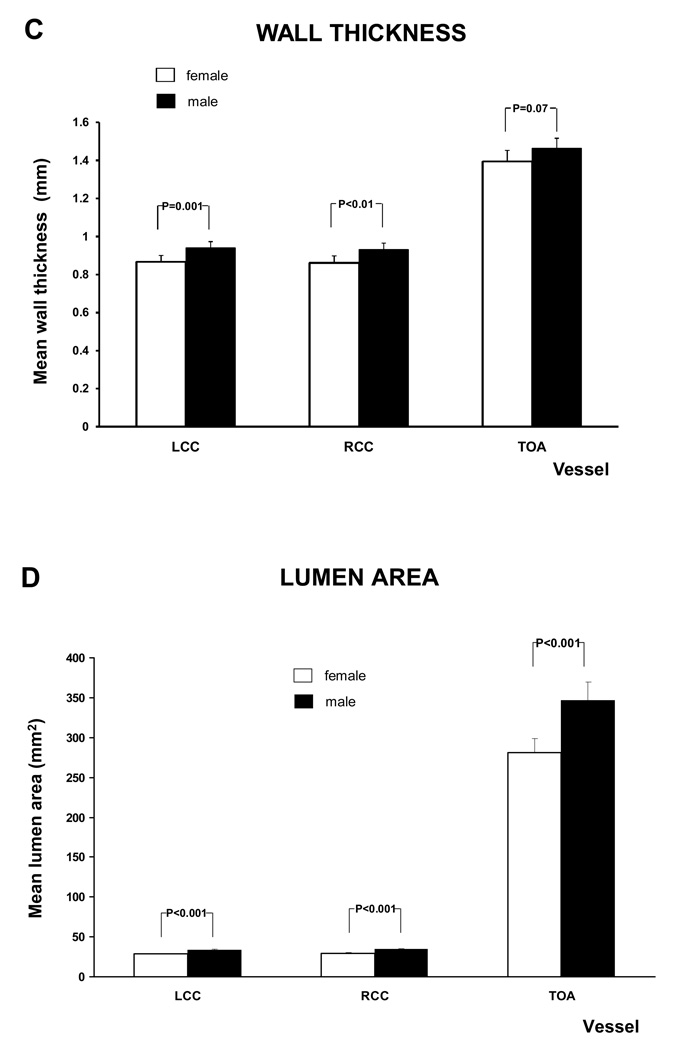
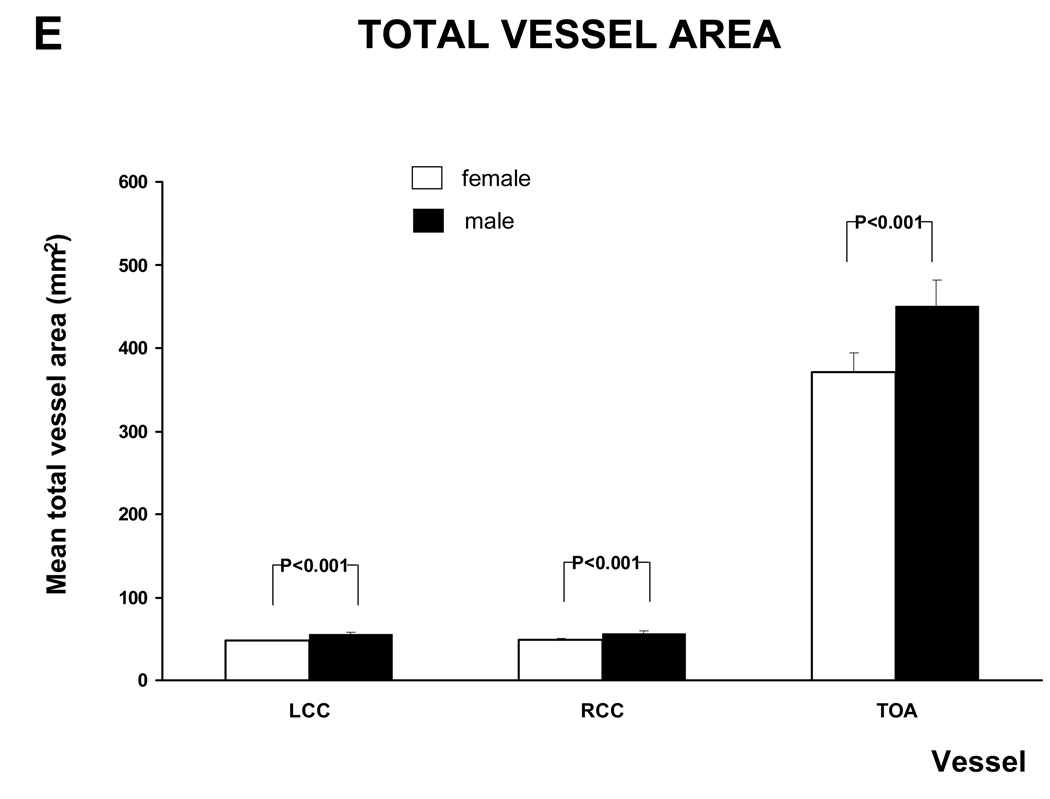
The age adjusted relationship between gender and MRI parameters is shown in figure 6 and A.3. Except for mean wall thickness of the TOA and the WA / TVA ratio of the LCC and RCC all the MRI parameters of the different vessels were significantly higher in males than in females. After adjusting for Body Mass Index (BMI) the WA / TVA ratio shows no gender differences, while the wall area is unchanged.
Figure 6. MRI - Parameters as function of gender and vessel.
This figure shows the relation between gender and mean wall area and WT /TVA ratio, after adjustment for age. Similar graphs were seen for the other MRI parameters (see A.3). There was a trend to greater values in males than in females, except for the WA / TVA ratio.
A.3.
MRI - Parameters as function of gender and vessel
Furthermore, there was no statistical significant difference between males and females for the mean wall area and the mean wall thickness after the age of 60. The same was found for the mean lumen area and the total vessel area of the Left and Right Common Carotid artery.
Discussion
The present study assessed methodology for quantitation of atherosclerosis using MRI in 300 subjects with CVD risk factors. The reliability of MRI as a non invasive method for assessment of the systemic atherosclerotic plaque burden in multiple large arteries i.e. the carotid arteries and aorta were determined.
The intra-observer reproducibility for the analysis of all the MRI parameters of the carotids as well as the thoracic descending aorta, except for the WA / TVA ratio of the TOA, were higher than 0.80. Although the patients in this study were intermediate to high risk subjects, these values were consistent with previous MRI reports (8–11, 20).
For the inter-observer reproducibility for the analysis all the ICC values, except the mean wall thickness and the mean WA / TVA ratio, were greater than 0.70. The inter-observer reproducibility for the analysis of the mean wall thickness of the aorta is lower than in a previous study (ICC 0.98 [CI] 0.970–0986) (21). The moderate reproducibility of the mean wall thickness is likely a result of having to trace both the outer vessel wall and the inner vessel wall boundaries. More complex measurements are likely to increase variability. Contrary to a previous study (11) we found a very poor inter-observer reproducibility for the mean WA / TVA ratio. This difference might be due the complexity of the measurements (i.e. ratio) and the larger distribution of atherosclerotic lesion size. Although cardiac gating was not used for plaque imaging in the carotid arteries we previously showed that there is no significant difference in quantitive morphometric measures between gated and non-gated sequences (19). The overall reproducibility might increase with the improvement of the image quality and imaging analysis tool.
Intravascular ultrasound and B mode ultrasound are modalities that are commonly used for direct plaque imaging of the arteries and enable visualization of plaque composition (22). Reproducibility of intravascular ultrasound measurements for atherosclerosis compares well with our MRI results (23,24). However the invasiveness of intravascular ultrasound limits its prevalent use. The inter-observer reproducibility of the common carotid intima-media thickness measured by B-mode ultrasound in the Rotterdam study was between 0.76 and 0.88 (25). In the ELSA study the intra- and inter-reader reliability were 0.915 and 0.872 respectively (26).
Prospective studies have shown that carotid Intima Media Thickness (IMT) predicts cardiovascular events (27,28). However a recent published review of IMT has shown heterogeneity between studies, suggesting the need for larger population based studies to more accurately relate subclinical atherosclerosis to risk estimation (29).
MRI has several advantages over the other imaging modalities. It is non-invasive, uses no-ionizing radiation and has the ability to acquire high resolution images of multiple large arteries.
To our knowledge, no previous study has described the correlation of the different MRI parameters between the LCC, RCC and the TOA. Of the five MRI parameters the mean wall area showed the best correlation between the large arteries. This is consistent with a study comparing MRI derived wall volumes of the carotids where total wall volume had a higher correlation coefficient than lumen area and total artery volume (30). The correlation of the mean wall area in our study (r= 0.77–0.81) is higher than the correlation reported with IMT, where the correlation between left and right carotid ranged from 0.34 to 0.49 (31). The current study showed a high correlation between the mean wall area of the thoracic descending artery and the carotid arteries consistent with histological studies demonstrating that atherosclerosis is a systemic disease. Other MRI parameters showed a poor correlation between vessels. A possible explanation for this low correlation might include local effects or secondary remodeling which takes place with the development of atherosclerotic lesions.
Males had greater mean wall area, wall thickness, lumen area and total vessel area than females. Mean WA / TVA ratio (mean wall area divided by total vessel area) controls for the gender difference in arterial size. All MRI parameters for the three vessels increased with age. Multiple studies of the carotid and aortic plaque burden, as well as electron beam CT studies of coronary calcification (32) have established age as a powerful predictor of atherosclerotic disease. In this study, mean wall area and the mean wall thickness were no longer significantly different between males and females over the age of 60 years. This is similar to the study by Joakimen et al. where the male predominance of atherosclerotic burden was not seen after the age of 50 (33). A similar trend was seen in a study for aortic plaque burden; in which the atherosclerotic lesions in females over 70 years old exceeded those of males over 70 years old (34).
There are several potential shortcomings in our study. First, there may be selection bias based on case referral. Second, due to our incomplete dataset on risk factors we were unable to perform subgroup analyses. Third, in contrast to some studies we did not use an (semi)automatic imaging analyzing tool for the measurements of the MRI parameters. The mean source for the development of (semi)automated measurement tools are manual traced images. Fourth, as in a previous study we have used a 5-mm slice thickness (34) for the aorta, but others (20) used a 4-mm slice thickness. This greater slice thickness may have increased partial volume effects and could potentially account for part of the variability observed. However, decreasing the slice thickness would result in a loss of signal to noise ratio and contrast. Finally, yet another limitation of the current study is that fact that the reproducibility of the image acquisition was not tested. Since all of the imaged slices were not deemed suitable for analysis, it will be important to assess the reproducibility of the imaging acquisition as well as the analysis. Further studies are needed to assess the reproducibility of the image acquisition techniques.
In conclusion, in this cross-sectional study of 300 subjects we showed that the analysis of all MRI measurements except the mean wall thickness and WA/TVA ratio were highly reproducible for the carotids and the thoracic descending aorta. This study also showed a strong correlation between mean wall area of the carotids and thoracic descending aorta, supporting the systemic nature of atherosclerosis. In accordance with clinical presentation of cardiovascular diseases we found greater values of the MRI parameters in males than in females and increases in average values with age.
Further investigations are required to define the relation between the different MRI parameters and (sub) clinical disease. In addition, longitudinal studies are warranted to determine the ability of MRI parameters to predict cardiovascular events.
A.1.
Median (inter-quartile range) of MRI parameters
| LCC (n=256) | wall area, mm2 | 20.7 (16.8–24.5) |
| wall thickness, mm | 0.91 (0.78−0.10) | |
| lumen area, mm2 | 31.1 (27.0–36.8) | |
| total vessel area, mm2 | 53.2 (44.9–60.8) | |
| WA / TVA ratio | 0.39 (0.36–0.43) | |
| RCC (n=253) | wall area, mm2 | 21.9 (17.0–25.2) |
| wall thickness, mm | 0.91 (0.78−0.10) | |
| lumen area, mm2 | 32.4 (27.9–39.0) | |
| total vessel area, mm2 | 54.3 (45.3–65.0) | |
| WA / TVA ratio | 0.38 (0.35–0.42) | |
| TOA (n=294) | wall area, mm2 | 107.9 (85.0–125.4) |
| wall thickness, mm | 1.47 (1.25–1.64) | |
| lumen area, mm2 | 360.3 (284.7–425.1) | |
| total vessel area, mm2 | 470.1 (376.5–548.9) | |
| WA / TVA ratio | 0.23 (0.21–0.25) |
Acknowledgements
This investigation was partially supported by NIH/NHLBI R01 HL071021 (ZAF). Hamza El Aidi was supported by the Huygens Scholarship Programme of the Dutch Ministry of Education, Culture and Science. Venkatesh Mani is supported by a post doctoral fellowship from the Founders affiliate of the American Heart Association.
We thank the subjects for their participation and Hannah Oltarzewska and Frank Macaluso for technical assistance. We further wish to acknowledge Verheugt, Freek W.A. MD, PhD for his assistance.
Sources of funding: This investigation was partially supported by NIH/NHLBI R01 HL071021 (ZAF). Hamza El Aidi was supported by the Huygens Scholarship Programme of the Dutch Ministry of Education, Culture and Science. Venkatesh Mani is supported by a post doctoral fellowship from the Founders affiliate of the American Heart Association.
Footnotes
No conflicts of interest declared
References
- 1.Sanz J, Fayad ZA. Imaging of atherosclerotic cardiovascular disease. Nature. 2008;451:953–957. doi: 10.1038/nature06803. [DOI] [PubMed] [Google Scholar]
- 2.Fayad ZA, et al. Noninvasive in vivo human coronary artery lumen and wall imaging using black-blood magnetic resonance imaging. Circulation. 2000;102:506–510. doi: 10.1161/01.cir.102.5.506. [DOI] [PubMed] [Google Scholar]
- 3.Corti R, et al. Effects of lipid-lowering by simvastatin on human atherosclerotic lesions: a longitudinal study by high-resolution, noninvasive magnetic resonance imaging. Circulation. 2001;104:249–252. doi: 10.1161/01.cir.104.3.249. [DOI] [PubMed] [Google Scholar]
- 4.Corti R, et al. Lipid lowering by simvastatin induces regression of human atherosclerotic lesions: two years' follow-up by high-resolution noninvasive magnetic resonance imaging. Circulation. 2002;106:2884–2887. doi: 10.1161/01.cir.0000041255.88750.f0. [DOI] [PubMed] [Google Scholar]
- 5.Fayad ZA, et al. In vivo magnetic resonance evaluation of atherosclerotic plaques in the human thoracic aorta: a comparison with transesophageal echocardiography. Circulation. 2000;101:2503–2509. doi: 10.1161/01.cir.101.21.2503. [DOI] [PubMed] [Google Scholar]
- 6.Wyttenbach R, et al. Effects of percutaneous transluminal angioplasty and endovascular brachytherapy on vascular remodeling of human femoropopliteal artery by noninvasive magnetic resonance imaging. Circulation. 2004;110:1156–1161. doi: 10.1161/01.CIR.0000140672.70862.5B. [DOI] [PubMed] [Google Scholar]
- 7.Coulden RA, et al. High resolution magnetic resonance imaging of atherosclerosis and the response to balloon angioplasty. Heart. 2000;83:188–191. doi: 10.1136/heart.83.2.188. [DOI] [PMC free article] [PubMed] [Google Scholar]
- 8.Kang X, et al. Analysis of the measurement precision of arterial lumen and wall areas using high-resolution MRI. J Magn Reson Med. 2000;44:968–972. doi: 10.1002/1522-2594(200012)44:6<968::aid-mrm20>3.0.co;2-i. [DOI] [PubMed] [Google Scholar]
- 9.Desai MY, et al. Reproducibility of 3D free-breathing magnetic resonance coronary vessel wall imaging. Eur Heart J. 2005;26:2320–2324. doi: 10.1093/eurheartj/ehi357. [DOI] [PubMed] [Google Scholar]
- 10.Yuan C, et al. Measurement of atherosclerotic carotid plaque size in vivo using high resolution magnetic resonance imaging. Circulation. 1998;98:2666–2667. doi: 10.1161/01.cir.98.24.2666. [DOI] [PubMed] [Google Scholar]
- 11.Saam T, et al. Predictors of carotid atherosclerotic plaque progression as measured by noninvasive magnetic resonance imaging. Atherosclerosis. 2006;194:e34–e42. doi: 10.1016/j.atherosclerosis.2006.08.016. [DOI] [PMC free article] [PubMed] [Google Scholar]
- 12.Itskovich VV, et al. Parallel and nonparallel simultaneous multislice black-blood double inversion recovery techniques for vessel wall imaging. J Magn Reson Imaging. 2004;19:459–467. doi: 10.1002/jmri.20022. [DOI] [PubMed] [Google Scholar]
- 13.Mani V, et al. Rapid extended coverage simultaneous multisection black-blood vessel wall MR imaging. Radiology. 2004;232:281–288. doi: 10.1148/radiol.2321031022. [DOI] [PubMed] [Google Scholar]
- 14.Hatsukami TS, et al. Visualization of fibrous cap thickness and rupture in human atherosclerotic carotid plaque in vivo with high-resolution magnetic resonance imaging. Circulation. 2000;102:959–964. doi: 10.1161/01.cir.102.9.959. [DOI] [PubMed] [Google Scholar]
- 15.van der Geest RJ, et al. Quantification in cardiac MRI. J Magn Reson Imaging. 1999;10:602–608. doi: 10.1002/(sici)1522-2586(199911)10:5<602::aid-jmri3>3.0.co;2-c. [DOI] [PubMed] [Google Scholar]
- 16.Woodward M. Epidemiology: Study Design and Data Analysis. Second Edition. Boca Raton: Chapman and Hall/CRC Press; 2005. [Google Scholar]
- 17.McGraw KO, Wong SP. Forming inferences about some intraclass correlation coefficients. Psychological Methods. 1996;1:30–46. correction on p. 390 of the same volume. [Google Scholar]
- 18.Bland JM, Altman DG. Statistical methods for assessing agreement between two methods of clinical measurements. Lancet. 1986;1:307–310. [PubMed] [Google Scholar]
- 19.Mani V, et al. Comparison of Gated and Nongated Fast Multislice Black-Blood Carotid Imaging Using Rapid Extended Coverage and Inflow/Outflow Saturation Techniques. J Magn Reson Imaging. 2005;22:628–633. doi: 10.1002/jmri.20428. [DOI] [PubMed] [Google Scholar]
- 20.Touzé E, et al. Reproducibility of high-resolution MRI for the identification and the quantification of carotid atherosclerotic plaque components: consequences for prognosis studies and therapeutic trials. Stroke. 2007;38:1812–1819. doi: 10.1161/STROKEAHA.106.479139. [DOI] [PubMed] [Google Scholar]
- 21.Li AE, et al. Using MRI to assess aortic wall thickness in the multiethnic study of atherosclerosis: distribution by race, sex, and age. AJR Am J Roentgenol. 2004;182:593–597. doi: 10.2214/ajr.182.3.1820593. [DOI] [PubMed] [Google Scholar]
- 22.Nissen SE. Application of intravascular ultrasound to characterize coronary artery disease and assess the progression or regression of atherosclerosis. Am J Cardiol. 2002;89:24B–31B. doi: 10.1016/s0002-9149(02)02217-8. [DOI] [PubMed] [Google Scholar]
- 23.Hagenaars T, et al. Reproducibility of volumetric quantification in intravascular ultrasound images. Ultrasound Med Biol. 2000;26:367–374. doi: 10.1016/s0301-5629(99)00141-6. [DOI] [PubMed] [Google Scholar]
- 24.Touboul PJ, et al. Design, baseline characteristics and carotid intima-media thickness reproducibility in the PARC study. Cerebrovasc Dis. 2005;19:57–63. doi: 10.1159/000081913. [DOI] [PubMed] [Google Scholar]
- 25.Bots ML, et al. Reproducibility of carotid vessel wall thickness measurements. The Rotterdam Study. J Clin Epidemiol. 1994;47:921–930. doi: 10.1016/0895-4356(94)90196-1. [DOI] [PubMed] [Google Scholar]
- 26.Tang R, et al. Baseline reproducibility of B-mode ultrasonic measurement of carotid artery intima-media thickness: the European Lacidipine Study on Atherosclerosis (ELSA) J Hypertens. 2000;18:197–201. doi: 10.1097/00004872-200018020-00010. [DOI] [PubMed] [Google Scholar]
- 27.Chambless LE, et al. Association of coronary heart disease incidence with carotid arterial wall thickness and major risk factors: the Atherosclerosis Risk in Communities (ARIC) Study, 1987–1993. Am J Epidemiol. 1997;146:483–494. doi: 10.1093/oxfordjournals.aje.a009302. [DOI] [PubMed] [Google Scholar]
- 28.O'Leary DH, et al. Carotid-artery intima and media thickness as a risk factor for myocardial infarction and stroke in older adults. Cardiovascular Health Study Collaborative Research Group. N Engl J Med. 1999;340:14–22. doi: 10.1056/NEJM199901073400103. [DOI] [PubMed] [Google Scholar]
- 29.Lorenz MW, et al. Prediction of clinical cardiovascular events with carotid intima-media thickness: a systematic review and meta-analysis. Circulation. 2007;115:459–467. doi: 10.1161/CIRCULATIONAHA.106.628875. [DOI] [PubMed] [Google Scholar]
- 30.Adams GJ, et al. Bilateral symmetry of human carotid artery atherosclerosis. Stroke. 2002;33:2575–2580. doi: 10.1161/01.str.0000035736.30488.7a. [DOI] [PubMed] [Google Scholar]
- 31.Howard G, et al. Relations of intimal-medial thickness among sites within the carotid artery as evaluated by B-mode ultrasound. ARIC Investigators. Atherosclerosis Risk in Communities. Stroke. 1994;25:1581–1587. doi: 10.1161/01.str.25.8.1581. [DOI] [PubMed] [Google Scholar]
- 32.Haberl R, et al. Correlation of coronary calcification and angiographically documented stenoses in patients with suspected coronary artery disease: results of 1,764 patients. J Am Coll Cardiol. 2001;37:451–457. doi: 10.1016/s0735-1097(00)01119-0. [DOI] [PubMed] [Google Scholar]
- 33.Joakimsen O, et al. Age and sex differences in the distribution and ultrasound morphology of carotid atherosclerosis: the Tromso Study. Arterioscler Thromb Vasc Biol. 1999;19:3007–3013. doi: 10.1161/01.atv.19.12.3007. [DOI] [PubMed] [Google Scholar]
- 34.Jaffer FA, et al. Age and sex distribution of subclinical aortic atherosclerosis: a magnetic resonance imaging examination of the Framingham Heart Study. Arterioscler Thromb Vasc Biol. 2002;22:849–854. doi: 10.1161/01.atv.0000012662.29622.00. [DOI] [PubMed] [Google Scholar]


