

Abstract
Motivation: A review of the available single nucleotide polymorphism (SNP) calling procedures for Illumina high-throughput sequencing (HTS) platform data reveals that most rely mainly on base-calling and mapping qualities as sources of error when calling SNPs. Thus, errors not involved in base-calling or alignment, such as those in genomic sample preparation, are not accounted for.
Results: A novel method of consensus and SNP calling, Genotype Model Selection (GeMS), is given which accounts for the errors that occur during the preparation of the genomic sample. Simulations and real data analyses indicate that GeMS has the best performance balance of sensitivity and positive predictive value among the tested SNP callers.
Availability: The GeMS package can be downloaded from https://sites.google.com/a/bioinformatics.ucr.edu/xinping-cui/home/software or http://computationalbioenergy.org/software.html
Contact: xinping.cui@ucr.edu
Supplementary information: Supplementary data are available at Bioinformatics online.
1 INTRODUCTION
Within the last few years, advances in high-throughput sequencing (HTS) technologies have garnered much attention (Metzker, 2009; Snyder et al., 2010). These advances have necessitated more efficient and more accurate data analysis tools. One area of recent interest and development is that of single nucleotide polymorphism (SNP) detection. Scientists have acknowledged and continue to research the significant impact of SNPs in the development of diseases (Chakravarti, 2001) as well as in pharmacogenomics or personalized medicine (Meyer, 2004). Among SNP detection tools, or ‘SNP callers’, that can be used for single-sample Illumina HTS platform data, popular procedures include those from GATK (DePristo et al., 2011; McKenna et al., 2010), FreeBayes (http://bioinformatics.bc.edu/marthlab/FreeBayes), SAMtools (Li et al., 2009a), Atlas-SNP2 (Shen et al., 2010), SNVMix2 (Goya et al., 2010), VarScan (Koboldt et al., 2009), SOAPsnp (Li et al., 2009b) and MAQ (Li et al., 2008).
Upon closer examination, it becomes clear that the aforementioned procedures rely mainly on base-calling and mapping quality values as sources of error. Base-calling and mapping errors can occur when converting raw intensity data into short read sequences and when aligning these short read sequences to a reference genome, respectively. However, they failed to account for genomic sample preparation errors. These errors can occur during the acquisition of the genomic sample, the random fragmentation of the sample and the amplification of the fragments. In particular, unaccounted amplification errors may have a significant negative impact on HTS analyses (Kao et al., 2009).
In contrast to the above SNP callers, here we present Genotype Model Selection (GeMS), our novel SNP detection procedure which accounts for errors in the genomic sample preparation, base-calling and alignment. At a given site, GeMS maximizes the likelihood for each possible genotype with respect to the parameter associated with the genomic sample preparation errors. The GeMS consensus genotype is the one whose likelihood is the largest among all genotype likelihoods. The Dixon outlier test is then used to determine if a SNP should be called at the sites where the consensus genotype differs from the reference genotype.
This article is organized as follows. Section 2 reviews a selection of current SNP callers that can be used for single-sample Illumina HTS platform data. Section 3 describes the GeMS procedure in detail. Section 4 compares GeMS with its competitors through a simulation study and real data analyses. Section 5 gives some concluding remarks.
2 CURRENT HTS SNP CALLERS
The general premise in detecting variants in Illumina platform HTS data is as follows. First, a genomic sample, containing many complete copies of the sample's genome, is obtained from a sample organism. These complete genome copies are then randomly fragmented, attached to a flow cell and amplified. Then the Illumina sequencing-by-synthesis, image analysis and base-calling procedures are used to obtain the short read sequence information and base-calling quality values. These short reads are then aligned to the reference genome of the sample organism and the alignment (mapping) quality values are determined. At each site along the reference genome, a SNP is called if there are a sufficient number of high-quality alleles to indicate a difference between the reference genome and the sample genome.
Many of the available SNP calling procedures use some form of the basic Bayes' theorem,
| (1) |
where P(Ei|D) is the posterior probability of event Ei given the observed data D, the prior probabilities P(Ei) and the conditional probabilities P(D|Ei). The posterior probability is then used to determine if there is a SNP at a given site.
A large difference between the SNP callers, however, is just how the partition of events (the Ei) in Bayes' theorem is structured. The current version of SAMtools/BCFtools (http://www.broadinstitute.org/gsa/wiki/images/1/10/Samtools.pdf) and SNVMix2 partition over the genotype categories homozygous reference, heterozygous reference and non-reference. GATK and SOAPsnp partition over all the possible genotypes (GATK only considers the diploid scenario1 while SOAPsnp considers both haploid and diploid scenarios). FreeBayes is based on GigaBayes (http://bioinformatics.bc.edu/marthlab/GigaBayes) and PolyBayes (Marth et al., 1999) and available documentation indicates that PolyBayes partitions over all the possible true alleles aligned to a particular site. Atlas-SNP2 from the Atlas2 variant analysis suite partitions over the possibilities of a SNP being present or absent. The MAQ model partitions over the three possible genotypes when considering the two most frequently aligned alleles.
As the event partitions of the above SNP callers differ, it is difficult to objectively compare their prior and conditional probabilities. Further, there are also SNP callers that do not employ a Bayesian approach such as the heuristic VarScan method (Koboldt et al., 2009), which essentially reports all variant alleles at each genomic site that meet certain criteria. Despite lacking the ability to objectively compare the theoretical nature of each SNP caller, it can be discerned that none of the aforementioned SNP callers explicitly take genomic sample preparation errors into account. In Section 3, we will show how the GeMS procedure utilizes this information.
3 THE GEMS PROCEDURE
GeMS utilizes genotype likelihood maximization and Dixon's outlier test to detect SNPs. To introduce our new procedure, we begin with a diploid organism and the notation in Table 1.
Table 1.
GeMS model notation
| Notation | Explanation |
|---|---|
| s | site index on a genome |
| ns | number of aligned reads that cover site s |
| i∈{1, 2,…, ns} | index of a specific read covering site s |
| Xi(s) | observed allele on read i at site s |
| Mi(s) | mapping quality of read i covering site s |
| Bi(s) | base-calling quality of the allele on read |
| i at site s | |
| Yi(s) | true allele on read i at site s |
The (s) superscript may be suppressed for convenience.
For every genomic site s, notate the pileup of the aligned allele information as D. GeMS calls argmaxG1G2 P(G1G2|D) to be the sample consensus genotype at site s, where G1G2 represents the 10 possible genotypes given G1, G2∈{A, C, G, T}. Ideally, all the observed alleles aligned to site s, Xi, should be one of the haplotypes given by the true sample genotype. However, this is not true in general because of errors in genomic sample preparation, base-calling and alignment.
Assuming genotype G1 G2, let Yi be defined as the original allele, that is, the allele introduced before base-calling, of read i aligned to site s. Ideally, Yi would be either G1 or G2. However, as mentioned earlier, Yi is subject to the variability which originates from the acquisition, fragmentation and amplification steps of the genomic sample preparation. Therefore, Yi is a latent random variable and, as given by Table 2, is assumed to follow a discreet four point distribution [Categorical(pG1G2)] with parameter p, the small probability that Yi equals an allele different from the haplotypes of the assumed genotype. For example, there is a small probability p that Yi will equal each allele other than A if the assumed genotype is AA. Likewise, there is a small probability p that Yi will equal each allele other than C or T if the true genotype is CT.
Table 2.
The 10 possible pG1G2 for Yi ~ Categorical(pG1G2)
| Model | G1G2 | pAG1G2 | pCG1G2 | pGG1G2 | pTG1G2 |
|---|---|---|---|---|---|
| 1 | AA | 1−3p | p | p | p |
| 2 | CC | p | 1−3p | p | p |
| 3 | GG | p | p | 1−3p | p |
| 4 | TT | p | p | p | 1−3p |
| 5 | AC |  |
 |
p | p |
| 6 | AG |  |
p |  |
p |
| 7 | AT |  |
p | p |  |
| 8 | CG | p |  |
 |
p |
| 9 | CT | p |  |
p |  |
| 10 | GT | p | p |  |
 |
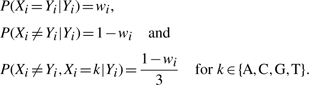
Further, the GeMS model utilizes the Phred-scaled base-calling quality values,2 Bi, and alignment (mapping) quality values, Mi, for each observed allele, Xi, on read i covering site s. The base-calling quality, Bi, is associated with the probability of a base-call being incorrect and the alignment quality, Mi, is associated with the probability of a short read being misaligned. Explicitly, P(Incorrect Base-Call)=10−0.1Bi and P(Incorrect Alignment)=10−0.1Mi.
We then define the accuracy or weight of an aligned allele, wi, in the following way:
| (2) |
Given a correct base-call and alignment, we can assume that Xi=Yi. We therefore propose the following probability distribution for Xi:
 |
(3) |
Figure 1 summarizes the relationship between the p and wi parameters which are assumed to be independent under the GeMS model. For simplicity, the pileup of the aligned allele data, {(X1, M1, B1), (X2, M2, B2),…, (Xns, Mns, Bns)}, is denoted as D. From Equation (3) and assuming that the reads, and thus the Xi, are independent, we have:
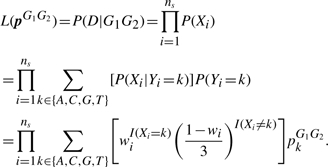 |
(4) |
Since the likelihood depends on each genotype G1G2, for each of the 10 G1G2 models, we can determine  by maximizing the likelihood over p∈(0, 0.25]. The range for p is chosen based on the observation that the p=0.25 case implies that all alleles are equally likely. Furthermore, p > 0.25 indicates the problematic assumption that the alleles from the assumed genotype would less likely be observed than those not from the assumed genotype.
Fig. 1.

The relationship between the p and wi parameters.
By default, the GeMS model implicitly uses non-informative genotype prior probabilities to call the consensus genotype. The user, however, may use informative genotype priors when prior information is available. Given the prior pG1G2, the consensus genotype is based on the posterior probability and is called to be  . Denote the 10 ordered posterior probabilities P(G1G2|D) with the following order statistics P(1)=minG1G2
P(G1G2|D)≤P(2)≤…≤P(9)≤P(10)=maxG1G2P(G1G2|D). To call a SNP at a given site where the consensus genotype differs from the reference genotype, we need to show that P(10) is significantly larger than the other posterior probabilities. In this article, we propose to use Dixon's Q test (Dixon, 1950) which was originally developed for detecting outliers. Since each site would have a sample size of 10 posterior probability values, the appropriate Q test statistic is:
. Denote the 10 ordered posterior probabilities P(G1G2|D) with the following order statistics P(1)=minG1G2
P(G1G2|D)≤P(2)≤…≤P(9)≤P(10)=maxG1G2P(G1G2|D). To call a SNP at a given site where the consensus genotype differs from the reference genotype, we need to show that P(10) is significantly larger than the other posterior probabilities. In this article, we propose to use Dixon's Q test (Dixon, 1950) which was originally developed for detecting outliers. Since each site would have a sample size of 10 posterior probability values, the appropriate Q test statistic is:
| (5) |
This Q statistic essentially examines the ratio of the gap, between the largest estimated posterior probability and the second largest, to the range of estimated posterior probabilities (for a sample size of 10 the more robust range statistic of P(10) − P(2) is used in the computational implementation of Dixon's Q test). One can control how conservative this test is by changing their predefined α level.
For the haploid organism, the general theory discussed above holds except that there are only four possible genotypes, represented by G1, and thus we have only four models to consider for the model selection. See Table 3 for the pG1 associated with each of the four possible genotypes of a haploid organism.
Table 3.
The four possible pG1 for the Yi~Categorical(pG1)
| Model | G1 | pAG1 | pCG1 | pGG1 | pTG1 |
|---|---|---|---|---|---|
| 1 | A | 1−3p | p | p | p |
| 2 | C | p | 1−3p | p | p |
| 3 | G | p | p | 1−3p | p |
| 4 | T | p | p | p | 1−3p |
4 VALIDATION OF THE GEMS PROCEDURE
4.1 Simulation study
To validate the GeMS method, we ran extensive simulations demonstrating that GeMS has the best balance of sensitivity and positive predictive value among other popular competing SNP callers. The simulated short read data was generated based on the reference genome and Illumina Genome Analyzer short read data from the haploid bacterial species Thermoanaerobacter sp. X514 (Supplementary Table S1 displays simulation details). We used the MAQ (Li et al., 2008) simulation tools simutrain and simulate to produce diploid FASTQ format short read data with differing amounts of reads. These read amounts were chosen such that the resulting alignment files would have approximate coverage levels of 5, 10, 20, 50, 100, 200, 500, 1000 and 2000 (the higher simulated coverage levels are representative of current microbial sequencing data). MAQ simutrain ensured that the simulated base-calling qualities were reflective of the real data. MAQ simulate allowed us to control the frequency of single nucleotide variants, which was set at 0.1% (10% of these variants being indels), introduced into the simulated short read data when compared with the reference genome. Though this simulation study cannot completely represent the complexities of real biological processes, we feel that this simulation is sufficient to evaluate the SNP callers in a controlled manner.
After generating the short read data, we aligned the data with the short read aligner BWA (Li and Durbin, 2010). We then compared the results of the following SNP detection procedures3: GeMS, SAMtools mpileup and BCFtools, the SAMtools implementation of the original MAQ model, FreeBayes, the GATK Unified Genotyper, the SAMtools implementation of SOAPsnp, Atlas-SNP2, VarScan and SNVMix2. In both the alignment and SNP calling procedures, we used the default options unless the default options were not applicable. A summary of the options used in the simulation study are recorded in Supplementary Table S1.
The criteria that we used for evaluation are sensitivity (identical to recall) which is the fraction of ‘true called SNPs’ to ‘true SNPs’ and positive predictive value (PPV, identical to precision) which is the fraction of ‘true called SNPs’ to ‘called SNPs’. The results are displayed in Table 4.
Table 4.
SNP caller sensitivity and PPV
| Sensitivity | 5 | 10 | 20 | 50 | 100 |
|---|---|---|---|---|---|
| VarScan | 0.9261 | 0.9613 | 0.9643 | 0.9704 | 0.9749 |
| SNVMix2 | 0.9261 | 0.9613 | 0.9643 | 0.9704 | 0.9749 |
| FreeBayes | 0.9216 | 0.9600 | 0.9621 | 0.9659 | 0.9712 |
| MAQ | 0.8353 | 0.9410 | 0.9630 | 0.9704 | 0.9749 |
| GeMS | 0.8264 | 0.9287 | 0.9607 | 0.9704 | 0.9749 |
| SAMtools | 0.7449 | 0.9045 | 0.9554 | 0.9672 | 0.9726 |
| GATK | 0.7070 | 0.9094 | 0.9594 | 0.9681 | 0.9735 |
| Atlas-SNP2 | 0.6002 | 0.8720 | 0.9585 | 0.9690 | 0.9731 |
| SOAPsnp | 0.8353 | 0.9410 | 0.9630 | 0.9704 | 0.9735 |
| Coverage Avg | 0.8136 | 0.9310 | 0.9612 | 0.9691 | 0.9737 |
| Sensitivity | 200 | 500 | 1000 | 2000 | Caller Avg |
| VarScan | 0.9684 | 0.9751 | 0.9676 | 0.9733 | 0.9646 |
| SNVMix2 | 0.9684 | 0.9751 | 0.9676 | 0.9733 | 0.9646 |
| FreeBayes | 0.9656 | 0.9697 | 0.9626 | 0.9707 | 0.9610 |
| MAQ | 0.9684 | 0.9751 | 0.9676 | 0.9725 | 0.9520 |
| GeMS | 0.9684 | 0.9751 | 0.9676 | 0.9733 | 0.9495 |
| SAMtools | 0.9679 | 0.9728 | 0.9653 | 0.9716 | 0.9358 |
| GATK | 0.9679 | 0.9737 | 0.9676 | 0.9729 | 0.9333 |
| Atlas-SNP2 | 0.9679 | 0.9742 | 0.9676 | 0.9729 | 0.9173 |
| SOAPsnp | 0.6439 | 0.6486 | 0.9604 | 0.9672 | 0.8781 |
| Coverage Avg | 0.9319 | 0.9377 | 0.9660 | 0.9720 | 0.9396 |
| PPV | 5 | 10 | 20 | 50 | 100 |
| SAMtools | 1.0000 | 1.0000 | 1.0000 | 1.0000 | 1.0000 |
| GeMS | 0.9784 | 0.9828 | 0.9958 | 0.9991 | 0.9967 |
| SOAPsnp | 0.9740 | 0.9696 | 0.9682 | 0.9747 | 0.9695 |
| MAQ | 0.9740 | 0.9696 | 0.9673 | 0.9717 | 0.9611 |
| FreeBayes | 0.9637 | 0.9454 | 0.9370 | 0.9611 | 0.9640 |
| GATK | 0.9956 | 0.9899 | 0.9890 | 0.9863 | 0.9731 |
| Atlas-SNP2 | 0.9656 | 0.9580 | 0.9251 | 0.8563 | 0.7471 |
| VarScan | 0.8836 | 0.8327 | 0.7489 | 0.6797 | 0.6374 |
| SNVMix2 | 0.8855 | 0.8362 | 0.7525 | 0.6856 | 0.5737 |
| Coverage Avg | 0.9578 | 0.9427 | 0.9204 | 0.9016 | 0.8692 |
| PPV | 200 | 500 | 1000 | 2000 | Caller Avg |
| SAMtools | 1.0000 | 1.0000 | 1.0000 | 1.0000 | 1.0000 |
| GeMS | 0.9995 | 0.9968 | 0.9981 | 0.9991 | 0.9940 |
| SOAPsnp | 0.9674 | 0.9795 | 0.9912 | 0.9924 | 0.9763 |
| MAQ | 0.9725 | 0.9755 | 0.9777 | 0.9661 | 0.9706 |
| FreeBayes | 0.9665 | 0.9710 | 0.9771 | 0.9763 | 0.9625 |
| GATK | 0.9707 | 0.9467 | 0.8924 | 0.8499 | 0.9548 |
| Atlas-SNP2 | 0.7049 | 0.7134 | 0.7237 | 0.7212 | 0.8128 |
| VarScan | 0.6373 | 0.6667 | 0.6871 | 0.6877 | 0.7179 |
| SNVMix2 | 0.5183 | 0.4599 | 0.3579 | 0.2578 | 0.5919 |
| Coverage Avg | 0.8597 | 0.8566 | 0.8450 | 0.8278 | 0.8868 |
The first row indicates the simulated coverage values. The bottom row gives the column averages at each coverage level. The remaining rows are sorted by the ‘Caller Avg’ column, which gives the average of the rows over all the coverage levels.
Since our evaluation criteria are equivalent to precision and recall, it is natural that we plot our results onto a precision–recall (PR) chart. Similar in functionality to a receiver-operating characteristic (ROC) curve chart, a PR chart has precision on the y-axis and recall on the x-axis (Supplementary Figs 1 and 2 display the simulation results on a PR plot). Thus, the SNP callers with the best performance will have the shortest Euclidean distances to the (1, 1) point of optimal PR classification. These SNP caller performance distances, averaged over the nine coverage levels, are listed in Table 5. Another way to measure the balance of sensitivity and PPV for each SNP caller is to average these two values as seen in Supplementary Table S2.
Table 5.
Average of distance from (sensitivity,PPV) to (1, 1) over all coverage levels, listed in ascending order
| SNP caller | Distance |
|---|---|
| GeMS | 0.0510 |
| FreeBayes | 0.0552 |
| MAQ | 0.0588 |
| SAMtools | 0.0642 |
| GATK | 0.0963 |
| SOAPsnp | 0.1272 |
| Atlas-SNP2 | 0.2406 |
| VarScan | 0.2861 |
| SNVMix2 | 0.4118 |
We first notice, from Table 5 and Supplementary Table S2, that the GeMS procedure has the best performance balance of the tested SNP callers. FreeBayes, as well as SAMtools and the MAQ procedure which it is based on, offer the next best performance levels. However, appealing to Table 4, we see that at every coverage level, SAMtools is less sensitive than GeMS and FreeBayes and MAQ offer less PPV when compared with GeMS.
A large difference between GeMS and SAMtools is that, as noted above in Section 2, SAMtools only considers three consensus genotype models. To directly determine how the 3 model approach of SAMtools compares with the 10 model approach of GeMS, we ran a version of GeMS, which like SAMtools, only considers the genotype categories homozygous reference, heterozygous reference and non-reference. The results of the three model GeMS analysis, contained in the Supplementary Table S3, indicate that given the otherwise unchanged GeMS procedure, considering only these three models reduces the sensitivity at every coverage level when compared to considering the 10 possible genotype models. This finding offers an explanation for the slightly lower sensitivity of SAMtools in comparison with the regular GeMS method.
Finally, it is of interest to examine the simulated variants which were not called by any SNP caller. There are 706 such false negative sites across the 9 simulated datasets. In all, 604 of these sites were not covered by any alleles and thus SNPs could not be called. In all, 94 of the 102 remaining sites were uniformly covered by the reference allele (due to alignment errors) and thus again, SNPs could not be called. Among the eight sites that were not uniformly covered by the reference allele, all were covered with exactly one non-reference allele with a low (< 17) base-calling quality score. Since most of the SNP callers did not even consider the one non-reference allele, it is reasonable that these eight sites would not have been called. Thus, accounting for the imperfect alignment of the simulated short read data, the union of all the SNP caller calls did detect all the simulated SNPs.
4.2 Real data analysis
4.2.1 The Arabidopsis sup1ros1 dataset
In this analysis of real data, we compare the SNP calls of GeMS, SAMtools and GATK on sequencing data from an Arabidopsis sup1ros1 ecotype (http://computationalbioenergy.org/snp.html). SAMtools was chosen because of its competitive performance in the simulation study and GATK was chosen because of its rising popularity. For the region of interest, sites 24 218 085–26 019 264 on chromosome 5, GATK and SAMtools identified 5341 and 4577 putative SNPs, respectively. We set α=0.005 in GeMS to get confident SNP calls for this comparison analysis.
It is known that our dataset was sequenced from a highly homozygous mutation. Among the 10 possible diploid genotypes, GATK's default prior probabilities assign the highest probability to the homozygous reference genotype and lower probabilities to the other homozygous and heterozygous genotypes. For a sufficiently fair comparison, we ran GeMS with the same prior probabilities as GATK (Section 5.2). The resulting Venn diagram of SNP calls using these three methods are shown in Figure 2.
Fig. 2.

Venn diagram of the SNP calls by GeMS, GATK and SAMtools. The GeMS prior probabilities were set to equal those of GATK.
In total, GeMS called 4452 SNPs with 73 as heterozygous SNP calls. All these 73 heterozygous GeMS SNP calls were also called as heterozygous SNPs by GATK but only 63 were called as heterozygous SNPs by SAMtools. In contrast to the low 1.6% of GeMS heterozygous SNP calls, 6.8% of the GATK SNP calls are heterozygous and 2.9% of the SAMtools SNP calls are heterozygous. Further, the percentage of overlapping SNPs between GeMS and GATK, and GeMS and SAMtools are 99.7 and 92.6% of the GeMS SNP calls, respectively. This suggests that most of the GeMS SNP calls are supported by the other two popular methods.
We also consider the 319 sites identified as SNPs by both GeMS and GATK but not by SAMtools. For these sites, other than 10 heterozygous GeMS SNP calls, which are also called as heterozygous SNPs by GATK, the percentage of the most frequently aligned non-reference allele is at least 83.3%. Further, 83.8% (259 out of 309) of them are uniformly covered by only one type of non-reference allele with coverage values spanning from 8 to 50. For the 10 heterozygous SNP calls, the percentage of the most frequently aligned non-reference alleles range from 43% to 75%, indicating non-negligible allele variations. From the short read data, we can determine that most of these sites should have been called as SNPs. We can thus conclude that the SAMtools procedure exhibits relatively low sensitivity in this dataset.
Further details likewise suggest that GeMS exhibits superior sensitivity and PPV in this real data analysis when compared with SAMtools and GATK. First, let us consider the 424 sites identified as SNPs by both GATK and SAMtools but excluded by GeMS. About 87.7% of these 424 sites have coverage levels ≤7. Although 94.9% of them are uniformly covered by only one type of non-reference allele, due to the insufficient information reflected by the low coverage levels, the likelihoods corresponding to variant genotypes are not significantly larger than the other genotype likelihoods. As mentioned previously, we used the same prior probabilities as GATK. Thus, given a prior distribution that assigns high probability to the homozygous reference genotype, the posterior probability of the homozygous non-reference genotypes are smaller than that of the homozygous reference genotype. Therefore, the consensus calls are estimated as homozygous reference genotypes and excluded from the GeMS SNP calls. Here we use the GATK prior distribution for the purposes of fair comparison. As indicated in Section 5.2, such priors can reduce the procedure's sensitivity, especially when the coverage is low. In this case, the use of non-informative prior probabilities is recommended.
Reevaluating these 424 sites (SNP calls by GATK and SAMtools but not GeMS) with the non-informative prior probabilities, 98.9% of the low coverage sites (coverage ≤7) are called as SNPs by GeMS, including all the positions which are uniformly covered by only one type of non-reference allele. For the remaining sites whose coverage is > 7, 98.1% and 92.3% are called as heterozygous SNPs by GATK and SAMtools, respectively. Recalling the highly homozygous nature of our dataset, these SNPs seem suspect.
Second, let us consider the exclusive GATK and SAMtools SNP calls. Among the 477 exclusively identified GATK SNPs, 73.8% have coverage levels ≤7 and 98.4% of the remaining calls are indicated to be heterozygous. With non-informative prior probabilities, GeMS calls 92.3% of the low coverage sites as SNPs.
In the default GeMS settings, sites whose allele pileup is over 5% deletions are flagged as potential deletion polymorphisms and are then excluded from further analysis. Among the 30 sites exclusively identified as SNPs by SAMtools, 13 are excluded by GeMS as potential deletions. Among the remaining 17 sites, 15 have coverage ≤7 and 2 are called as heterozygous by SAMtools.
Third, the 10 sites exclusively identified as SNPs by GeMS and the 2 sites identified as SNPs by both GeMS and SAMtools but not by GATK, show clear SNP characteristics. These 12 sites are uniformly covered by only one type of non-reference allele, with coverage ranging from 9 to 16, thus again demonstrating the superior sensitivity of GeMS. It is noteworthy that the 10 GeMS exclusive SNPs are grouped into two 5 bp multiple nucleotide polymorphisms (MNPs). Either these MNPs were filtered out of the SAMtools and GATK results or MNP calling is not facilitated under the SAMtools and GATK options listed in Supplementary Table S4. Documentation to remedy this situation was not readily available.
As in the simulated data, it is also of interest to vary the coverage levels of this real data. This can be done by randomly and uniformly removing short reads such that the average coverage levels become approximately 20, 10 and 5. In comparison, the average coverage level of the complete dataset is 33. This procedure is reasonable because this data is single-end and because BWA aligns reads independently (Homer and Nelson, 2010).
Sites called as SNPs by all three SNP callers are generally viewed as exhibiting strong SNP characteristics. Likewise, SNP calls made exclusively by just one SNP caller are generally viewed as exhibiting limited SNP characteristics. Since the true SNP locations are not known in this real dataset, we can compare the performance of the SNP callers by considering the proportion of exclusive SNPs to total SNPs (E/T) within each SNP caller. It is also of interest to consider the proportion of the SNP calls in the three-way intersection (of the GeMS, GATK and SAMtools SNP results) to the overall total unique SNP calls of all the three SNP callers (I/OT). These SNP caller E/T proportions and the I/OT proportion are listed for different coverage levels in Table 6. We first notice that GeMS has a significantly lower E/T proportion at every coverage level as compared with GATK and SAMtools. This fact indicates that the GeMS results exhibit better PPV. Also, as demonstrated with the simulated data, we urge readers to exercise caution when using any SNP calling procedure at low coverage levels. This warning becomes clear as we notice the rapid decrease in the I/OT proportion as the coverage level decreases.
Table 6.
SNP call proportions listed at coverage levels 33, 20, 10 and 5 as given in the header row
| 33 | 20 | 10 | 5 | |
|---|---|---|---|---|
| GeMS E/T | 0.0022 | 0.0010 | 0.0000 | 0.0000 |
| GATK E/T | 0.0893 | 0.0799 | 0.0915 | 0.1325 |
| SAMtools E/T | 0.0066 | 0.0145 | 0.0139 | 0.0429 |
| I/OT | 0.7656 | 0.7342 | 0.5230 | 0.1029 |
E/T indicates the proportion of exclusive SNPs to total SNPs within each SNP caller. I/OT indicates the proportion of the SNP calls in the three-way intersection of the SNP caller results to the overall total unique SNP calls of all three SNP callers.
4.2.2 The Thermoanaerobacter sp. X514 Xw2010 dataset
Our other real data analysis considers the haploid bacteria species Thermoanaerobacter sp. X514 which was sequenced in 2008 and again in 2010 (Xw2010 dataset). The 2008 data is assumed to be mostly consistent with the Thermoanaerobacter sp. X514 reference genome. However, given the short life cycle of bacteria, it is assumed that the Xw2010 data (http://computationalbioenergy.org/snp.html), considered below, may exhibit some genomic variants.
We compared the SNP calling results of GeMS and FreeBayes because among the competitive SNP callers used in the simulation study, only FreeBayes offers the option for haploid genome analysis. To reduce inconclusive SNP calls, we first filtered out those GeMS and FreeBayes SNP calls with short read coverage <4. Given α=0.05, GeMS called 45 SNPs. FreeBayes called 31 SNPs, 21 of which were in common with GeMS.
The aforementioned SNP calls generally exhibit only two major alleles, the reference and an alternative. Among the 10 exclusive FreeBayes SNP calls, 2 are characterized by a significant number of deletions. The other eight have reference allele coverage rates of 45–75%. Among the 24 exclusive GeMS SNP calls, one has a reference allele coverage rate of 48% but the 23 others have reference allele coverage rates of 12–44%. Thus, the data indicate that the exclusive GeMS SNP calls are more certain than the FreeBayes exclusive SNP calls. Also, the comparatively large number of strong exclusive GeMS SNP calls demonstrates that GeMS has greater sensitivity than FreeBayes.
4.3 Computational performance
In addition to sensitivity and PPV, processing time and memory usage are also consequential to HTS analysis procedures. We used the simulation study scheme of Section 4.1 to compare these criteria for the nine SNP callers on the nine simulated datasets.
To ensure fair results, we ran each procedure on the same computing setup without any other significant tasks being processed during the testing. The computer specifications were CPU: Intel Xeon E5420 2.50 GHz Quad Core, RAM: 16 GB DDR2 ECC and HDD: NFS 7500 rpm. The criteria that we used for the computational evaluation are the time in seconds to process completion and the maximum memory usage in megabytes (MB). The results are displayed in Supplementary Table S5. In addition, Supplementary Table S6 gives the average memory usage during each process. We note that the VarScan procedure was not able to be completed for coverage levels 500, 1000 and 2000. These data analyses were performed on a computing setup with greater specifications to complete the simulation results.
Regarding time to process completion, GeMS performed considerably faster than SAMtools (the successor to MAQ), FreeBayes and GATK. Though SNVMix2, SOAPsnp and MAQ were faster than GeMS, we recall from Table 5 and Supplementary Table S2 that these SNP callers did not perform as well as GeMS with respect to the balance of sensitivity and PPV criterion.
Among the available data, the maximum memory usage during the simulation study was 3136 MB, which occurred while the Atlas-SNP2 procedure was processing the 2000 coverage dataset. Thus, it is expected that most high-performance computers will be able to handle all the SNP calling procedures as described in Section 4.1.
5 DISCUSSION
5.1 Dixon's Q test
As explained in the above model specification, we call a SNP if the consensus genotype differs from the reference genotype and if the consensus genotype is found to be an outlier by Dixon's Q test. This is appropriate in our setting because, to call a SNP, we would like to be confident that our largest posterior probability, P(10)=maxG1G2P(G1G2|D), is much larger than the other posterior probability values. In other words, we would like to know if P(10) is actually an outlier when compared with P(1), P(2),…, P(9). We use Equation (5) as the appropriate test statistic for the diploid case when the sample size is 10 and the following test statistic for the haploid case when the sample size is 4 [note that the denominator of Equation (6) is setup differently from Equation (5)].
| (6) |
Both test statistics essentially examine the ratio of the gap, between the largest posterior probability to the second largest, to the range of the posterior probabilities. The P-value is then computed [computation algorithm based on the R (http://www.r-project.org/) outliers (http://cran.r-project.org/web/packages/outliers/index.html) package] and a SNP is called if the P−value <α and the consensus genotype differs from the reference genotype.
5.2 Prior probabilities
Intuitively, using prior probabilities that are consistent with the truth will yield more accurate results. Conversely, misleading results can arise from using unrealistic prior probabilities. Most SNP callers assign the largest prior probability to the homozygous reference genotype. For example, given ε=10−3, the priors assigned in the GATK Unified Genotyper (http://www.broadinstitute.org/gsa/wiki/index.php/Unified_genotyper) are,
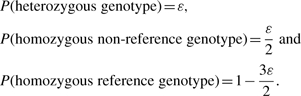 |
(7) |
For the vast majority of sites which do not harbor SNPs, such a prior probability arrangement can help to reduce false positive SNP calls. However, for true SNP sites, such prior probabilities can reduce the SNP caller's sensitivity, especially when the coverage is low. We thus recommend the use of non-informative prior probabilities unless useful additional information is available.
5.3 Calling indels
GeMS does not have indel calling functionality at this time. Among the SNP callers tested in the above simulation study, indel calling procedures are provided by MAQ, VarScan, FreeBayes, SAMtools, GATK and the Atlas2 variant analysis suite. Dindel (Albers et al., 2011), a popular stand-alone indel caller, is also available. Based on our informal testing, Dindel appears to have the best balance of sensitivity and PPV among the aforementioned indel callers and can be combined with GeMS for structural variant detection.
5.4 Future work
The GeMS software package currently supports the SAMtools pileup alignment format (http://samtools.sourceforge.net/pileup.shtml) and will soon support SAM/BAM alignment files (Li et al., 2009a). For more information on pre-filtering undesirable short reads4 from SAM/BAM alignment files before converting to SAMtools pileup alignment files, please see the PDF document ‘Pre-Filtering Alignment Files’(https://sites.google.com/a/bioinformatics.ucr.edu/xinping-cui/home/software/ngs-snp-calling).
Compared with many SNP callers, the main contribution of GeMS is that it considers more variation when making SNP calls. Following this framework, the GeMS model could be extended to the multiple sample case, where there are multiple individuals in a mutation library. The purpose of SNP calling would thus be to discover the frequency that different SNPs occur in different individuals.
Supplementary Material
ACKNOWLEDGEMENTS
The authors are grateful to the three anonymous referees and the associate editor for their helpful and constructive comments, which led to a significant improvement of this article. They also thank the Institute for Integrative Genome Biology for providing the bioinformatics cluster.
Funding: National Science Foundation (DBI0646024 to X.C. and N.Y.); National Institutes of Health (R01GM070795 to J.Z. and S.Z.); National Natural Science Foundation of China (30870572 to X.S., X.Z., J.X. and K.N.).
Conflict of Interest: none declared.
Footnotes
1The current GATK Unified Genotyper website has an image that states that the L(G|D) likelihood is computed for 10 genotypes (http://www.broadinstitute.org/gsa/wiki/index.php/Unified_genotyper). The GATK paper (DePristo et al., 2011) indicates that given a specific alternative allele, the GATK Unified Genotyper partitions over exactly three genotypes: homozygous reference (AA), homozygous alternative (BB) and heterozygous reference-alternative (AB) where the alternative, B, is fixed to one nucleotide.
2Prior to version 1.3, the Solexa pipeline did not utilize the Phred-scaled base-calling quality encoding scheme.
3Though there are more than eight SNP callers currently available for use, the chosen SNP callers provided the most straightforward way to maximize the impartiality of the comparison. Other SNP callers were considered, but those not included in the testing usually were not compatible with all the specifications of the comparison as given in Supplementary Table S1. For example, SNP callers such as QCALL (Le and Durbin, 2011) that were intentionally designed for multiple sample SNP calling were not included in this single sample setup. Additionally, SNP callers such as Slider II (Malhis and Jones, 2010) that were designed to use their own alignment methods were also not included.
None of the data used in this article exhibited the undesirable short read flags as described in this article.
REFERENCES
- Albers C.A., et al. Dindel: accurate indel calls from short-read data. Genome Res. 2011;21:961–973. doi: 10.1101/gr.112326.110. [DOI] [PMC free article] [PubMed] [Google Scholar]
- Chakravarti A. Single nucleotide polymorphisms:… to a future of genetic medicine. Nature. 2001;409:822–823. doi: 10.1038/35057281. [DOI] [PubMed] [Google Scholar]
- DePristo M.A., et al. A framework for variation discovery and genotyping using next-generation DNA sequencing data. Nat. Genet. 2011;43:491–498. doi: 10.1038/ng.806. [DOI] [PMC free article] [PubMed] [Google Scholar]
- Dixon W.J. Analysis of extreme values. Ann. Math. Stat. 1950;21:488–506. [Google Scholar]
- Goya R., et al. SNVMix: predicting single nucleotide variants from next-generation sequencing of tumors. Bioinformatics. 2010;26:730–736. doi: 10.1093/bioinformatics/btq040. [DOI] [PMC free article] [PubMed] [Google Scholar]
- Homer N., Nelson S. Improved variant discovery through local re-alignment of short-read next-generation sequencing data using SRMA. Genome Biol. 2010;11:1–12. doi: 10.1186/gb-2010-11-10-r99. [DOI] [PMC free article] [PubMed] [Google Scholar]
- Kao W.C., et al. BayesCall: a model-based base-calling algorithm for high-throughput short-read sequencing. Genome Res. 2009;19:1884–1895. doi: 10.1101/gr.095299.109. [DOI] [PMC free article] [PubMed] [Google Scholar]
- Koboldt D.C., et al. VarScan: variant detection in massively parallel sequencing of individual and pooled samples. Bioinformatics. 2009;25:2283–2285. doi: 10.1093/bioinformatics/btp373. [DOI] [PMC free article] [PubMed] [Google Scholar]
- Le S.Q., Durbin R. SNP detection and genotyping from low-coverage sequencing data on multiple diploid samples. Genome Res. 2011;21:952–960. doi: 10.1101/gr.113084.110. [DOI] [PMC free article] [PubMed] [Google Scholar]
- Li H., Durbin R. Fast and accurate long-read alignment with Burrows-Wheeler transform. Bioinformatics. 2010;26:589–595. doi: 10.1093/bioinformatics/btp698. [DOI] [PMC free article] [PubMed] [Google Scholar]
- Li H., et al. Mapping short DNA sequencing reads and calling variants using mapping quality scores. Genome Res. 2008;18:1851–1858. doi: 10.1101/gr.078212.108. [DOI] [PMC free article] [PubMed] [Google Scholar]
- Li H., et al. The Sequence Alignment/Map format and SAMtools. Bioinformatics. 2009a;25:2078–2079. doi: 10.1093/bioinformatics/btp352. [DOI] [PMC free article] [PubMed] [Google Scholar]
- Li R., et al. SNP detection for massively parallel whole-genome resequencing. Genome Res. 2009b;19:1124–1132. doi: 10.1101/gr.088013.108. [DOI] [PMC free article] [PubMed] [Google Scholar]
- Malhis N., Jones S.J. High quality SNP calling using Illumina data at shallow coverage. Bioinformatics. 2010;26:1029–1035. doi: 10.1093/bioinformatics/btq092. [DOI] [PubMed] [Google Scholar]
- Marth G.T., et al. A general approach to single-nucleotide polymorphism discovery. Nat. Genet. 1999;23:452–456. doi: 10.1038/70570. [DOI] [PubMed] [Google Scholar]
- McKenna A., et al. The Genome Analysis Toolkit: a MapReduce framework for analyzing next-generation DNA sequencing data. Genome Res. 2010;20:1297–1303. doi: 10.1101/gr.107524.110. [DOI] [PMC free article] [PubMed] [Google Scholar]
- Metzker M.L. Sequencing technologies – the next generation. Nat. Rev. Genet. 2009;11:31–46. doi: 10.1038/nrg2626. [DOI] [PubMed] [Google Scholar]
- Meyer U.A. Pharmacogenetics – five decades of therapeutic lessons from genetic diversity. Nat. Rev. Genet. 2004;5:669–676. doi: 10.1038/nrg1428. [DOI] [PubMed] [Google Scholar]
- Shen Y., et al. A SNP discovery method to assess variant allele probability from next-generation resequencing data. Genome Res. 2010;20:273–280. doi: 10.1101/gr.096388.109. [DOI] [PMC free article] [PubMed] [Google Scholar]
- Snyder M., et al. Personal genome sequencing: current approaches and challenges. Genes Dev. 2010;24:423–431. doi: 10.1101/gad.1864110. [DOI] [PMC free article] [PubMed] [Google Scholar]
Associated Data
This section collects any data citations, data availability statements, or supplementary materials included in this article.