Abstract
We study the adsorption of gold nanospheres onto cylindrical and spherical glass surfaces from quiescent particle suspensions. The surfaces consist of tapers and microspheres fabricated from optical fibers and were coated with a polycation, enabling irreversible nanosphere adsorption. Our results fit well with theory, which predicts that particle adsorption rates depend strongly on surface geometry and can exceed the planar surface deposition rate by over two orders of magnitude when particle diffusion length is large compared to surface curvature. This is particularly important for plasmonic sensors and other devices fabricated by depositing nanoparticles from suspensions onto surfaces with non-trivial geometries.
Sensors and other devices based on plasmon resonances in metal nanoparticles (NPs) have attracted a large amount of attention in recent years.1 In many implementations, particles are deposited from a liquid suspension onto a substrate to form a plasmonically active surface.2 Such substrates are often flat, but other geometries are also of interest. In particular, since plasmonic devices are intrinsically optical, it is natural to consider NP deposition on optical microstructures such as silica fibers, fiber tapers, or microsphere resonators, which display cylindrical, conical, and spherical geometries, respectively. As the complexity of such devices increases, it is imperative to develop a good understanding of the process of NP deposition. Here, we focus on the dependence of deposition on substrate geometry as it applies to silica-based tapers and microspheres. We find that at short deposition times, the NP adsorption is largely independent of substrate geometry, while at long times, deposition is significantly faster onto the curved surfaces. The crossover occurs when the NP diffusion length equals the radius of curvature of the surface.
The problem of particle adsorption on a collecting surface is of great technological importance in fields such as materials science, food and pharmaceutical fabrication, electrophoresis, and catalysis. It is also of interest in biomedicine in describing processes such as ligand binding to macromolecules or digestion by microbes and cells.3, 4 It is then not surprising that the problem has been studied for a long time and that theoretical treatments have reached a high degree of sophistication.5 However, the bulk of the experimental work in this field has been done on planar surfaces, and studies of adsorption onto curved collecting surfaces4, 6 have generally concerned regimes that are not directly applicable to optical and plasmonic device fabrication.
For our theoretical treatment, we confine ourselves to the simplest possible case, where we first assume that the collecting surfaces are perfect sinks, i.e., any particle that gets within a certain small distance from a surface sticks immediately and irreversibly, which is reasonable for small particles at low concentrations7 and at time scales where the fast adhesion kinetics is masked by the slower diffusion dominated particle transport to the surface. Since the Debye length in water is at the most a few tens of nanometers, this holds for all times longer than about a ms. We also assume that the drag experienced by a particle near a surface is balanced by attractive dispersion forces (the Smoluchowski-Levich approximation), so that we can take the diffusion coefficient to be constant everywhere including near the surface. Finally, we treat only the case where there are no external forces and no liquid flow present (quiescent conditions). Under these idealized conditions, the problem reduces to solving the diffusion equation
| (1) |
Here, is the concentration of nanoparticles in the suspension, D is the diffusion constant, is the initial concentration of particles, and are the coordinates of the collecting surface. In all geometries at issue here, this can be solved with standard separation of variables techniques. The accumulation density of particles on the collecting surface is given by , where is the derivative normal to the surface. From this, we obtain8
| (2) |
where the three subscripts for indicates the corresponding adsorbed particle density for planar, spherical, and cylindrical surfaces, respectively, a is the substrate radius of curvature, are Hankel functions of the second kind, and denotes the imaginary part of z. The formula for is well-known and has repeatedly been shown to describe irreversible particle deposition onto flat adhesive surfaces quite well,9 as long as the surface particle density is low enough that the assumption of a perfectly adhesive surface remains valid. To simplify matters, we introduce dimensionless measures of time and particle accumulation , which gives us8
| (3) |
is a constant chosen to obtain the best fit with the exact expression. The errors in the approximations for are less than 2% when and . corresponds to the time when the particle diffusion length equals the diameter of the cylinder or sphere . Therefore, for , the surface appears flat over the scale of the diffusion length, and consequently all surfaces behave as the planar case, where the particle adsorption process gradually depletes the particles from the suspension closest to the surface faster than they can be replaced from regions farther out, which reduces the deposition rate over time, so that .9 When , the finite spherical surface is too small to appreciably deplete the particles from the bulk of the suspension, and the deposition rate is therefore constant, and hence . The cylindrical surface represents an intermediate case where the cylinder does deplete the suspensions of particles so that the deposition rate continually decreases, but only logarithmically in time, so that for very long times . As a result of this, particle deposition occurs significantly faster on curved surfaces than on flat ones, as long as the particle diffusion length is larger than the surface radius of curvature. Since this crossover occurs earlier for smaller radii, the rate of deposition is in fact faster for more highly curved surfaces.
It is also worth mentioning that although the curvature of the surface does affect the interaction between it and the suspended particles, this effect is only appreciable if the curvature becomes comparable to the particle radius.10 Moreover, as particle transport is diffusion limited, this interaction only affects the probability of particle adsorption during a collision with the surface, which under the conditions used here is already nearly 100%.
To test the theory, we deposited gold nanospheres on three types of silica surfaces: the flat surface of microscope slides, the near-cylindrical surface of tapered optical fibers, and microspheres. The tapers were made with a procedure similar to those in Ref. 11. Briefly, we placed a silica fiber between two fiber clamps and used a propane-oxygen flame to heat the fiber. As the glass softens under high temperature, the clamps are pulled apart, and time dependent control of the pulling force enables us to shape the spatial profile of the taper diameter. In this study, the waist of the fiber taper ranged from 5 to 10 μm. The silica microspheres were fabricated by focusing a CO2 laser beam onto an optical fiber, causing it to melt and form a sphere.12 By adjusting the position and the power of the laser, we can control the microsphere diameter in the range of 200 to 300 μm. To make the surfaces adhesive, we coated them with a single nm-thick layer of poly(allylamine hydrochloride) (PAH) to generate a uniform positive surface charge.13 We then placed the samples in an aqueous solution containing negatively charged citrate-terminated, surfactant free gold nanospheres (30 nm diameter, from British Biocell International) to initiate the deposition. We adjusted the NP concentration (n0) as well as the deposition time (t) to achieve different surface particle densities, which were then determined by scanning electron microscopy (SEM) imaging. The NP size d and stock suspension concentration were verified with TEM and inductively coupled plasma atomic emission spectroscopy (ICP-AES) and found to be 28.7 nm and 1.95 × 10¹¹ particles/cm−3, respectively, quite close to the values provided by the manufacturer (30 nm and 2.00 × 10¹¹ particles/cm−3). From d, the temperature of the suspension (22 °C) and the viscosity of water at that temperature (0.96 cP), we calculated the diffusion constant for the NPs D = 1.57 × 10⁻⁷ cm2/s with the Einstein-Stokes equation. To reduce the number of NPs adsorbed onto the surfaces during long depositions to the point where particle surface blocking7 was not a factor, the stock NP suspension was diluted with nanopure water so that ranged between 3.0% and 30% of . The surface density of adsorbed particles was found by imaging several randomly selected regions of each surface with SEM and then using image processing routines built into Mathematica to automatically count the particles in each image. The accuracy of this method was verified by manual counting of the particles in a subset of the images.
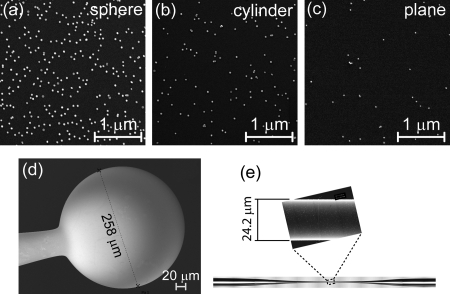
As suggested by Eq. 3, the NP deposition rate can vary by several orders of magnitude, depending on deposition time as well as the spatial dimension of the microstructure. For example, Fig. 1 shows SEM micrographs of NPs adsorbed onto a microsphere, a tapered optical fiber, and a flat glass substrate. In all cases, the surface was exposed to the suspension for 30 min. Note that the highest concentration of NPs was used for the flat surface deposition, yet this case shows the lowest density of adsorbed NPs.
Figure 1.
SEM images of gold nanospheres deposited for 30 min from a diluted suspension onto (a) a spherical surface ( 129 μm, 10% dilution from ), (b) a cylindrical surface ( 5.2 μm, 3% dilution), and (c) a planar surface (30% dilution). The curved surfaces consist of (d) a 258 μm diameter microsphere and (e) a tapered optical fiber, 24.2 μm in diameter at the point where the image was taken.
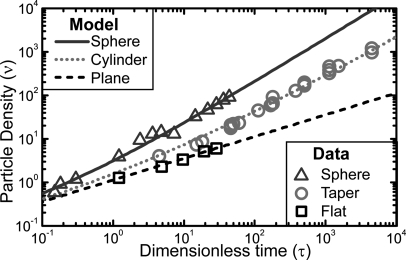
The particle adsorption data were rescaled to enable comparison with Eq. 3. For the flat substrate, a was chosen to be 125 μm. We note that the precise value of a has no impact on the fitting for as can be easily verified from Eq. 3 and the definition for . The result is plotted in Fig. 2, where we can see that the data, obtained with deposition times between 3 min and 6 h, and values of a between 5 μm and 130 μm, follow the scaling of Eq. 3 quite well. The only free parameter in the rescaling was the NP concentration in the nanosphere stock solution , which was chosen to obtain the best least squares fit to theory. The resulting values are displayed in Table TABLE I.. For all three geometries, the inferred value of is quite close to the correct value of 2.0 × 1011 cm−3, confirming the validity of our model.
Figure 2.
Plot comparing the theoretical scaling in Eq. 3 with data obtained from planar, cylindrical, and spherical surfaces. The only fitting parameter was .
TABLE I.
Concentration of gold nanoparticles in stock solution as determined by TEM and ICP-AES as well as adsorption on different surface geometries and fitted to our model.
| Method | TEM + ICP-AES | Flat surface | Microsphere | Cylindrical taper |
|---|---|---|---|---|
| (1011 cm−3) | 1.95 | 1.72 | 2.06 | 1.88 |
The theory assumes quiescent conditions, and we would expect any fluid flow to increase the particle deposition rate onto the surfaces above the predicted values. In the case of the planar and spherical samples, it proved unnecessary to ensure a completely stagnant fluid. The depositions were carried out in standard glassware and simply left undisturbed for the desired amount of time, and despite the residual fluid motion inevitable in a large open container subject to the influence of air flow and ambient mechanical vibrations, agreement with theory is good. By contrast, if we place the cylindrical taper within an open container, we find the particle deposition rate is about 2.5 times larger than predicted by Eq. 2. To reduce the effect of fluid motion, the fiber tapers were enclosed in custom-made cylindrical fixtures with a 3 mm inside diameter, and this produced the result displaced in Table TABLE I., in good agreement with theory. Insensitivity to slow flow is expected for deposition on a plane, since laminar flow in that case takes place parallel to the surface and does not mix fluid strata with different values of n. The reason for the insensitivity in the spherical case is less clear, but the small thickness of the fluid layer depleted of particles around an adsorbing sphere compared to a cylinder is likely an important factor. A more complete investigation of this problem would require numerical simulations14 and will be left as a topic for future work.
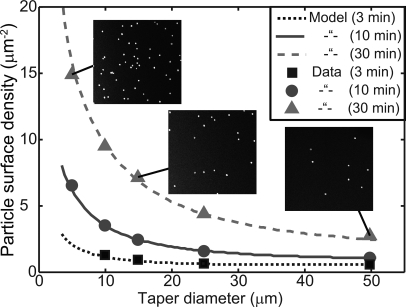
As is evident from Fig. 1e, the radius of each taper varies continuously from a few microns to the radius of the commercial optical fiber. A single deposition will therefore test Eq. 3 over a range of parameters. As can be seen in Fig. 3, the density of adsorbed NPs scales with a just as predicted by the model. For deposition times on the order of 30 min, the density of NPs at the center of the taper can be more than an order of magnitude higher than at the edges.
Figure 3.
Plots of the nanoparticle coverage on three different fiber tapers as a function of the local curvature, and for different deposition times. As in Fig.2, the only fitting parameter was . The strong dependence of particle density on curvature is particularly clear here. The inset SEM images are of 2 μm × 2 μm areas and are taken from the micrographs used to generate the indicated data points.
To conclude, we have derived simple expressions describing adsorption of spherical particles onto adhesive spherical and cylindrical surfaces in the absence of flow and shown that realistic deposition conditions are well described by the theory. Our main finding is that highly curved surfaces accumulate particles significantly faster than their flat counterparts at long deposition times, even though their behavior is identical at short deposition times. For the cases we have studied here, with deposition times on the order of minutes to hours and radii of curvatures down to approximately 10 μm, the difference in surface particle density can be as large as two orders of magnitude. This needs to be taken into account whenever particles or other nanostructures are deposited from suspension onto surfaces that are not flat. The effect can be advantageous both in device fabrication and in sensing applications, where a sensor placed on a highly curved surface will have a faster response than one placed on a flat surface.3
Acknowledgments
This work was supported by the National Institute of Occupational Safety and Health (Grant No. 1U60OH009761-01) and the National Science Foundation (Grant No. CBET-0756693).
References
- Sannomiya T. and Voros J., Trends Biotechnol. 29, 343 (2011); 10.1016/j.tibtech.2011.03.003 [DOI] [PubMed] [Google Scholar]; Zeng S. W., Yong K. T., Roy I., Dinh X. Q., Yu X., and Luan F., Plasmonics 6, 491 (2011); 10.1007/s11468-011-9228-1 [DOI] [Google Scholar]; Sepulveda B., Angelome P. C., Lechuga L. M., and Liz-Marzan L. M., Nano Today 4, 244 (2009). 10.1016/j.nantod.2009.04.001 [DOI] [Google Scholar]
- Mitsui K., Handa Y., and Kajikawa K., Appl. Phys. Lett. 85, 4231 (2004); 10.1063/1.1812583 [DOI] [Google Scholar]; Nath N. and Chilkoti A., Anal. Chem. 74, 504 (2002); 10.1021/ac015657x [DOI] [PubMed] [Google Scholar]; Cheng S. F. and Chau L. K., Anal. Chem. 75, 16 (2003); 10.1021/ac020310v [DOI] [PubMed] [Google Scholar]; Zhao J., Zhang X., Yonzon C. R., Haes A. J., and Van Duyne R. P., Nanomedicine 1, 219 (2006); 10.2217/17435889.1.2.219 [DOI] [PubMed] [Google Scholar]; Nusz G. J., Curry A. C., Marinakos S. M., Wax A., and Chilkoti A., ACS Nano 3, 795 (2009). 10.1021/nn8006465 [DOI] [PMC free article] [PubMed] [Google Scholar]
- Wagner J. K., Setayeshgar S., Sharon L. A., Reilly J. P., and Brun Y. V., Proc. Natl. Acad. Sci. U.S.A. 103, 11772 (2006). 10.1073/pnas.0602047103 [DOI] [PMC free article] [PubMed] [Google Scholar]
- Shoup D. and Szabo A., Biophys. J. 40, 33 (1982). 10.1016/S0006-3495(82)84455-X [DOI] [PMC free article] [PubMed] [Google Scholar]
- Evans J. W., Rev. Mod. Phys. 65, 1281 (1993); 10.1103/RevModPhys.65.1281 [DOI] [Google Scholar]; Talbot J., Tarjus G., Van Tassel P. R., and Viot P., Colloids Surf., A 165, 287 (2000); 10.1016/S0927-7757(99)00409-4 [DOI] [Google Scholar]; Adamczyk Z., Particles at Interfaces: Interactions, Deposition, Structure, Interface Science and Technology Vol. 9 (Academic Press, London, 2006). [Google Scholar]
- Harding S. E., Biophys. Chem. 55, 69 (1995); 10.1016/0301-4622(94)00143-8 [DOI] [PubMed] [Google Scholar]; Gu Y. G. and Li D. Q., J. Colloid Interface Sci. 248, 329 (2002). 10.1006/jcis.2002.8216 [DOI] [PubMed] [Google Scholar]
- Adamczyk Z. and Szyk L., Langmuir 16, 5730 (2000); 10.1021/la991433m [DOI] [Google Scholar]; Adamczyk Z., J. Colloid Interface Sci. 229, 477 (2000). 10.1006/jcis.2000.6993 [DOI] [PubMed] [Google Scholar]
- See supplementary material at http://dx.doi.org/10.1063/1.3701730 for an outline of the derivation of this result.
- Park K., Simmons S. R., and Albrecht R. M., Scanning Microsc. 1, 339 (1987); [PubMed] [Google Scholar]; Grabar K. C., Smith P. C., Musick M. D., Davis J. A., Walter D. G., Jackson M. A., Guthrie A. P., and Natan M. J., J. Am. Chem. Soc. 118, 1148 (1996); 10.1021/ja952233+ [DOI] [Google Scholar]; Adamczyk Z., Jaszczolt K., Siwek B., and Weronski P., J. Chem. Phys. 120, 11155 (2004). 10.1063/1.1712967 [DOI] [PubMed] [Google Scholar]
- Bhattacharjee S., Elimelech M., and Borkovec M., Croat. Chem. Acta 71, 883 (1998). [Google Scholar]
- Ward J. M., O’Shea D. G., Shortt B. J., Morrissey M. J., Deasy K., and Chormaic S. G. N., Rev. Sci. Instrum. 77, 083105 (2006); 10.1063/1.2239033 [DOI] [Google Scholar]; Xue S. C., van Eijkelenborg M. A., Barton G. W., and Hambley P., J. Lightwave Technol. 25, 1169 (2007). 10.1109/JLT.2007.893028 [DOI] [Google Scholar]
- Yang L. and Vahala K. J., Opt. Lett. 28, 592 (2003). 10.1364/OL.28.000592 [DOI] [PubMed] [Google Scholar]
- Decher G., Hong J. D., and Schmitt J., Thin Solid Films 210–211, 831 (1992). 10.1016/0040-6090(92)90417-A [DOI] [Google Scholar]
- Petsi A. J., Kalarakis A. N., and Burganos V. N., Chem. Eng. Sci. 65, 2978 (2010). 10.1016/j.ces.2010.01.028 [DOI] [Google Scholar]


