Abstract
Purpose: In this report, the authors introduce the general concept of the completeness map, as a means to evaluate the completeness of data acquired by a given CT system design (architecture and scan mode). They illustrate the utility of completeness map by applying the completeness map concept to a number of candidate CT system designs, as part of a study to advance the state-of-the-art in cardiac CT.
Methods: In order to optimally reconstruct a point within a volume of interest (VOI), the Radon transform on all possible planes through that point should be measured. The authors quantified the extent to which this ideal condition is satisfied for the entire image volume. They first determined a Radon completeness number for each point in the VOI, as the percentage of possible planes that is actually measured. A completeness map is then defined as a 3D matrix of the completeness numbers for the entire VOI. The authors proposed algorithms to analyze the projection datasets in Radon space and compute the completeness number for a fixed point and apply these algorithms to various architectures and scan modes that they are evaluating. In this report, the authors consider four selected candidate architectures, operating with different scan modes, for a total of five system design alternatives. Each of these alternatives is evaluated using completeness map.
Results: If the detector size and cone angle are large enough to cover the entire cardiac VOI, a single-source circular scan can have ≥99% completeness over the entire VOI. However, only the central z-slice can be exactly reconstructed, which corresponds to 100% completeness. For a typical single-source architecture, if the detector is limited to an axial dimension of 40 mm, a helical scan needs about five rotations to form an exact reconstruction region covering the cardiac VOI, while a triple-source helical scan only requires two rotations, leading to a 2.5x improvement in temporal resolution. If the source and detector of an inverse-geometry (IGCT) system have the same axial extent, and the spacing of source points in the axial and transaxial directions is sufficiently small, the IGCT can also form an exact reconstruction region for the cardiac VOI. If the VOI can be covered by the x-ray beam in any view, a composite-circling scan can generate an exact reconstruction region covering the VOI.
Conclusions: The completeness map evaluation provides useful information for selecting the next-generation cardiac CT system design. The proposed completeness map method provides a practical tool for analyzing complex scanning trajectories, where the theoretical image quality for some complex system designs is impossible to predict, without yet-undeveloped reconstruction algorithms.
Keywords: cardiac CT, CT architectures, Radon transform, completeness map
INTRODUCTION
According to the World Health Organization, an estimated 17.3 million people have died from cardiovascular disease. By 2030, almost 23.6 million people will die from cardiovascular disease.1 Traditionally, x-ray angiography, echocardiography, and nuclear medicine have dominated the area of cardiac imaging, thanks to their flexibility, speed, and ability to provide both anatomical and functional information. Computed tomography (CT) and magnetic resonance (MR) have recently evolved to the point that they can compete with and even outperform the more traditional cardiac imaging modalities. Two major advances are critical to the recent growth in cardiac CT applications: (1) faster rotation speed leading to improved temporal resolution, and (2) multislice/cone-beam geometry,2, 3, 4, 5 which simultaneously enables thin slices and large longitudinal field of view (z-coverage). Most state-of-the-art CT scanners are based on third-generation architecture, typically offering approximately 40 mm of z-coverage, 280–350 ms rotation time, and transaxial limiting spatial resolution of 8 lp/cm (5% modulation transfer function). Reconstruction algorithms are based on filtered backprojection (FBP), with contemporary extensions to deal with cone-beam geometry and cardiac protocols.
Despite these impressive advancements in CT technology, further improvements in image quality and lower radiation dose are sought, and new system architectures and scan modes continue to be investigated. Developments in CT technology tend to be driven by cardiac scanning requirements, due to the high incidence of heart disease, together with the substantial technical demands related to cardiac imaging. For example, electron-beam CT (EBCT) was the first dedicated cardiac CT modality, providing temporal resolution as low as 50 ms. Two recently introduced CT scanners are specifically aimed at cardiac scanning: a dual-source CT scanner6 and a 320-slice CT scanner7 achieve temporal resolution of approximately 100 ms and z-coverage of 160 mm, respectively. Our ultimate goal is to redefine the state-of-the-art of cardiac CT. Our nominal performance specification targets are 160 mm z-coverage, 50 ms temporal resolution, 20 lp/cm isotropic resolution, 10 HU noise level, and 5 mSv effective dose.
In recent years, a number of new technologies have been developed and applied to prototype CT systems, including flat-panel detectors that provide high isotropic spatial resolutions, distributed x-ray sources, field emitters based on carbon nanotubes, photon-counting detectors, fast gantries enabled by high-performance bearings, interior region-of-interest (ROI) reconstruction, etc. We have embarked on a rather comprehensive study of various alternatives for CT architectures that employ many of these emerging technologies, using various scan modes that can be applied to these architectures. Because 50 ms temporal resolution and 160 mm coverage are very aggressive performance goals, all system designs that we have considered to achieve this level of performance come with severe tradeoffs in terms of x-ray tube power limitations, quantum noise, cone-beam artifacts, scatter, complexity, and cost.
Quantitative metrics with respect to the critical characteristics of image quality and radiation dose are required to evaluate the performance of the system designs under consideration. Image quality is affected by many factors, including noise, spatiotemporal resolution, scatter, spectral effects, data completeness, and reconstruction methods. Many of these factors are well studied, and quantitative metrics are widely proposed and applied. In the early conceptual phase of evaluating the many tens of system designs (i.e., combinations of architectures and scan modes) under consideration, it is unrealistic to fully model each design and quantitatively assess each parameter that contributes to the image quality that each system would likely produce. The challenge is further exacerbated by the fact that some of the proposed designs would require reconstruction methods that are yet to be developed. Therefore, we must make some estimates and approximations in order to predict the likely performance of each design under consideration.
In this paper, we examine one aspect of the candidate CT system designs. The data completeness should be an important criterion in the selection process, because it provides a simple indication of the extent to which artifacts might degrade the image quality in the reconstructed CT images. Therefore, we chose to use a completeness map to represent the projection data completeness of each point inside a volume-of-interest (VOI). We applied the completeness map concept to selected examples from our system design study, in order to help identify the relative strengths or weaknesses of these design choices.
This paper is organized as follows. In Sec. 2, we give the mathematical foundation and a detailed description of completeness maps, as well as the algorithm to compute the completeness number for a fixed point. Furthermore, we briefly summarize five categories of representative candidate cardiac architectures. In Sec. 3, we associate scan modes with the candidate CT architectures and give a detailed description of five exemplary system designs (architecture/scan mode combinations). In Sec. 4, we present the completeness map results of five exemplary system designs and discuss some relevant issues. Finally, we draw our conclusion.
MATERIALS AND METHODS
Completeness map theory
Assume that the imaging object is compactly supported by a convex set Ω. A bounded, continuous, and almost everywhere differentiable scanning trajectory Φ is outside of the region Ω, that is, there is no intersection between Φ and Ω. Then, we have a cone-beam data sufficiency condition (known as Tuy’s condition):8 Every plane that intersects the imaging object Ω must cut through the scanning trajectory Φ at least once. From the viewpoint of the Radon transform, a necessary condition to reconstruct a point within an object is to measure all the possible Radon transforms (planar integrals) through this point. However, when the necessary condition is not satisfied, neither of the above two principles gives a quantitative description about the projection data completeness or about how “incomplete” the projection data of a point is. Furthermore, in the cases of some complex CT architectures, it is impossible to perform a comprehensive theoretical analysis of the data completeness.
We now define some basic quantities based on which we will develop a completeness number. When monoenergetic x-rays penetrate a nonhomogeneous material, the attenuation process can be modeled by9
| (1) |
where the line integral is taken along the direction of propagation, is the linear attenuation coefficient at each point on the ray path, is the intensity of the unattenuated radiation flux, and I is the intensity of the transmitted flux after it has traversed the material. A cone-beam CT (CBCT) system usually can be modeled by a divergent beam x-ray transform10
| (2) |
which gives the line-integral of f over the ray with direction emanating from the source point . In Eq. 2, denotes the unit sphere in a three dimensional (3D) real space . Different CT architectures are defined by the combination of different trajectories of the source point and the detector configuration.
In 3D space, the Radon transform is referred to as a parallel plane-integral of an object f. Let and the plane through the origin orthogonal to . The Radon transform of f can be defined by10
| (3) |
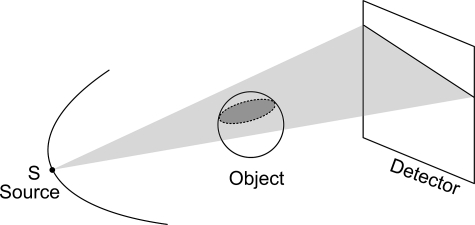
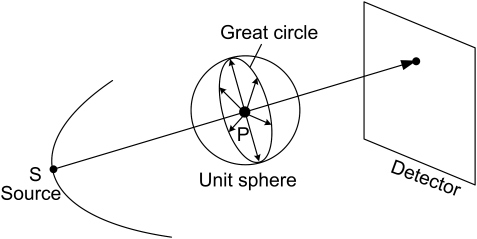
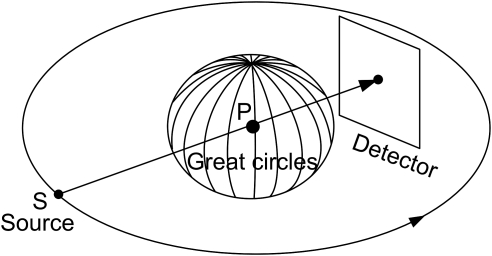
We can see that is the integral of f over the plane orthogonal to with a signed distance t from the origin. As shown in Fig. 1, the cone-beam ray-sums can be converted to plane-integrals by integrating the line-integrals over a plane. The line-integral on the detector plane gives a weighted plane integral of the object with a special nonuniform weighting function 1/d, where d is the distance to the cone-beam focal point.9 As aforementioned, a necessary condition to reconstruct a point within the VOI is to measure the Radon transform on all possible planes through the point. It is well known that the unit normal vectors of those planes form the whole unit sphere in 3D space. Let S be the x-ray source and P a point inside the VOI. When SP is covered by the cone-beam, the x-ray transform along the path SP is measured, all the planes containing SP can be considered available for the point P, and their unit normal vectors form a great circle in the unit sphere (see Fig. 2). Note that we make an important approximation here by ignoring truncated plane integrals. When the x-ray source moves along a scanning trajectory, the great circle will sweep a surface area on the unit sphere. This surface area represents the available set of Radon transform datasets. The percentage of this available surface area relative to the whole unit sphere represents the projection data completeness number/percentages of this point P. The completeness map is defined as a 3D matrix of the completeness numbers in a VOI. For example, as shown in Fig. 3, all great circles sweep the whole unit sphere for the system origin in a circular scanning trajectory. It should be clarified that the proposed completeness map is different from the data completeness condition. The former is pointwise, which is to measure how many the possible Radon transforms (planar integrals) through a point are available. The later is object-oriented, which is to justify if the imaging object can be exactly reconstructed. A 100% completeness number is a necessary condition to reconstruct the corresponding point. However, it is not a sufficient condition. The solution of interior imaging is nonunique even it has 100% completeness numbers at every point because of its truncated projections.
Figure 1.
Integration along a line on the cone-beam detector gives a weighted plane integral of the imaging object.
Figure 2.
A great circle formed by unit normal vectors of all planes containing the x-ray path SP.
Figure 3.
All great circles of the system origin can sweep the whole unit sphere for a circular scanning trajectory.
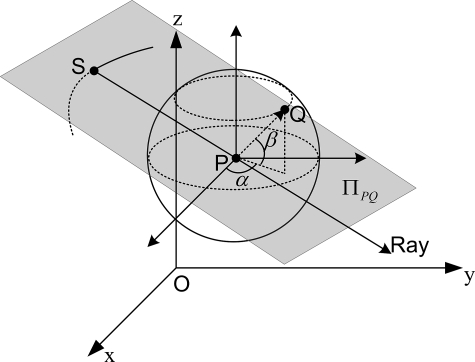
The above process can be used to calculate the completeness map of a VOI. However, it has great redundancy and is very time consuming. To accelerate the computational speed, we can compute the completeness map in an alternative way. As shown in Fig. 4, for a given point Q on the unit sphere, it determines a plane , which contains the point P and is perpendicular to the vector . When the plane has at least one intersection at point S with the x-ray source trajectory and the line SP is covered by the x-ray beam, the Radon data at point Q will be measured. By combining the prior information that the intersections move smoothly on the trajectory, this method can significantly lower the computational cost.
Figure 4.
A point Q on the unit sphere and the associated source position S.
To compute the completeness value of a point P, express the unit Radon sphere in a coordinate , where
| (4) |
Given an angle β, the maximum value of l is , which is the circumference of the circle consisting of all the points with the same angle β.
In summary, for a given x-ray trajectory Γ, the completeness map of a VOI can be calculated by the following pseudocode:
| For each voxel P |
| Discretize the half unit sphere coordinate, and initialize an array; |
| For each |
| For each(the point Q indicated byis chosen) |
| Search an intersection S between the trajectoryΓand; |
| If there exists an intersection S andis covered by cone-beam |
| Set; |
| Set S as the starting searching point for the next point Q; |
| End if |
| End for |
| End for |
| Compute the area indicated by the arrayWand divide it byto obtain the completeness number of the point P; |
| End for |
Because the coordinates and indicate two points on the same great circle, the upper half sphere () is sufficient to compute the completeness number. In the step of searching an intersection point S, the trajectory Γ is discretized, and represents the positions of x-ray sources. We can easily find that if
| (5) |
then line segment has intersection with the plane . When the inequality (5) holds for point and , then intersection point S will be located. Generally speaking, when the point Q moves on the unit sphere smoothly, the intersection S also moves on the trajectory smoothly. Therefore, S is set as the starting searching point for the next Q, and a bidirectional searching method is used in our implementation.
The elements of completeness map are all between 0 and 100%; 100% means the necessary condition is satisfied and no cone-beam artifacts will occur. The cone-beam artifacts will increase with a decreasing completeness number.
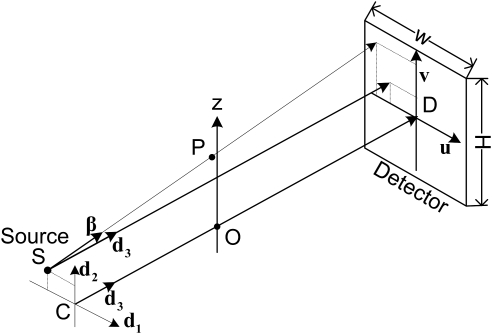
Now let us determine how to judge whether a point is covered by cone-beam or not. As shown in Fig. 5, we assume a planar detector whose height and width are H and W, respectively, D is the center of the detector, a detector position in detector array is denoted by and corresponds to the point D, O is a point on the z-axis and the line OD is perpendicular to the planar detector, the x-ray source S is located in a plane parallel to the detector plane and intersecting the line OD at C. Now, we define a local coordinate system for C by three orthogonal unit vectors (has the same direction as u), (has the same direction as v), and (follows the direction of ). The projection position of cone-beam data along a fixed direction β from C can be denoted by
| (6) |
If the projection of the x-ray source S in coordinates is , the position of cone-beam projection data along a direction β from S can be denoted by
| (7) |
Therefore, we can judge if P is covered by cone-beam dataset by the following rule
| (8) |
Figure 5.
Illustration of a cone-beam x-ray CT coordinate system.
Cardiac CT architecture study
We applied the concept of completeness maps in the context of a cardiac CT system design study. The overall goal of the study is to identify superior cardiac CT system designs. To achieve this goal, we have defined a number of candidate architectures, and we have considered these together with various scan modes, as appropriate for each architecture. The architectures we considered can be categorized as follows: (1) baseline, (2) multiple beam-line, (3) inverse-geometry, (4) stationary/semi-stationary, and (5) composite-circling architectures. For each of the classes, we developed a number of high-level conceptual designs, with the goal to satisfy our nominal performance specification targets: 160 mm z-coverage, 50 ms temporal resolution, 20 lp/cm isotropic resolution, 10 HU noise level, and 5 mSv effective dose. One of the main challenges is to acquire relatively complete data for the VOI while minimizing the complexity of the system. This is where the completeness maps provide a very objective evaluation criterion. In this section, we summarize the five classes of candidate cardiac CT architectures.
Baseline architecture
This is a nominal representation of the typical current commercially available CT architecture, extended to meet the 160 mm z-coverage requirement. This serves as the baseline for our study. Like most commercial CT scanners, this employs third-generation CT geometry. To meet the nominal coverage, this system will require a very large detector, and cone-beam artifacts will be a major challenge. Furthermore, it is difficult to achieve our very demanding goals for temporal and spatial resolutions using this architecture. Therefore, we included this primarily as a reference point for acceptable image quality, in order to benchmark against other alternatives.
Multiple beam-line architectures
This class includes architectures that contain multiple source-detector pairs (“beam lines”), where each beam line illuminates the entire field of view (FOV). An example of such an architecture, dual-source CT, has received major attention in the CT field. A natural extension of the dual-source architecture is a triple-source CT scanner. A primary advantage of the triple source configuration is obviously the further improvement in temporal resolution. In addition, this architecture offers specific advantages in helical cone-beam reconstruction: the triple-source architecture is better than the dual-source architecture, because the triple-source helical scan allows a perfect mosaic of longitudinally truncated cone-beam data to satisfy the Orlov condition and yields better noise performance than the dual-source counterpart.11, 12
Architectures with five conventional source-detector pairs on a rotating gantry are, in principle, also possible, in particular in the “truncated view” configuration. Furthermore, it is possible to construct a system where there are multiple beam lines in the longitudinal direction, as well. These complex designs are not discussed in this report; we will limit our discussion to the triple-source architecture.
Inverse-geometry architectures
An inverse-geometry CT (IGCT) consists of a number of focal spots distributed transaxially, each emitting a relatively narrow x-ray beam through a small portion of the field-of-view.13, 14 After a full 360° rotation of the source and detector configuration, the dataset acquired is equivalent to a full third-generation counterpart. The source topology enables the use of multiple rows of focal spots stacked longitudinally to increase the volumetric coverage, while mitigating cone-beam artifacts. The IGCT architecture could pair nicely with a high-resolution photon-counting detector, potentially combining high spatial resolution, high detection efficiency, and energy-sensitive imaging. Furthermore, in an IGCT scanner, the x-ray flux for each focal spot is modulated to customize the x-ray flux profile for a particular application, optimizing the patient dose versus quantum noise tradeoff. This strategy can, for example, provide more x-rays to a cardiac VOI, fewer x-rays outside the VOI, and optimize dose profiles to sensitive organs. This architecture can potentially greatly reduce cone-beam artifacts but may suffer from limited x-ray flux, due to limitations in contemporary source technology.
Stationary/semistationary CT architectures
Similar to an EBCT scanner, a stationary CT scanner is highly optimized for temporal resolution. A specific concept for cardiac instant/ultrafast CT was introduced very recently.15 The system consists of multiple source-detector pairs, each of which only rotates over a limited angle, resulting in an ultrafast scan and potentially enabling gating-free cardiac imaging. Other realizations of this class include those with both stationary source and detector rings, as well as variations with either a stationary source or detector, while the other component rotates. Interior tomography is particularly desirable for this architecture, and several tens of source-detector pairs are conceivable. Challenges with scattered radiation can be addressed by optimizing the detector-patient air-gap and the number of sources that are fired simultaneously. Due to the multiple, complex, and diverse variations of this architectural class, we have not included any examples of this class in the present report.
Composite-circling scanning architectures
Recently, the saddle-curve cone-beam scanning trajectory was studied for cardiac CT.16, 17 Because the electromechanical needs are very challenging for converting a motor rotation to linear oscillation and handling the inertia of the x-ray source, it is difficult to directly implement the saddle-curve in practice. However, it does represent a very promising solution to the quasishort object problem. In 2007, a composite-circling scan mode and associated cone-beam reconstruction method were invented to solve the quasishort object problem.18 This approach to CBCT may have significant advantages in artifact reduction over existing cardiac CT scanners and in scatter rejection over the standard saddle-curve architecture. Therefore, despite the practical issues, we chose to include this architecture in our completeness evaluation.
Interior imaging using the above architectures
A special case of each architecture can be envisioned, where the FOV is limited to the volume including and immediately surrounding the heart. A simple way to implement interior CT is to collimate the x-ray beam to a reduced FOV, using a collimator similar to those used today. In some cases, the architecture can be substantially simplified in a reduced FOV realization. All cases would require accurately centering the cardiac VOI within the scanner; therefore, a small lateral translation would be required of the patient table.
Conventional CT theory cannot exactly reconstruct an internal ROI only from truncated projections associated with x-rays through the ROI because this interior problem does not have a unique solution.10 In May 2007, it was proven that the interior problem can be exactly and stably solved if a subregion in the ROI is known.19, 20, 21, 22 However, obtaining precise prior knowledge of a subregion in an ROI can be difficult or inconvenient in many clinical/preclinical applications. Based on the compressive sensing (CS) theory, it was proven that a local ROI can be exactly reconstructed via the total variation (TV) minimization if the object under reconstruction is essentially piecewise constant.23 Because the x-ray attenuation coefficient often varies mildly within a beating heart and large image variations are usually confined to the borders, the CS-inspired TV-minimization reconstruction can be directly applied to cardiac imaging.
SIMULATED SCAN MODES
Each cardiac CT architecture may be capable of multiple scan modes. For example, it is well known that the baseline architecture can utilize circular and helical scan modes. Conversely, a given scan mode can be used for different architectures. For this report, we performed the analysis for a specific scan mode, as applied to a specific architecture. In other words, the completeness map depends on the scan mode for a given architecture. For each architecture class listed in Subsection 2, the related possible scan modes are shown in Table TABLE I.. The designs that we analyzed are indicated by a bold checkmark. We define the region of radius r = 80 mm and height 160 mm as the cardiac VOI.
TABLE I.
CT architectures and related scan modes.
| Scan modes | Circular | Helical | Composite circling | |
|---|---|---|---|---|
| Architecture class | Baseline | ✓ | ✓ | |
| Multiple beam-line | ✓ | ✓ | ||
| Inverse geometry | ✓ | ✓ | ||
| Stationary/semistationary | ✓ | ✓ | ||
| Composite-circling | ✓ | ✓ | ✓ |
Circular scan
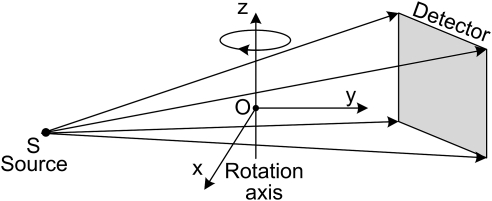
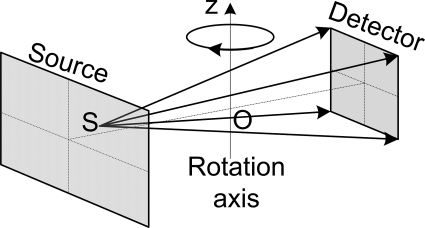
As shown in Fig. 6, a circular cone-beam scan consists of a point x-ray source and a detector plane attached to a rotating gantry. An imaging object is placed between the x-ray source and the detector. In a fixed coordinate system (x, y, z), let us assume that the rotation axis is along the z-axis, whereas the planar detector is parallel to the z-axis. The straight line connecting the x-ray source and the origin O is perpendicular to the planar detector and passes through the detector center. In this case, the scanning trajectory of the x-ray source can be expressed as
| (9) |
where R denotes the radius of the scanning trajectory, and t stands for the rotation angle. Because of the symmetry of the circular scanning trajectory, its completeness map has circular symmetry along the z-axis. Only the central z-slice can be exactly reconstructed, and all the points on a concentric ring in a z-slice have the same completeness number. Therefore, we only need to investigate one plane containing the z-axis, which is referred to as representative-plane in the following text.
Figure 6.
Sketch of the circular cone-beam scan mode. An imaging object is placed between the x-ray source and the detector. In a Cartesian coordinate system (x, y, z), the rotation axis is along the z-axis, whereas the planar detector is parallel to the z-axis. The straight line connecting the x-ray source and the origin O is perpendicular to the planar detector and passes through the detector center.
In this study, we assumed a radius of scanning trajectory R = 570 mm, a source to detector distance of 1140 mm, a planar detector W × H = 323.2 × 405.3 mm, and . Thus, a FOV of radius r = 80 mm was formed. In order to also observe the data completeness of the points outside the VOI, we set the radius and height of the volume we want to observe to 120 mm and 245.3 mm, respectively. If we only want to observe the data completeness of the points in VOI, H can be set to 372.2 mm. The representative-plane was discretized on a grid with size of 512 × 526 (y × z).
Helical scan
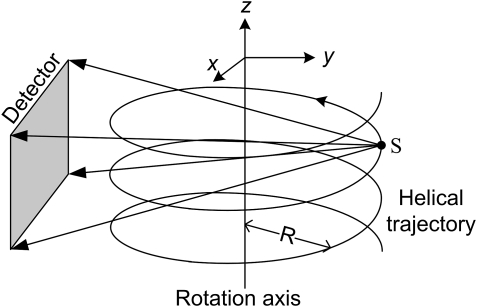
As shown in Fig. 7, a helical cone-beam scan is similar to a circular one except that, when the source-detector rotates around the rotation axis on a gantry, the imaging object is also translated along the rotation axis through the gantry. Therefore, from the perspective of the imaging object, the trajectory of the x-ray source forms a helix, which can be expressed as24
| (10) |
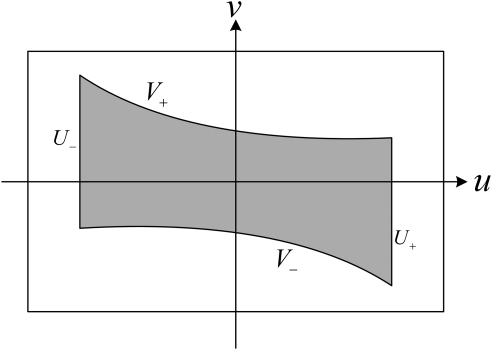
where R denotes the radius of the scanning trajectory, h represent the pitch length, which indicates the translation distance of the imaging object along the z-axis during one full rotation of the source, and t stands for the rotation angle (time). As shown in Fig. 8, the Tam-Danielsson window used in helical cone beam image reconstruction to handle data redundancy is limited by two consecutive helix turns in height and by two vertical lines in width. The projection of the Tam-Danielsson window on the detector plane is confined by the following curves:4
| (11) |
where , , , and are the right, left, upper, and lower boundaries, respectively. u, v are the horizontal and vertical coordinate in the planar detector, D is the distance from the x-ray focal spot to the detector, , and r is the radius of the FOV. Based on Eq. 11, we can obtain the minimum width and height of a planar detector containing the Tam-Danielsson-window:
| (12) |
On the other hand, if H is known we can estimate the maximum permitted pitch h as
| (13) |
According to exact helical reconstruction theory,25 a long imaging object can be exactly reconstructed if there is no horizontal truncation and the helical trajectory is long enough. In this study, we want to find the shortest helical trajectory, which can form a 100% region covering the VOI based on typical helical scanning parameters. The system parameters were similar to the ones used in the above circular cone-beam scan mode except that , H = 40 mm, and h = 36 mm according to Eq. 13. Note that we intentionally reduced the detector size to for this experiment, so that the VOI cannot be imaged in one gantry rotation because we wanted to compare the completeness, in helical mode, of the baseline architecture versus the triple-source architecture. The completeness map in a helical scan does not have the symmetry as in a circular scan, but a representative-plane is helpful for the completeness analysis. A representative-plane was discretized on a grid of 512 × 285 (y × z).
Figure 7.
Sketch of a helical cone-beam scan mode.
Figure 8.
Illustration of a Tam-Danielsson window in a detector plane.
Triple-source helical scan
Of the multiple beam-line class, we chose this architecture, because it offers the simplest way to compare helical mode completeness versus the baseline. For a triple-source helical scan, three x-ray sources are symmetrically positioned along a circle, and the detectors are opposite the corresponding sources. Similar to the single helical scan, when the three source-detector pairs rotate around the rotation axis on a gantry, the imaging object is also translated steadily along the rotation axis through the gantry. Relative to the image object, the trajectories of three sources form three helices as11
| (14) |
where the parameters have the same meaning as in Eq. 10. Similar to the definition of the Tam-Danielsson window, the corresponding minimum detection window for a triple-source helical system, referred to as the Zhao-window, is bounded by the most adjacent turns respectively selected from the other two helices.12 The top and bottom boundaries of the Zhao-window can be parameterized by11
| (15) |
where D is the distance between the detector and the source, s is the angular parameter relative to the corresponding source position, , and are for the top and bottom boundaries, respectively. We also can set the left and right boundaries according to Eq. 11. The minimum width W and height H of a planar detector containing the Zhao-window can be obtained as
| (16) |
When H is known, the permitted maximum pitch length h can be defined as
| (17) |
In this study, the system geometry was similar to the single source helical scan except that , pitch length h = 92.7 mm, and a representative-plane was discretized on a grid of 512 × 450 (y × z).
Inverse geometry scan
As illustrated in Fig. 9, an IGCT system consists of a CT gantry with an array of sources opposite a small detector array.13 In the preferred realization, the source and detector have the same dimension in the longitudinal direction, while the detector can be narrower in the transverse direction. For each view during a circular scan, the sources are energized sequentially, and the entire detector array is read for each source, forming projection images of different fractions of the FOV. The source scanning is rapid compared to the gantry rotation.
Figure 9.
Sketch of an inverse geometry cone-beam CT scan mode.
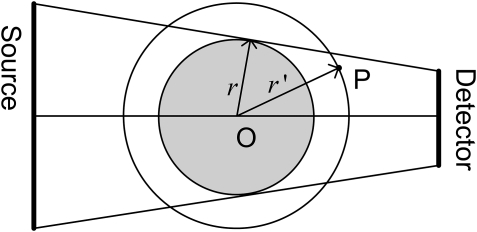
Because the source and detector of the IGCT system have the same axial extent, and assuming the spacing of source points and detectors in this direction is adequately small, the sampling in the slice direction is sufficient.26 As shown in Fig. 10, the rays connecting all source locations and all detectors can be converted into parallel beam rays after rebinning.26 Therefore, the data for the point within the circle with radius r is complete. r is the maximum distance from original point to the line connecting a source location to a detector location. For a point P on a circle with radius , its completeness number equals to . Let represent the completeness number of point P, and then it can be calculated by
| (18) |
Considering the computation efficiency, we use the above formulation to calculate the completeness map of IGCT instead of using the method proposed in Sec. 2.
Figure 10.
Transverse direction of IGCT, which consists of a CT gantry with an array of sources opposite a small detector array.
In our simulations, the source plane to rotation axis distance and detector plane to rotation axis were both 570 mm, the source size is 231.2 × 160 mm, and the detector size is W × H = 50 mm × 160 mm. We set a completeness map volume with a radius and height being 120 and 160 mm, respectively. Then, we can observe the data completeness of the points outside the VOI. A representative-plane was discretized on a grid of 512 × 344 (y × z).
Composite-circling scan
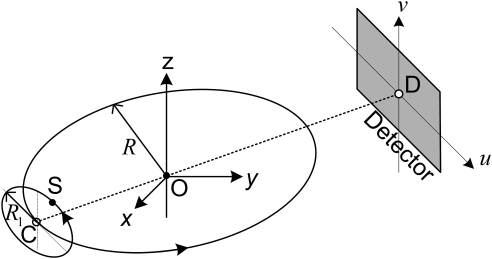
Recently, a composite-circling scan mode was proposed.18 As shown in Fig. 11, a virtual focal-spot C and a planar detector form a typical circular scan mode with radius R. Different from the circular scan mode, when the virtual focal-spot C and planar detector are rotating around z-axis, the real x-ray focal-spot is simultaneously rotating along a circle with radius . The circle is centered at C and in a plane parallel to the planar detector. As a result, the real x-ray focal-spot trajectory can be parameterized as18
| (19) |
where t represents the rotation angle of the focal spot C, m is the rate between the real and the virtual focal spot rotation speeds. Let the point O be the system origin, which is the intersection between z-axis and rotating plane for the virtual focal-spot C. The line OD will be perpendicular to the detector plane and intersects it at a point D.
Figure 11.
Sketch of a composite-circling scan mode. When the virtual focal-spot C and planar detector are rotating around z-axis, the real x-ray focal-spot is simultaneously rotating along a circle with a radius of R1. The circle is centered at C and in a plane parallel to the planar detector.
In our simulations, we set R = 570 mm, OD = 570 mm, R1 = 100 mm, m = 2, . For simplification of the simulation, we assume that a detector is fixed on the gantry, which results in a larger detector size of 536.3 × 637.6 mm to guarantee the VOI to be covered by the x-ray beam in any view and a VOI of radius r = 80 mm. To observe the data completeness of the points outside of the VOI, we set a completeness map volume with a radius and height of 120 and 240 mm, respectively. A representative-plane was discretized on a grid of 512 × 512 (y × z).
RESULTS AND DISCUSSIONS
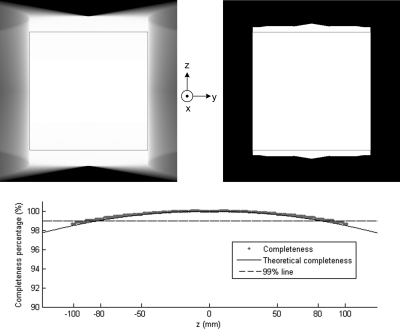
The results for the circular scan are shown in Fig. 12. To verify the correctness of our algorithm, we deduced a theoretical formula for the completeness number of the points along the z-axis, which can be expressed by
| (20) |
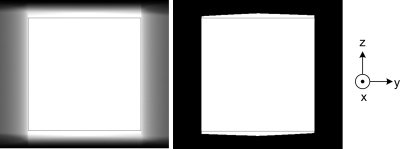
where . The profiles of the theoretical and numerical results are compared in Fig. 12, from which we can see that the results from our algorithm have an excellent match with the theoretical ones. The completeness numbers of the points at both ends equal to zero because of these points were never scanned. If the detector size and cone angle are large enough, the circular scan with can have a ≥99% completeness map over the whole VOI. However, only the central z-slice can be exactly reconstructed in theory, which corresponds to 100% completeness.
Figure 12.
Completeness map of a circular cone-beam scan mode with planar detector W × H = 323.2 × 405.3 mm. Top left: in a display window [0, 1]; top right: in a display window [0, 1] but set the values smaller than 99% to 0; bottom: profiles along z-axis. The square boxes indicate the VOI, which is totally covered by the region with ≥99% completeness number.
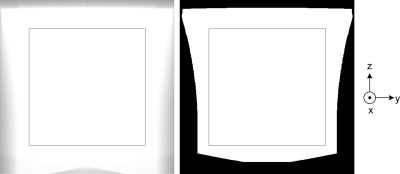
The results for the helical scan are shown in the left image of Fig. 13, where the square box indicates the cardiac region with height 160 mm and width 160 mm. The maximum height of the cylinder that can be 100% covered is about 86.9 mm. Verified by Fig. 13, Eq. 13 guarantees the projection data of the object covered by the middle part of helical is complete. Therefore, it needs about two additional turns to cover the rest 73.1 mm, with a 36 mm helical pitch, In other words, the whole cardiac region can be completely covered by five turns () in total.
Figure 13.
Representative slice of a completeness map for a helical cone-beam scan mode with rotation angle , planar detector W × H = 323.2 × 40 mm, and pitch length h = 36 mm. While the left image is in a display window [0, 1], the right image indicates the exact reconstruction region. The square boxes indicate the VOI. The maximum height of the cylinder that can be 100% covered is about 86.9 mm.
The results for the triple-source helical scan are shown in Fig. 14. It can be seen that the VOI is covered by the exact reconstruction region, which means two turns are enough to cover the cardiac region. So compared with one source helical scan system, it need much less scanning time, leading to an improvement in temporal resolution by a factor of about 2.5.
Figure 14.
Representative slice of a completeness map for a triple-source helical scan mode with rotation angle , planar detector W × H = 323.2 × 40 mm, and pitch length h = 92.7 mm. While the left image is in a display window [0, 1], the right image indicates the exact reconstruction region. The square boxes indicate the VOI, which is covered by the exact reconstruction region.
The results for the inverse-geometry scan are shown in Fig. 15. If the source and detector of the IGCT system have the same axial extent, and the sampling in the axial and transaxial directions is sufficient, the IGCT can also form an exact reconstruction region for the cardiac VOI.
Figure 15.
Representative slice of the completeness map for an inverse-geometry scan mode with source size 231.2 × 160 mm and the detector size W × H = 50 × 160 mm. While the left image is in a display window of [0, 1], the right image is the indicator of exact reconstruction region. The square boxes indicate the VOI, which is covered by the exact reconstruction region.
The results for the composite-circling scan are shown in Fig. 16, from which we can see that the VOI can be covered by the exact reconstruction region. The focal spot is circularly rotated in the plane parallel to the patient motion direction, and we need a collimation design to reject most of scattered photons for any focal spot position.
Figure 16.
Representative slice of the completeness map for a composite-circling scan mode with R1 = 100 mm, planar detector W × H = 536.3 × 637.6 mm. While the left image is in a display window of [0, 1], the right image is the indicator of exact reconstruction region. The square boxes indicate the VOI, which is covered by the exact reconstruction region.
In an improved realization, we could adjust the direction and position of the detector array (the detector array is fixed in the aforementioned simulation) and associated collimators during the scan. We could move the detector in order to keep the line connecting the focal spot to the center of the detector perpendicular to the detector plane and dynamically adjust the collimators to limit the cone beam to project only onto the detector. This can be synchronized with the rotation of the focal spot. In this case, the focal spot rotation plane and the detector plane are not parallel in general, but the detector array size would be much smaller than the fixed one in the above simulation.
Because the interior imaging is only a special case of each architecture, it can be evaluated by the corresponding global version. For example, the completeness map of a global circular scan with 160 mm FOV can be seen as the completeness map of an interior circular scan for the object with a diameter larger than 160 mm.
The completeness metric we derived provides useful information regarding how complete or exact the acquired data would be with a given system design (architecture and scan mode). However, there are two issues we should address to connect the completeness metric and image quality of the proposed system design. First, 100% completeness indicates that acquired data contains all the information to reconstruct the given VOI, but such a reconstruction may be very difficult to define and implement. Second, it is difficult to establish the image quality that corresponds to a completeness level that is less than 100%. For example, voxels with 99% completeness in the wide-cone circular trajectory may or may not introduce significant artifacts compared to voxels with 100% completeness. While the completeness metric cannot uniquely be mapped to the degree of artifact, we do believe that it offers a very valuable criterion, because we know that: (1) 100% completeness affords the opportunity for artifact-free images (ignoring other sources of artifacts); (2) the level of completeness that is achieved at the edge of a 40 mm circular scan is about 99.9% and should be acceptable based on all existing commercial scanners; (3) the level of completeness that is achieved at the edge of a 160 mm circular scan is about 99.0% and should be unacceptable based on the masking out that is performed on today’s 160 mm-coverage commercial scanners; and (4) artifacts should decrease with increasing completeness.
Since there are many factors, such as shape and material of objects, beam hardening, scatter, etc., contributing to the severity of artifacts, it is sometimes hard to connect artifacts and the completeness metric directly. Furthermore, image noise, one of the important image quality characteristics, can only be determined based on a given reconstruction approach. Therefore, additional analysis on possible reconstruction approaches considering factors such as implementation difficulty, associated artifacts, and noise level and uniformity should be performed to complement the completeness map approach. However, the completeness map analysis still offers a good preliminary metric to evaluate the potential image quality in the early phase of considering potential system designs. At this phase, the influence of factors such as the number or the shape of the x-ray source and detector, the system geometry, and so on, must also be considered. But based on the method in this paper, completeness maps can be calculated in a straightforward manner, and these completeness maps can roughly predict the potential image quality of a system design concept under ideal imaging conditions, without developing new reconstruction algorithms as may be required for an entirely new system design.
CONCLUSIONS
We have introduced the concept of completeness maps and demonstrated their applicability in the context of a comprehensive cardiac CT architecture study. Our ultimate goal is to single out the best candidate from all the conceivable system designs for the next-generation cardiac CT. Artifact-free coverage of the cardiac VOI is one of the critical aspects of cardiac CT, and it is indispensible to have a quantitative tool to assess this characteristic. In a future report, we will compare all the candidate architectures in a standardized manner, including performance criteria, complexity and cost analyses, and preliminary estimates of key image quality and radiation dose characteristics. The completeness map analysis method presented in this paper will serve as one of the image quality estimates. This method provides a practical tool for estimating data completeness of complex system architectures and scanning trajectories, where the theoretical image quality analysis is impossible to estimate without yet-undeveloped reconstruction algorithms.
ACKNOWLEDGMENT
This work was partially supported by the NIH/NIBIB Grant No. EB011785.
References
- “Cardiovascular diseases” (World Health Organization, 2012). Available from: http://www.who.int/mediacentre/factsheets/fs317/en/index.html
- Kopp A. F., Klingenbeck-Regn K., Heuschmid M., Küttner A., Ohnesorge B., Flohr T., Schaller S., and Claussen C. D., “Multislice computed tomography: Basic principles and clinical applications,” Electromedica 68, 94–105 (2000). [Google Scholar]
- Tang X., Hsieh J., Nilsen R. A., and McOlash S. M., “Extending three-dimensional weighted cone beam filtered backprojection (CB-FBP) algorithm for image reconstruction in volumetric CT at low helical pitches,” Int. J. Biomed. Imaging 2006, 45942 (2006). 10.1155/IJBI/2006/45942 [DOI] [PMC free article] [PubMed] [Google Scholar]
- Tang X. and Hsieh J., “Handling data redundancy in helical cone beam reconstruction with a cone-angle-based window function and its asymptotic approximation,” Med. Phys. 34, 1989–1998 (2007). 10.1118/1.2736789 [DOI] [PubMed] [Google Scholar]
- Tang X., Hsieh J., Nilsen R. A., Dutta S., Samsonov D., and Hagiwara A., “A three-dimensional-weighted cone beam filtered backprojection (CB-FBP) algorithm for image reconstruction in volumetric CT-helical scanning,” Phys. Med. Biol. 51, 855–874 (2006). 10.1088/0031-9155/51/4/007 [DOI] [PubMed] [Google Scholar]
- Flohr T. G., McCollough C. H., Bruder H., Petersilka M., Gruber K., Suss C., Grasruck M., Stierstorfer K., Krauss B., Raupach R., Primak A. N., Kuttner A., Achenbach S., Becker C., Kopp A., and Ohnesorge B. M., “First performance evaluation of a dual-source CT (DSCT) system,” Eur. Radiol. 16, 256–268 (2006). 10.1007/s00330-005-2919-2 [DOI] [PubMed] [Google Scholar]
- McEntee J., “Toshiba majors on triple-play CT” (2007). Available from: http://medicalphysicsweb.org/cws/article/industry/32028.
- Tuy H. K., “An inversion formula for cone-beam reconstruction,” SIAM J. Appl. Math. 43, 546–552 (1983). 10.1137/0143035 [DOI] [Google Scholar]
- Zeng G., Medical Image Reconstruction: A Conceptual Tutorial (Higher Education Press, Beijing, 2009). [Google Scholar]
- Natterer F., The Mathematics of Computerized Tomography (Society for Industrial and Applied Mathematics, Philadelphia, 2001). [Google Scholar]
- Yang L., Katsevich A., Jun Z., Hengyong Y., and Ge W., “Fast Exact/Quasi-Exact FBP Algorithms for Triple-Source Helical Cone-Beam CT,” IEEE Trans. Med. Imaging 29, 756–770 (2010). 10.1109/TMI.2009.2035617 [DOI] [PMC free article] [PubMed] [Google Scholar]
- Zhao J., Jiang M., Zhuang T. G., and Wang G., “Minimum detection window and inter-helix PI-line with triple-source helical cone-beam scanning,” J. X-Ray. Sci. Technol. 14, 95–107 (2006). [Google Scholar]
- Schmidt T. G., Star-Lack J., Bennett N. R., Mazin S. R., Solomon E. G., Fahrig R., and Pelc N. J., “A prototype table-top inverse-geometry volumetric CT system,” Med. Phys. 33, 1867–1878 (2006). 10.1118/1.2192887 [DOI] [PubMed] [Google Scholar]
- De Man B., Basu S., Fitzgerald P., Harrison D., Iatrou M., Khare K., LeBlanc J., Senzig B., Wilson C., Yin Z., and Pelc N., “Inverse geometry CT: the next generation CT architecture,” Presented at the IEEE Nuclear Science Symposium and Medical Imaging Conference, Honolulu, Hawaii, 2007.
- Wang G., Yu H., and Ye Y., “A scheme for multi-source interior tomography,” Med. Phys. 36, 3575–3581 (2009). 10.1118/1.3157103 [DOI] [PMC free article] [PubMed] [Google Scholar]
- Pack J. D., Noo F., and Kudo H., “Investigation of saddle trajectories for cardiac CT imaging in cone-beam geometry,” Phys. Med. Biol. 49, 2317–2336 (2004). 10.1088/0031-9155/49/11/014 [DOI] [PubMed] [Google Scholar]
- Yu H., Zhao S., Ye Y., and Wang G., “Exact BPF and FBP algorithms for nonstandard saddle curves,” Med. Phys. 32, 3305–3312 (2005). 10.1118/1.2074207 [DOI] [PubMed] [Google Scholar]
- Yu H. and Wang G., “Cone-beam composite-circling scan and exact image reconstruction for a quasi-short object,” Int. J. Biomed. Imaging 2007, 87319 (2007). 10.1155/2007/87319 [DOI] [PMC free article] [PubMed] [Google Scholar]
- Ye Y., Yu H., and Wang G., “Exact interior reconstruction with cone-beam CT,” Int. J. Biomed. Imaging 2007, 10693 (2007). 10.1155/2007/10693 [DOI] [PMC free article] [PubMed] [Google Scholar]
- Ye Y., Yu H., Wei Y., and Wang G., “A general local reconstruction approach based on a truncated Hilbert transform,” Int. J. Biomed. Imaging 2007, 63634 (2007). 10.1155/2007/63634 [DOI] [PMC free article] [PubMed] [Google Scholar]
- Ye Y., Yu H. Y., and Wang G., “Exact interior reconstruction from truncated limited-angle projection data,” Int. J. Biomed. Imaging 2008, 427989 (2008). 10.1155/2008/427989 [DOI] [PMC free article] [PubMed] [Google Scholar]
- Yu H., Ye Y., and Wang G., “Interior reconstruction using the truncated Hilbert transform via singular value decomposition,” J. X-Ray. Sci. Technol. 16, 243–251 (2008). [PMC free article] [PubMed] [Google Scholar]
- Yu H. and Wang G., “Compressed sensing based interior tomography,” Phys. Med. Biol. 54, 4341–4341 (2009). 10.1088/0031-9155/54/13/C01 [DOI] [PMC free article] [PubMed] [Google Scholar]
- Grass M., Manzke R., Nielsen T., Koken P., Proksa R., Natanzon M., and Shechter G., “Helical cardiac cone beam reconstruction using retrospective ECG gating,” Phys. Med. Biol. 48, 3069–3084 (2003). 10.1088/0031-9155/48/18/308 [DOI] [PubMed] [Google Scholar]
- Wang G., Ye Y., and Yu H., “Approximate and exact cone-beam reconstruction with standard and non-standard spiral scanning,” Phys. Med. Biol. 25, R1–R13 (2007). 10.1088/0031-9155/52/6/R01 [DOI] [PubMed] [Google Scholar]
- Schmidt T. G., Fahrig R., Pelc N. J., and Solomon E. G., “An inverse-geometry volumetric CT system with a large-area scanned source: A feasibility study,” Med. Phys. 31, 2623 (2004). 10.1118/1.1786171 [DOI] [PubMed] [Google Scholar]


