Abstract
Hypothesis
Cochlear trauma due to electrode insertion can be detected in acoustic responses to low frequencies in an animal model with a hearing condition similar to patients using electroacoustic stimulation.
Background
Clinical evidence suggests that intracochlear damage during cochlear implantation negatively affects residual hearing. Recently, we demonstrated the utility of acoustically evoked potentials to detect cochlear trauma in normal hearing gerbils. Here, gerbils with noise-induced hearing loss were used to investigate the effects of remote trauma on residual hearing.
Methods
Gerbils underwent high-pass (4 kHz cutoff) noise exposure to produce sloping hearing loss. After one-month recovery, each animal’s hearing loss was determined from ABRs and baseline intracochlear recording of the cochlear microphonic (CM) and compound action potential (CAP) obtained at the round window. Subsequently, electrode insertions were performed to produce basal trauma while the acoustically generated potentials to a 1 kHz tone burst were recorded after each step of electrode advancement. Hair cell counts were made to characterize the noise damage and cochlear whole mounts were used to identify cochlear trauma due to the electrode.
Results
The noise exposure paradigm produced a pattern of hair cell, ABR and intracochlear potential losses that closely mimicked that of EAS patients. Trauma in the basal turn, in the 15 – 30 kHz portion of the deafened region, remote from preserved hair cells, induced a decline in intracochlear acoustic responses to the hearing preserved frequency of 1 kHz.
Conclusions
The results indicate that a recording algorithm based on physiological markers to low frequency acoustic stimuli can identify cochlear trauma during implantation. Future work will focus on translating these results for use with current cochlear implant technology in humans.
Keywords: Cochlear Implant, Cochlear Electrophysiology, Noise Damage, Hearing Preservation, Electric-Acoustic Stimulation
INTRODUCTION
Historically, cochlear implants have provided acoustic information to the profoundly deaf. Today, many patients with substantial hearing are receiving cochlear implants to improve speech understanding1. This trend is mainly based on clinical data demonstrating speech and language benefits above those available from the preoperative hearing remnants2. Such benefits are critical since natural hearing is usually compromised as a result of intrachochlear electrode placement, either during implantation or due to postoperative changes.
However, since the 1990s it has been known that hearing remnants can be preserved after implantation3. Currently the surgeon is unable to determine intraoperatively whether residual hearing has successfully been preserved. This uncertainty creates a problem, where in an attempt to preserve residual hearing, the cochlear implant may be suboptimally placed if hearing remnants are unknowingly destroyed, possibly resulting in poorer auditory performance outcomes when compared to traditional cochlear implantation. On the other hand, it is evident that if the residual hearing is preserved post implantation, the patient can benefit from the combination of electrical and acoustic stimulation (EAS, or hybrid stimulation)4–6. It is now believed that acoustic stimulation at low frequencies provides a pitch cue by encoding the fundamental frequency and initial harmonics of periodic stimuli such as vowels7. This pitch cue then aids speech recognition, with particular improvements in noisy environments.
To optimize these effects, low frequency residual hearing should be preserved. Clinical data, however, demonstrates that even with advanced surgical techniques many patients will lose hearing at least partially8. Presumably, reduced intracochlear trauma could improve outcomes, and much effort is being devoted to surgical and electrode improvements9,10. The ability to detect intracochlear damage during implantation would allow the surgeon valuable information as to whether a traditional implantation should be performed in the situation of intraoperative residual hearing loss versus whether the patient may be able to benefit from implantation that would result in EAS stimulation.
Our approach is to develop an intraoperative physiological recording system to identify markers of surgical trauma, cochlear health, and intracochlear electrode position. In this report we describe experiments using a gerbil model of noise-induced hearing loss (NIHL) for electrode insertions. The hypothesis is that cochlear trauma due to electrode damage in the base of the cochlea can be detected based on changes in auditory responses from hair cells and nerve fibers from the apical region of the cochlea. Mechanical damage to the base as a result of electrode insertion is thought to disrupt normal cochlear anatomy allowing for mixing of perilymph and endolymph disrupting the normal difference in concentrations of ions between these two fluids. The contiguous nature of these compartments up to the apex may allow for anatomic disruptions remote from the apex to still effect apical responses by decreasing ion gradients and creating a toxic enviroment. Here, we demonstrate that the gerbil model of NIHL is a close physiological match to human EAS patients, and trauma expected during a human surgery can be detected via intracochlear recordings.
MATERIALS AND METHODS
The basic procedure was to: 1) use noise exposure to produce hearing loss comparable to those of EAS patients, 2) characterize the hearing loss using the auditory brainstem response (ABR) and round window recordings of the cochlear microphonic (CM) and compound action potential (CAP), and 3) insert an electrode through the round window directed towards the basilar membrane (BM) to determine the effect of basal cochlear damage on the responses of hair cells in apical regions.
Animals
The Mongolian gerbil (Meriones unguiculatus) was used because its low frequency hearing range is similar to humans and because its cochlea is easily accessible through the large auditory bulla. All animals were handled and housed according to the standards described by the National Institutes of Health Committee on Care and Use of Laboratory Animals, and experimental protocols were approved by the Institutional Animal Care and Use Committee at the study institution.
Noise Exposure
The anesthetized animal (Nembutal 60 mg/kg) was placed in a single-walled sound-attenuated chamber (Industrial Acoustics, NY), suspended in a wire cage in the middle of the sound chamber 23 centimeters under a loudspeaker (Selenium, Nova Santa Rita/RS Brazil, Model D3300Ti). High-pass noise with a cut-off frequency of 4 kHz was presented at 122 dB sound pressure level (SPL, re 20 µPascal) for four hours. The speaker characteristics caused a 10 dB reduction above 25 kHz. The sound level was monitored throughout the exposure period with a 1/4” Bruel and Kjaer (Nærum, Denmark) microphone and did not vary more than 1 dB. A 4 kHz high pass cutoff was chosen because it corresponds to the 1 – 1.5 kHz frequency range in the human since both frequencies are slightly less than 50% distance from the apex. The 1 – 1.5 kHz frequency range is currently the cutoff for hearing loss above which patients are considered for cochlear implants. After noise exposure four weeks were allowed to stabilize cochlear damage. Previous studies of noise induced hearing loss in various animals, have made a distinction between resulting temporary threshold shifts and permanent threshold shifts (ref). In these studies temporary threshold shifts returned back to baseline levels in a maximum of two weeks. Permanent threshold shifts were noted to be detected 24hrs after noise exposure and remained stable for at least eight weeks. Therefore we believe our waiting period of four weeks is adequate to ensure permanent threshold shifts. With regards to histologic damage stabilization, many different intracochlear cellular populations have been studied for changes immediately after noise exposure and with time. Previous studies have found a loss of the inner row of outer hair cells (OHCs) to be consistent with a permanent threshold shift. The results of our histology, described later, are consistent with physiologic permanent threshold shifts in hearing.
ABR recording
ABRs were taken prior to noise exposure and after the four-week survival period. For the pre-noise exposure, the animal was anesthetized as above. For post-exposure experiments, urethane (25%, i.p.) was used because of the long experiment duration of up to 10 hours. The use of the different anesthetic could potentially affect the post noise exposure ABR results and therefore the findings were further confirmed with recordings taken with an electrode at the round window (RW), which were compared to a normal hearing animal having undergone the same anesthesia protocol (further outlined in subsequent sections). The head behind both auricles was shaved. The animal was placed on its left side in a double-walled, sound attenuated booth, with its right ear facing the speaker. The animal rested on a heating pad set to 37°C, and rectal temperature was monitored throughout the experiment and kept between 36–38°C. Needle electrodes were inserted subcutaneously. The positive lead to the amplifier (Grass Instruments model P15D, West Warwick, RI) was connected to an electrode between the ears, the return electrode was over the right mastoid and the ground over the left mastoid. Gain was 1000× and filters were bandpass from 10–50,000 Hz. ABRs were recorded to 500–1000 repetitions of free-field clicks and tone bursts with alternate polarity (0.5–16 kHz in octave steps) delivered from a well-shielded loudspeaker (Beyer DT-48, Farmingdale, NY, USA) placed 19 centimeters from the animal’s eardrum. Stimuli were calibrated by placing the microphone in the position of the animal’s head. Tone bursts had rise/fall times of 2 ms shaped by a Blackman window with no plateau. The response magnitude was determined after filtering (0.5–3kHz) and windowing (1–6 ms).
Surgery and Intracochlear Recordings
Opening the bulla provided exposure to the round window and the basal turn of the cochlea. To avoid temperature-related artifacts the core temperature was monitored with a rectal probe and maintained at approximately 37°C with heating pads and a heat lamp, and the temperature at the round window was monitored at regular time intervals using a T type, copper-constantan thermocouple (IT-24P, Physitemp Instruments Inc., Clifton, NJ). The lamp warmed the bulla to keep the round window temperature in the range of 36.5 – 38.5°C. The recording electrode was attached to a hydraulic micromanipulator and placed against the intact round window membrane. The electrode was a rigid 50 µm diameter Teflon-coated, tungsten-iridium wire with about 50 µm of tip insulation removed. The electrode was connected to the positive input of the amplifier, the negative electrode to the neck musculature and the ground to the tail. Baseline recordings from the round window were made to 100 repetitions of tone bursts (0.5–16 kHz in octave steps) with intensities from −7 to 95 dB SPL, in 3 dB steps. Tone bursts had 2 ms rise/fall times shaped by a Blackman window and a 10 ms plateau.
A FFT was used to estimate the CM magnitude at the signal frequency, after filtering (0.5–2 octaves) and windowing to avoid the CAP (6–11 ms). Filtering (0.5–1.5 kHz) and windowing (1–6 ms) was also used to isolate the CAP.
After baseline round window recordings across frequencies, the same recording electrode was advanced past the round window membrane radially across scala tympani toward the BM in 50–200 µm steps. Recordings of the CM and CAP to a single frequency (1 kHz) and suprathreshold intensity (typically 60–80 dB SPL) were made at each step. Insertions were made up to a maximum depth of 1.3 mm past the RW membrane because given the estimated trajectory of the electrode and the dimensions of the gerbil cochlea, the tip of the electrode was most likely to have at least reached the scala vestibuli of the basal turn at this depth but not likely to have crossed over into the scala tympani of the second turn by going through the interscalar septum. There were two animals where the electrode was advanced further than 1.3 mm to 1.7 mm, however, we were careful to examine for damage anywhere past the basal turn of the cochlea in these cases.
Morphologic Assessment
The cochleae were fixed and removed en block. Both cochleae were decalcified and bone was removed by dissection. For the left cochlea, the BM-organ of Corti complex was dissected, stained with cresyl violet, and mounted on a slide and cover-slipped. Both inner and outer hair cell neuclei (IHCs and OHCs respectively) were counted in 250 µm increments using a Zeiss Axioscope with 40× objective (Carl Zeiss Inc, Thornwood, NY)11. The preparation was then photographed with a 10× objective and a montage made of the complete cochlea using Photoshop CS3® (Adobe, San Jose, CA). The right cochlea, where the insertion was made, was prepared as a whole mount and stained with toluidine blue. Cochlear damage due to the electrode was photographed at 10–50× using a Wild M50 dissecting microscope (Leica Inc., Wetzlar, Germany).
RESULTS
Previously, high-pass noise exposure was shown to produce hearing loss in a frequency range consistent with EAS candidates12. Anatomically, this exposure produced complete loss of OHCs in the basal turn, a transition zone with partial hair cell loss, and complete preservation of apical OHCs. Physiologically, a sloping hearing loss determined from ABRs and loss of intracochlear potentials was consistent with the noise exposure and hair cell loss. Due to the low number of animals, however, variability remained difficult to assess. The first part of this report will describe a larger sample of animals to characterize the degree of anatomical and physiological changes. The second part describes experiments to determine the effect of acute damage to the basal cochlea on responses to acoustic stimuli from preserved apical hair cells and nerve fibers. This condition is similar to that during a cochlear implantation for hearing preservation.
Noise-exposed gerbil model of hearing preservation surgery
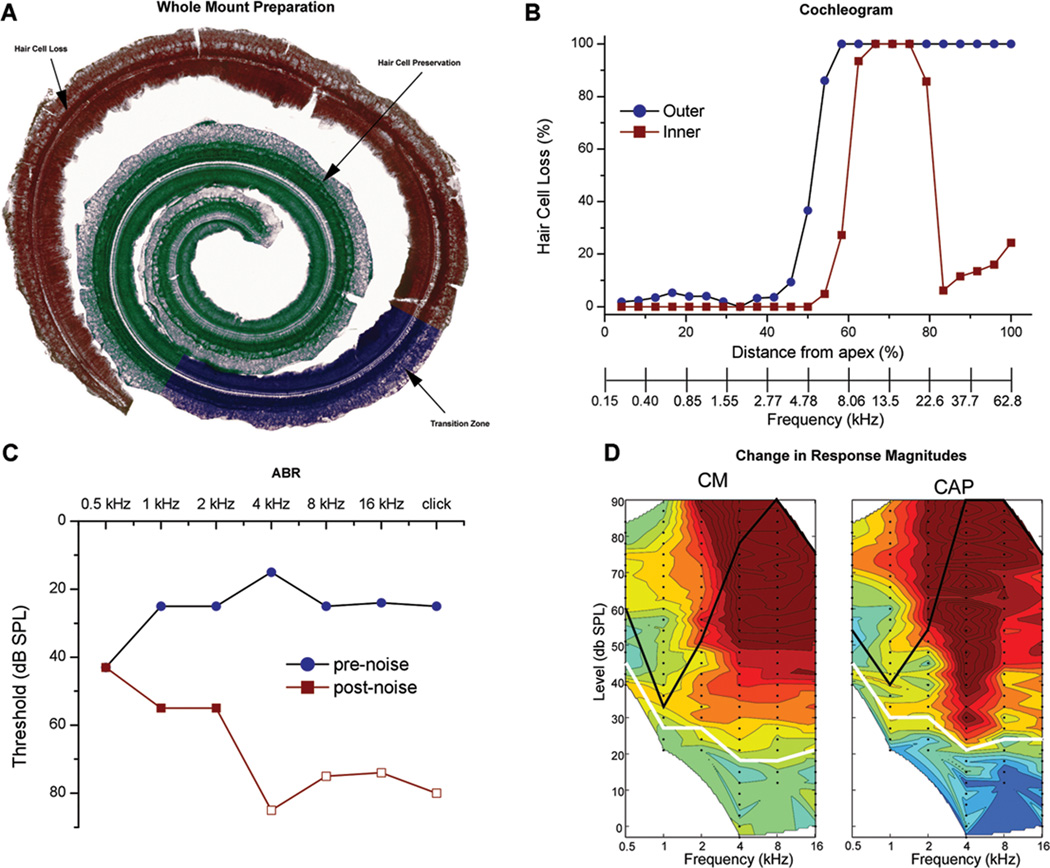
For each noise-exposed animal (n=22), we determined the loss of OHCs and IHCs and the hearing loss from ABRs and from the CM and CAP as measured from the round window. An example data set is shown in Figure 1. Figure 1A is the dissected BM-organ of Corti complex, showing the zones of hair cell loss, preservation, and the transition zone in between. Zones were determined from OHC counts by counting nuclei of OHCs after staining with cresyl violet (Fig. 1B). The ear examined for this purpose was contralateral to that used for the electrode insertion. The previous report showed a high correlation of hair cell loss in the two ears using similar methods12. The frequency axis in Fig. 1B was derived from the gerbil place-frequency map13. The transition zone defined by 20–80% OHC loss extended from 3.5–5 kHz. The transition zone for IHCs was shifted basally, and some hair cells were preserved in the extreme base of the cochlea. These basal IHCs were commonly observed but did not appear to affect the recordings (see Discussion). Fig. 1C shows the hearing loss in this gerbil by comparing ABR recordings prior to noise exposure to ABRs taken four-weeks after noise exposure. There was a large change in thresholds at higher frequencies (4–16 kHz) and preservation of hearing at low frequencies (0.5–2 kHz). CM and CAP recordings at the round window of a noise-exposed gerbil (Fig. 1D) were compared to a normal-hearing animal. Red indicates loss of response and green/blue no loss. There is no loss noted at low intensity stimuli since once below threshold there is minimal to no change in response when comparing the noise exposed animal to a normal hearing animal. White lines indicate threshold in the normal hearing standard, and black lines the thresholds for the noise exposed animals. As in the ABRs, frequencies from 4–16 kHz were more affected than frequencies from 0.5–2 kHz, which still had robust responses to sound. Results across animals will now be described.
Figure 1.
A: Dissected BM-organ of Corti complex after noise exposure stained with cresyl violet. Three zones were identified under direct visualization and colored with photoshop. The cochlea shows a complete loss of OHCs in the basal region (red) followed by a transition zone with partial OHC loss (blue) and an apical area of complete OHC preservation (green). B: Cochleogram of inner and outer hair cell loss as a function of cochlear distance and frequency as determined from a gerbil cochlear frequency map (Mueller et al., 1996). C: Pre and Post noise exposure ABRs. Open symbols indicate no response at the highest intensity measured. D: Contour plots of the difference between the standard response at the round window of a normal hearing gerbil and the test response at the round window of a noise exposed gerbil. Green is no difference, blue is an increased response and red is a decreased response compared to normal hearing animals used as a standard (color scale of the CM is from 25 (dark blue) to 160 dB (red) re 1 µV/Hz, and the CAP is from 25 to 60 dB, re 1 µV). White lines are the thresholds of the standard and black lines are the thresholds of the test animal. There is a large response decrease for the higher frequencies (4 – 16 kHz) at the high intensities. There is small to no change in response seen to the high frequencies at the lower intensities since the standard response at these levels are small to none, therefore the magnitude of change is minimal to none even if there is no response in the noise exposed animals to these low levels.
Hair cell loss
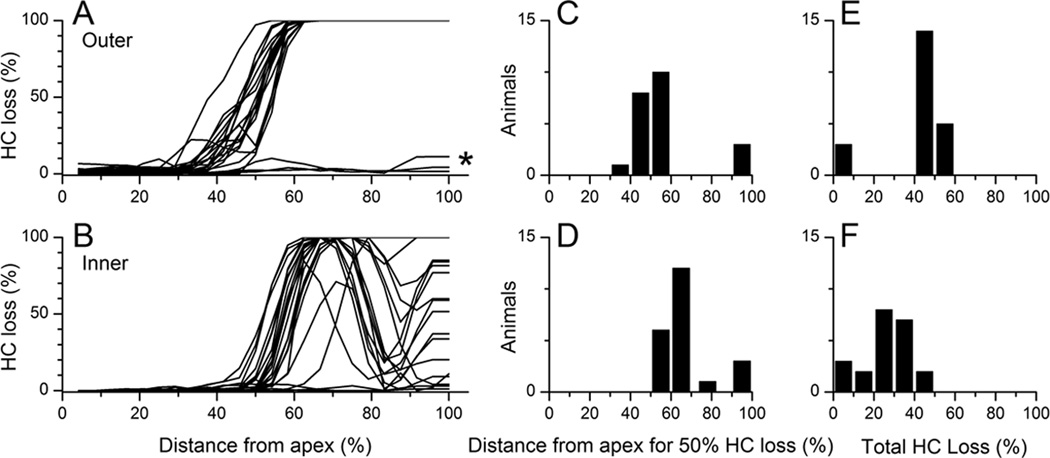
Cochleograms of OHCs and IHCs from all 22 noise exposed animals are shown in Fig. 2A–B. In most cases (n=19) the transition zone for both OHCs and IHCs occurred at approximately the same location, which is consistent with the uniform cutoff frequency used for all animals. In general, the transition zone for IHCs was shifted basally compared to OHCs. This result is consistent with previous reports14. Many cases had some preserved IHCs at the extreme base. Three of the 22 cases showed much less anatomical damage with regards to inner and outer hair cell loss as a result of noise exposure (asterisk in Fig. 2A).
Figure 2.
A: OHC cochleograms for all noise exposed animals (n=22). Counts were made in 250 µm sections, and losses are in reference to average results in normal-hearing animals (n=3). Gerbil cochlear length was ~12 mm in all animals. B: IHC cochleograms. C and D: Histograms of the position of 50% hair cell loss as a function of distance along the BM. E and F. Histograms of total amount of hair cell loss.
Histograms of the cochlear position at the middle of the transition zone are presented in Fig. 2C and D for OHCs and IHCs, respectively, and the total hair cell losses are presented in Fig. 2E and F. The basal shift of the transition zone for IHCs is apparent, as is the greater variability in IHC loss.
Hearing loss measured with ABRs
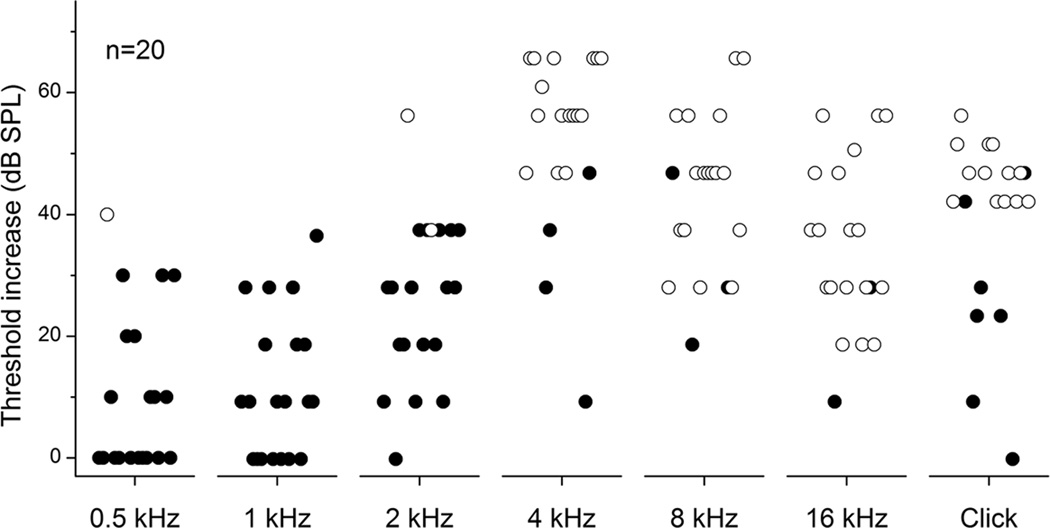
Hearing loss was estimated from ABRs in 20 of the 22 cases (Fig. 3). Two cases with incomplete ABR recordings in the pre-exposure condition were excluded. Open symbols indicate that no measureable response was obtained at the largest intensity tested. Larger losses in hearing at higher frequencies and preservation at lower frequencies were present for most cases.
Figure 3.
Test of hearing loss due to noise exposure based on pre and post exposure ABRs to different frequency tone pips and click stimuli as indicated (n=20). Closed circles demonstrate measurable post-exposure thresholds while open circles indicate a minimum change based on the highest threshold tested.
Hearing loss measured at the round window
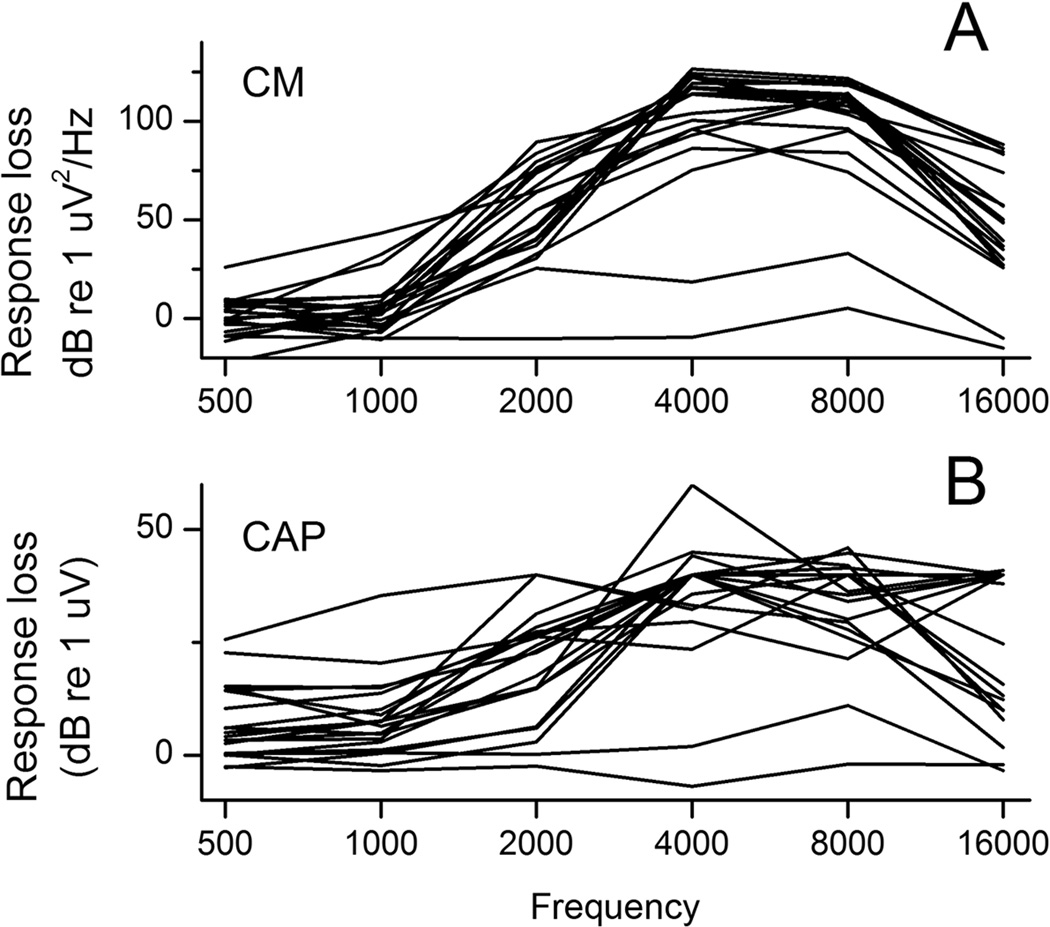
As expected from hair cell and ABR data, the response loss for the CM and CAP was greater for high frequencies, 4–16 kHz, than for lower frequencies, 0.5–2 kHz (Fig. 4, n=22). Interestingly, there was only a small change in CM for the lower frequencies even though a significant loss of both OHCs and IHCs was present. The CAP showed a larger degree of response loss to low frequencies (Fig. 4B). Two of the three animals with no loss of inner and outer hair cells showed expected physiology with no significant threshold shifts across all frequencies tested (0.5, 1, 2, 4, 8, and 16 kHz) for both the CM and CAP baseline RW recordings.
Figure 4.
The magnitude of response loss of the CM (A) and CAP (B) across frequencies relative to a normal hearing standard animal. These plots are essentially summing the columns of contour plots such as those shown in Fig. 1D.
Effects of Basal Damage on Intracochlear Potentials From Preserved Apical Hair Cells and Nerve Fibers
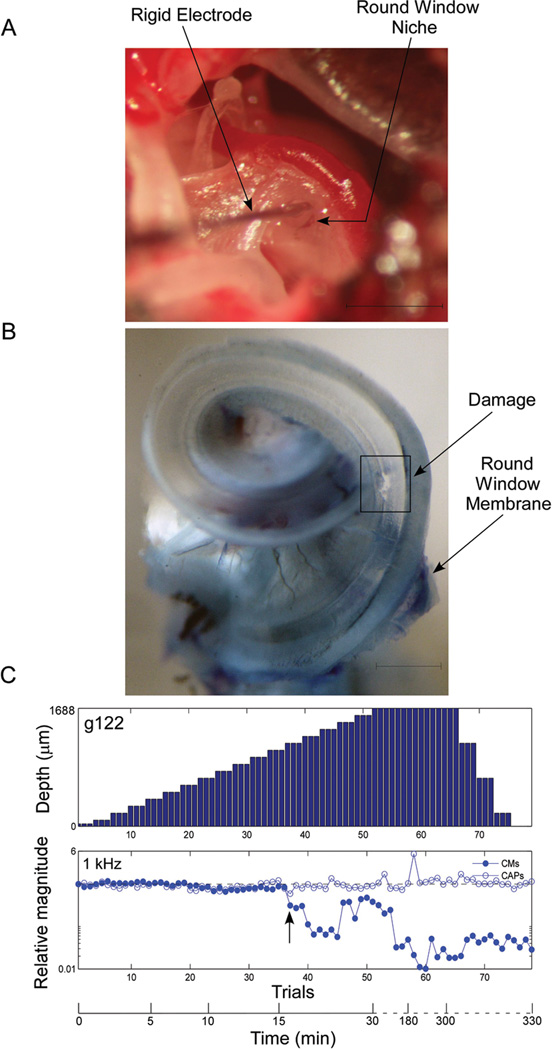
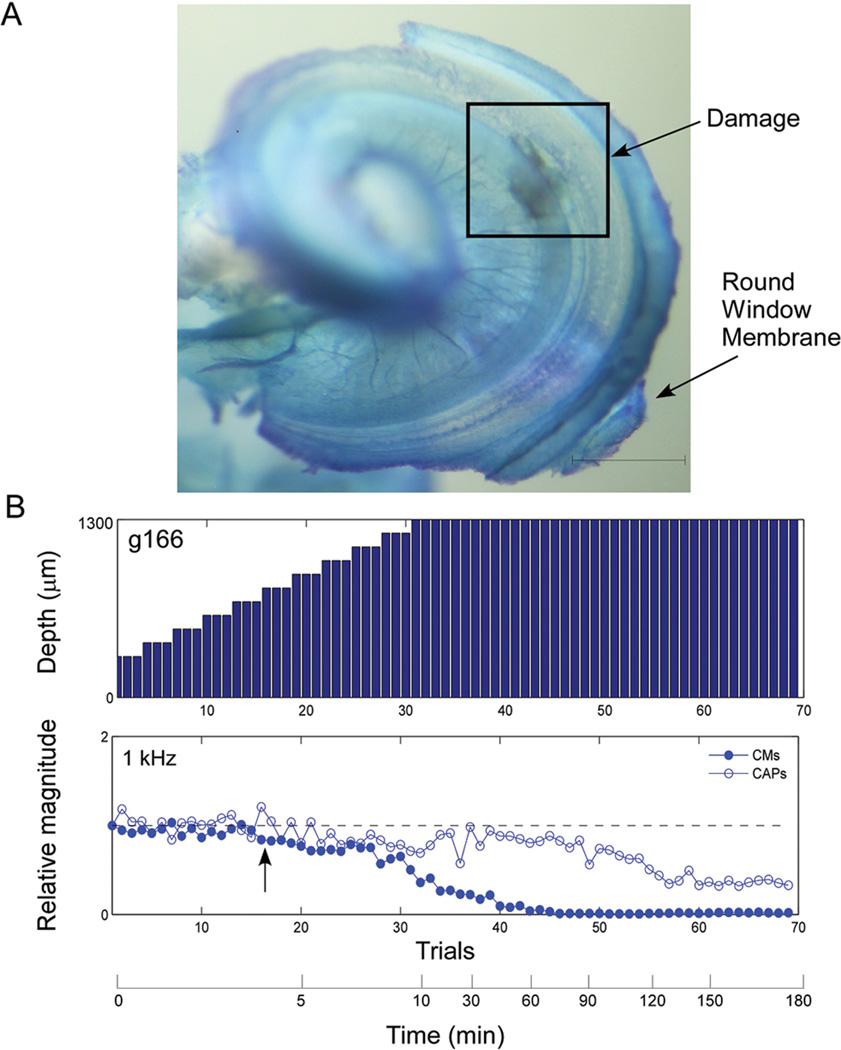
After the previous measurements, the electrode was advanced through the round window and directed at the BM (Fig. 5A). A maximum depth of 1300 µm was used in most cases so that the insertion would approach the BM but not extend to the next cochlear turn (e.g., Fig. 5B and 6A). Out of 22 noise exposed animals successful insertion with confirmed anatomical damage occurred in 11 animals (Table 1). An additional four animals served as controls where the electrode was inserted through the round window and stopped there for a period of time (Table 1). In three animals, hearing loss was limited and they were excluded. An additional four animals were omitted, three because the insertion trajectory caused electrode buckling, and one because the insertion penetrated into the second turn.
Figure 5.
Example of an intracochlear electrode penetration (case 122) with rapid decline in signals in the setting of sloping noise induced sensorineural hearing loss. A: Surgical situs demonstrating the exposed bulla including the round window. The electrode is a 50 µm tungsten rod as described. The electrode is directed towards the BM as evidenced by the darker stain of the stria vascularis observed through the round window membrane. Scale represents 1 mm. B: Cochlea whole mount specimen obtained after the animal was sacrificed. Round window membrane is preserved during dissection. Damage is observed in the basilar membrane. Scale represents 0.5 mm. C: Serial intracochlear recordings during electrode penetration. After each electrode advancement (between 50–100 µm), a response to one suprathreshold stimulus at 1,000 Hz was obtained and CM and CAP magnitudes were calculated. Then, these were compared to the standard obtained at the round window. Arrow indicates start of decline in CM response. A maximum insertion of 1688 um is noted, which is greater than most other insertions because we were confident the electrode had not penetrated into the second turn (later confirmed by histology). We took a more conservative approach in subsequent experiments with the shallower insertion depth of 1300 um.
Figure 6.
Example of an intracochlear electrode penetration with gradual decline in response magnitudes in the setting of sloping noise induced sensorineural hearing loss. A: Cochlea whole mount specimen obtained after the animal was sacrificed. Note area of damage to the basilar membrane and also a large area of injury evidenced by presence of a blood clot on the osseous spiral lamina, medial to the basilar membrane damage. Scale represents 0.5 mm. B: Serial intracochlear recordings during electrode penetration as in Fig 5. Arrow indicates start of decline in CM response.
| Histology | Physiology to 1kHz tone burst | ||||||||||
|---|---|---|---|---|---|---|---|---|---|---|---|
| Damage | RW Response |
At Max Depth |
End of Experiment |
||||||||
| Animal # |
Max Electrode Insertion Depth (mm) |
Size (mm2) |
Location | Distance of Damage from Base (mm) |
Greenwood Frequency at Damage Location (kHz) |
Basal IHC Present? |
CM decline? |
CAP decline? |
CM magnitude (mV2/dB) |
Loss of Signal (dB) |
Loss of Signal (dB) |
| Cases Showing Damage from Electrode | |||||||||||
| 122 | 1.7 | 0.007 | BM | 1.93 | 27.7 | yes | yes | no | 4.86E-04 | 9.94 | 30.48 |
| 127 | 1.3 | 0.005 | BM | 3.28 | 15.7 | yes | yes | yes | 1.51E-02 | 7.78 | 50.88 |
| 151 | 1.3 | 0.028 | OSL | 2.22 | 24.5 | no | yes | yes | 3.18E-02 | 0.78 | 52.58 |
| 163 | 1.3 | 0.077 | OSL/BM | 2.08 | 26 | no | yes | yes | 4.83E-02 | 0.74 | 52.68 |
| 173 | 1.3 | 0.034 | BM/SL | 2.6 | 20.8 | yes | yes | no | 5.12E-02 | 17.04 | 22.36 |
| 159 | 1.3 | 0.020 | BM | 2.8 | 19.1 | yes | yes | yes | 1.88E-02 | 13.77 | 26.30 |
| 187 | 1.3 | 0.012 | BM/SL | 2.8 | 19.1 | no | yes | yes | 6.63E-03 | 25.08 | 46.93 |
| 188 | 1.3 | 0.017 | BM/SL | 2.66 | 20.3 | yes | yes | yes | 6.81E-02 | 18.30 | 51.08 |
| 166 | 1.3 | 0.013 | OSL/BM | 2.47 | 22 | no | yes | yes | 2.44E-02 | 5.96 | 34.17 |
| 180 | 1.3 | 0.010 | BM | 2.15 | 25.2 | yes | yes | yes | 5.19E-04 | 7.19 | 12.62 |
| 185 | 1.7 | 0.034 | BM | 2.26 | 24 | yes | no | no | 3.70E-05 | −2.42 | −0.51 |
| No Electrode Damage Controls | |||||||||||
| 170 | 0.4 | yes | yes | yes | 3.47E-02 | 14.94 | |||||
| 174 | 0.4 | yes | yes | yes | 4.39E-03 | 5.23 | |||||
| 175 | 0.4 | yes | no | no | 3.74E-04 | −2.87 | |||||
| 177 | 0.4 | no | no | no | 5.12E-03 | −0.30 | |||||
Abbreviations: IHC: inner hair cells, RW: round window, BM: basilar membrane, OSL: osseous spiral lamina, SL: spiral ligament, CM: cochlear microphonic, CAP: compound action potential
Two outcomes were noted in the 11 experimental cases. In ten cases there was a decline in the CM to the 1 kHz stimulus, presumably due to disruption of contact with the BM by the electrode, and the decline continued as the experiment progressed (e.g., Fig. 5C). In the case in Fig. 5C the CAP response to the 1kHz stimulus was unaffected by the electrode insertion, but in eight cases the CAP declined as well (Table 1), although to a lesser extent than the CM. In one of the 11 cases there was clear anatomical damage as a result of electrode insertion but no response decline in either CM or CAP was seen. This case had the smallest response magnitude to the 1kHz stimulus for both the CM and CAP of any case prior to the start of the insertion (Table 1). In all 11 cases there was a measurable CM to the 1 kHz stimulus at the end of the experiment.
Intracochlear damage was found either in the OSL, BM, SL, or a combination of OSL and BM or BM and SL (Table 1). No correlation between the decline in the CAP response and the location of the damage was noted.
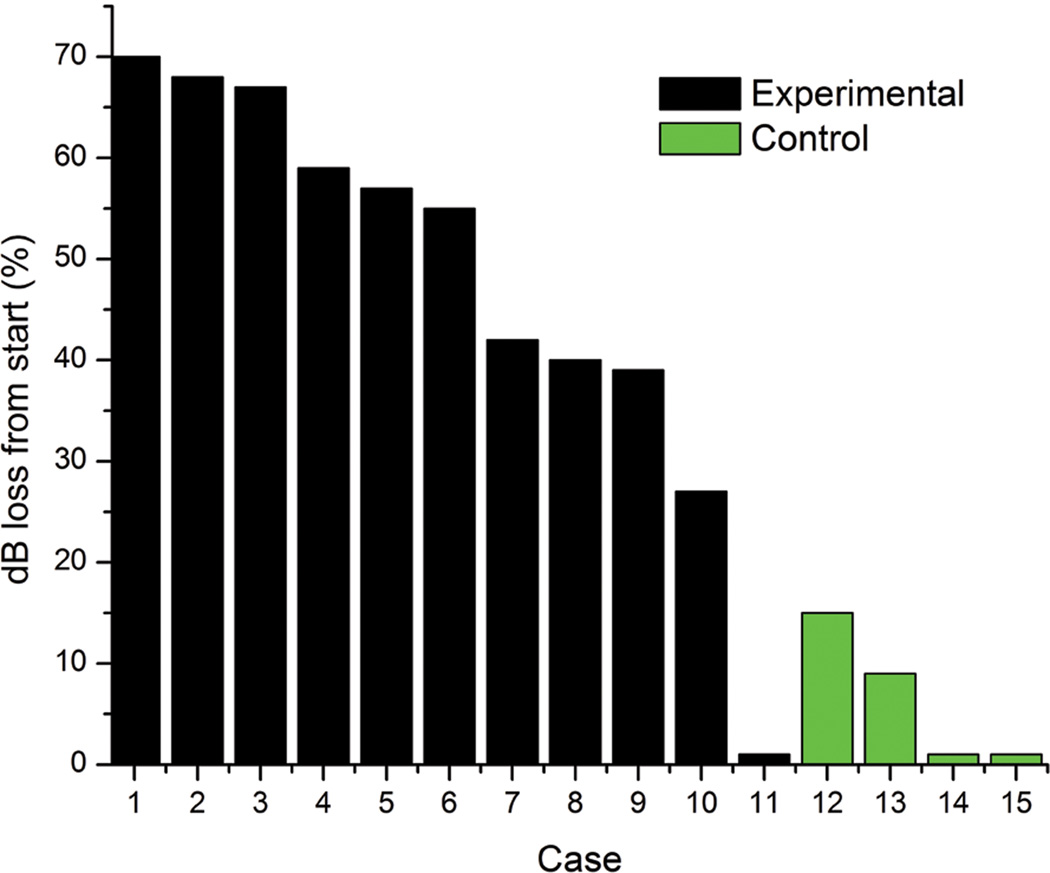
In the four control cases, two cases had no change in CM or CAP response to the 1kHz stimulus frequency, but two showed a decline of the CM and CAP. We looked at the decline in CM response to the 1 kHz stimulus in both absolute numbers and in percentage of loss from starting response at the round window in both the experimental and control cases. When looking at the percentage of CM loss, there is only one experimental case that shows overlap with the control cases. This case is unique when compared to the other experimental cases in that it had a very small CM response at the round window to begin with and therefore there was not much response decline that could occur. We believe the poor initial response in this case may be due to a greater effect of noise exposure on this animal, since the CM threshold at 1 kHz was increased. All other cases showed a response magnitude greater than 3.74E-04 at the round window, and easily discernable waveforms on raw recordings. All other experimental cases showed a much greater percent loss of response than the controls (Fig. 7).
Figure 7.
Histogram of percent CM response loss to 1 kHz tone burst for each electrode insertion case. Black bars represent 11 experimental cases where electrode was inserted to a depth of 1.3 – 1.7 mm past the round window. Green bars represent four control cases where electrode was inserted just past the round window to a depth of 0.4 mm.
DISCUSSION
With the noise exposure protocol, a consistent hearing loss was produced that resembles the hearing loss of a candidate for hearing preservation surgery. The insertion experiments in this model characterized the effects of cochlea trauma on residual hearing. They showed that basal trauma can be indicated by response reductions to acoustic stimuli from preserved apical hair cells. In the following, we will discuss the characteristics of the model and implications of the insertion results for monitoring the status of cochlear health during surgery.
Noise Induced Hearing Loss Model
In a previous report we showed that results comparable to those shown here could be obtained with 120 dB stimulation for 3–4 hours12. However, stimuli less intense by only a few dB or of shorter duration yielded only a partial loss of basal hair cells. Here we show that a slight increase in intensity to 122 dB yielded the intended results 86% of the time (19 of 22 cases).
Three animals showed preservation of basal OHCs and IHCs, and two of these had a high degree of hearing as well. We saw no factors at the time of exposure that might account for these cases. Normal ABRs were recorded prior to the experiments. Ears were not monitored after placement in the sound chamber, so it is possible that the ear canals collapsed in the anesthetized animals.
There was a basal shift in the transition zone with IHCs compared to OHCs, similar to previous studies14. In some cases IHCs were also seen at the extreme base of the cochlea. These remnants presumably persist due to the reduced output of the speaker above 25 kHz, and are a potential confounding factor in the insertion experiments. However, several findings suggest that these IHCs do not contribute substantially: First, due to their high frequency location, they would be expected to contribute mainly to responses to high frequency stimuli rather than to the 1kHz frequency focused herein. There was little or no ABR, CM or CAP response to the high frequency stimuli, so the contribution to the recorded low frequency signals seems negligible. Second, histology from the base was far from normal: for instance, there was a complete absence of OHCs indicating a non-operational cochlear amplifier. Third, the CM at 1 kHz was relatively unaffected by the noise exposure, indicating that even in the normal-hearing animal this potential arises primarily from apical hair cells. Fourth, the speed and magnitude of the decline in response during insertions did not correlate to the presence or absence of these cells (Table 1). Thus, we do not consider the remnants of basal IHCs to be a major confounding factor to the results.
In contrast to the CM, the CAP at 1 kHz was reduced after noise exposure in most cases. This difference may be due to the different rates of saturation with intensity. The CM is linear with intensity except at the highest intensities. Near threshold, regions with characteristic frequency (CF) slightly above the stimulus frequency provide the greatest contribution to the CM15. As the intensity increases the contributing region will spread basally (due to basilar membrane mechanics). However, because the CM is non-saturating the contribution from CF regions near the stimulus frequency will increase as well, so that the center of gravity of the CM source will shift relatively little. Consequently, the CM response at low frequencies is largely derived from relatively apical hair cells that were not damaged by the noise exposure. In contrast, the contribution of nerve fibers at any one site contributing to the CAP is highly saturating, because it is limited to one or a few spikes at onset and therefore provides nearly the same contribution at all intensities above threshold. Basal spread and consequent shifts in the center of gravity of the source generator with increased intensity would thus be large. In this case, the absence of responses from basal fibers produce a large loss of the CAP to low frequencies.
Another possible cause of greater loss of CAP than CM is greater loss of nerve fibers than hair cells. At present we have not measured nerve fiber loss with our noise exposure, and it would not likely be complete after one month post-exposure in any case. Given that the nerve/IHC synapse is highly vulnerable to excitotoxicity, apical spread of nerve fiber damage relative to hair cell loss is possible.
Overall, how does the gerbil model compare to human EAS cases? The main feature of most EAS surgeries is sloping hearing loss due to loss of the organ of Corti in the basal cochlea and preservation in the apical cochlea. We capture this feature in the gerbil model. Gerbils hearing range extends much higher than humans, so that similar frequencies are not represented at similar positions. In humans, typical candidacy criteria for EAS or Hybrid stimulation include a severe-to-profound hearing loss above 1,000 or 1,500 Hz6,16,17. If hearing is preserved above these frequencies, speech understanding can be high and no large benefit would be provided by an implant. In humans, this corresponds to slightly less than 50% of the distance from the apex18,19. In gerbils, the comparable frequency is 4 kHz, so 4 kHz was chosen as the noise cutoff in the current experiments. Different cut-off frequencies but an otherwise similar protocol can shift the regions of hair cell preservation12. There are obvious differences between the gerbil model and human patients such as the time course of hearing loss, size of cochlear spaces and delicacy of cochlear structures, but at present we are not aware of fundamental differences in anatomy and physiology, which would render the gerbil an invalid model. Another method of inducing high frequency hearing loss while preserving low frequency hearing is exposure to ototoxic chemicals20. While chemical methods are effective, we chose noise exposure because of its reproducibility and flexibility. Using the same exposure regimen we achieved highly reproducible loss of hair cells. In contrast, with the chemical methods the position a transition zone between total hair cell loss and nearly complete preservation was highly variable. In addition, we have previously shown that the location of the transition zone follows the cut-off frequency12. Such control is unlikely to be possible using ototoxic drugs. This property is expected to be particularly useful in experiments where an optimal position for an electrode relative to surviving hair cells is to be tested. In most animals it is difficult to get an electrode beyond the basal turn, so the ability to use different cut-off frequencies to place the transition zone in the basal turn should prove useful.
Electrode Penetrations
Damage to a basal region remote from surviving hair cells is a possible outcome of cochlear implantation. Our experiments were designed to determine if such damage could be detected and if so, identify its extent over the course of an acute recording experiment. In most cases (8 of 11) a rapid decline in CM occurred at or near the maximum depth, followed by a gradual further decline over the course of several hours. In two cases, only gradual loss was observed. In one case no response changes occurred despite clear cochlear damage. In some cases the CM change was paralleled by a change in the CAP, but in others the CAP was unchanged. The relative stability of the CAP may be due to its high degree of saturation at the high intensities used, resulting in a large change in intensity required before a response change occurs. Even with the CM loss, most cases had some residual CM and CAP even at the conclusion of each experiment, which extended for up to eight hours.
The persistence of responses may be related to the degree or location of damage relative to surviving and functional regions of the organ of Corti. With the relatively localized damage restricted to the basal cochlea inflicted-here, it seems that most changes are incomplete since the CM and CAP response to the 1 kHz stimulus is never observed to extinguish completely. Piercing of the BM would have resulted in perilymph and endolymph fluid exchange, which should reduce the endoco chlear potential and over time provide a toxic environment for hair cells. However, due to the limited intracochlear longitudinal flow patterns21, the gradual nature of the response change may be due to limited mixing between base and apex. Long-term results after an injury such as this suggest that the ultimate damage can be limited in its extent22. The results support the conclusion that the intracochlear potentials to acoustic stimuli are robust even with extensive hearing loss, and that changes in the potentials can indicate remote and localized cochlear insults.
Acknowledgements
The authors would like to acknowledge Steven Pulver for the excellent technical assistance.
Support: This work has been supported by NIH, NIDCD, Project #: 5T32DC005360-08 and by MED-EL Corporation, Durham, NC
Footnotes
Publisher's Disclaimer: This is a PDF file of an unedited manuscript that has been accepted for publication. As a service to our customers we are providing this early version of the manuscript. The manuscript will undergo copyediting, typesetting, and review of the resulting proof before it is published in its final citable form. Please note that during the production process errors may be discovered which could affect the content, and all legal disclaimers that apply to the journal pertain.
Presentation: This manuscript will be presented at the 46th Annual Spring Meeting of the American Neurotology Society, April 29-May 1, 2011, Chicago, IL
Animal Research: All animals were handled and housed according to the standards described by the National Institutes of Health Committee on Care and Use of Laboratory Animals, using protocols approved by the Institutional Animal Care and Use Committee (IACUC) at the University of North Carolina at Chapel Hill (ID#: 17443 and 16263).
Conflict of Interest: Dr. Oliver Adunka is a consultant for MED-EL Corporation and receives research support. Dr. Douglas Fitzpatrick receives research support from MED-EL Corporation. Dr. Craig Buchman serves as a consultant for Advanced Bionics, Cochlear Corp., and MED-EL Corporation.
REFERENCES
- 1.Gifford RH, Dorman MF, Shallop JK, Sydlowski SA. Evidence for the expansion of adult cochlear implant candidacy. Ear Hear. 2010;31:186–194. doi: 10.1097/AUD.0b013e3181c6b831. [DOI] [PMC free article] [PubMed] [Google Scholar]
- 2.Cullen RD, Higgins C, Buss E, Clark M, Pillsbury HC, 3rd, Buchman CA. Cochlear implantation in patients with substantial residual hearing. Laryngoscope. 2004;114:2218–2223. doi: 10.1097/01.mlg.0000149462.88327.7f. [DOI] [PubMed] [Google Scholar]
- 3.Hodges AV, Schloffman J, Balkany T. Conservation of residual hearing with cochlear implantation. Am J Otol. 1997;18:179–183. [PubMed] [Google Scholar]
- 4.von Ilberg C, Kiefer J, Tillein J, et al. Electric-acoustic stimulation of the auditory system. New technology for severe hearing loss. ORL J Otorhinolaryngol Relat Spec. 1999;61:334–340. doi: 10.1159/000027695. [DOI] [PubMed] [Google Scholar]
- 5.Gantz BJ, Turner C. Combining acoustic and electrical speech processing: Iowa/Nucleus hybrid implant. Acta Otolaryngol. 2004;124:344–347. doi: 10.1080/00016480410016423. [DOI] [PubMed] [Google Scholar]
- 6.Gstoettner WK, Van De Heyning P, O'Connor AF, et al. Electric acoustic stimulation of the auditory system: results of a multi-centre investigation. Acta Otolaryngol. 2008:1–8. doi: 10.1080/00016480701805471. [DOI] [PubMed] [Google Scholar]
- 7.Turner CW, Gantz BJ, Vidal C, Behrens A, Henry BA. Speech recognition in noise for cochlear implant listeners: benefits of residual acoustic hearing. J Acoust Soc Am. 2004;115:1729–1735. doi: 10.1121/1.1687425. [DOI] [PubMed] [Google Scholar]
- 8.Gstoettner W, Kiefer J, Baumgartner WD, Pok S, Peters S, Adunka O. Hearing preservation in cochlear implantation for electric acoustic stimulation. Acta Otolaryngol. 2004;124:348–352. doi: 10.1080/00016480410016432. [DOI] [PubMed] [Google Scholar]
- 9.Adunka O, Kiefer J, Unkelbach MH, Lehnert T, Gstoettner W. Development and evaluation of an improved cochlear implant electrode design for electric acoustic stimulation. Laryngoscope. 2004;114:1237–1241. doi: 10.1097/00005537-200407000-00018. [DOI] [PubMed] [Google Scholar]
- 10.Adunka OF, Radeloff A, Gstoettner WK, Pillsbury HC, Buchman CA. Scala tympani cochleostomy II: topography and histology. Laryngoscope. 2007;117:2195–2200. doi: 10.1097/MLG.0b013e3181453a53. [DOI] [PubMed] [Google Scholar]
- 11.Viberg A, Canlon B. The guide to plotting a cochleogram. Hear Res. 2004;197:1–10. doi: 10.1016/j.heares.2004.04.016. [DOI] [PubMed] [Google Scholar]
- 12.Suberman TA, Campbell AP, Adunka OF, Buchman CA, Roche JP, Fitzpatrick DC. A Gerbil Model of Sloping Sensorineural Hearing Loss. Otol Neurotol. 2011 doi: 10.1097/MAO.0b013e31821343f5. [DOI] [PMC free article] [PubMed] [Google Scholar]
- 13.Muller M. The cochlear place-frequency map of the adult and developing Mongolian gerbil. Hear Res. 1996;94:148–156. doi: 10.1016/0378-5955(95)00230-8. [DOI] [PubMed] [Google Scholar]
- 14.Mount RJ, Harrison RV, Stanton SG, Nagasawa A. Correlation of cochlear pathology with auditory brainstem and cortical responses in cats with high frequency hearing loss. Scanning Microsc. 1991;5:1105–1112. discussion 1112–1103. [PubMed] [Google Scholar]
- 15.Cheatham MA, Naik K, Dallos P. Using the cochlear microphonic as a tool to evaluate cochlear function in mouse models of hearing. J Assoc Res Otolaryngol. 2011;12:113–125. doi: 10.1007/s10162-010-0240-5. [DOI] [PMC free article] [PubMed] [Google Scholar]
- 16.Gantz BJ, Hansen MR, Turner CW, Oleson JJ, Reiss LA, Parkinson AJ. Hybrid 10 clinical trial: preliminary results. Audiol Neurootol. 2009;14(Suppl 1):32–38. doi: 10.1159/000206493. [DOI] [PMC free article] [PubMed] [Google Scholar]
- 17.Skarzynski H, Lorens A, Piotrowska A, Anderson I. Partial deafness cochlear implantation provides benefit to a new population of individuals with hearing loss. Acta Otolaryngol. 2006;126:934–940. doi: 10.1080/00016480600606632. [DOI] [PubMed] [Google Scholar]
- 18.Otte J, Schunknecht HF, Kerr AG. Ganglion cell populations in normal and pathological human cochleae. Implications for cochlear implantation. Laryngoscope. 1978;88:1231–1246. doi: 10.1288/00005537-197808000-00004. [DOI] [PubMed] [Google Scholar]
- 19.Greenwood DD. A cochlear frequency-position function for several species--29 years later. J Acoust Soc Am. 1990;87:2592–2605. doi: 10.1121/1.399052. [DOI] [PubMed] [Google Scholar]
- 20.Stronks HC, Versnel H, Prijs VF, Grolman W, Klis SF. Effects of electrical stimulation on the acoustically evoked auditory-nerve response in guinea pigs with a high-frequency hearing loss. Hear Res. 2011;272:95–107. doi: 10.1016/j.heares.2010.10.012. [DOI] [PubMed] [Google Scholar]
- 21.Salt AN, DeMott JE. Longitudinal endolymph movements induced by perilymphatic injections. Hear Res. 1998;123:137–147. doi: 10.1016/s0378-5955(98)00106-3. [DOI] [PubMed] [Google Scholar]
- 22.Rajan R, Irvine DR. Absence of plasticity of the frequency map in dorsal cochlear nucleus of adult cats after unilateral partial cochlear lesions. J Comp Neurol. 1998;399:35–46. [PubMed] [Google Scholar]


