

Abstract
Protein synthesis by ribosomes takes place on a linear substrate but at variable speeds. Transient pausing of ribosomes can impact a variety of co-translational processes, including protein targeting and folding1. These pauses are influenced by the sequence of the mRNA2. Thus redundancy in the genetic code allows the same protein to be translated at different rates. However, our knowledge of both the position and the mechanism of translational pausing in vivo is highly limited. Here we present a genome-wide analysis of translational pausing in bacteria using ribosome profiling–deep sequencing of ribosome-protected mRNA fragments3-5. This approach enables high-resolution measurement of ribosome density profiles along most transcripts at unperturbed, endogenous expression levels. Unexpectedly, we found that codons decoded by rare tRNAs do not lead to slow translation under nutrient-rich conditions. Instead, Shine-Dalgarno-(SD)6 like features within coding sequences cause pervasive translational pausing. Using an orthogonal ribosome7,8 possessing an altered anti-SD sequence, we demonstrated that pausing is due to hybridization between mRNA and the 16S rRNA of the translating ribosome. In protein coding sequences, internal SD sequences are disfavoured, which leads to biased usage, avoiding codons and codon pairs that resemble canonical SD sites. Our results indicate that internal SD-like sequences are a major determinant of translation rates and a global driving force for the coding of bacterial genomes.
Our current understanding of sequence-dependent translation rates in vivo derives largely from pioneering work begun in the 1980s9-13. These studies, which measured protein synthesis time using pulse labelling, established that different mRNAs could be translated with different elongation rates. In particular, messages decoded by rare tRNAs were translated slowly, although this effect was exaggerated by the over-expression of mRNA, which can lead to depletion of available tRNAs10. Interestingly, even with fixed tRNA usage, different synonymously coded mRNAs were translated at different rates13. This result, together with the observation of biased occurrence of adjacent codon pairs14, argued that tRNA abundance is not the only determinant of elongation rates. However, further investigations into what determines the rate of translation in vivo have been hampered by the limited temporal and positional resolution of existing techniques.
To provide a high-resolution view of local translation rates, we used the recently developed ribosome profiling strategy3-5 to map ribosome occupancy along each mRNA (Fig. S1). We focused on two distantly related bacterial species, the Gram-negative bacterium Escherichia coli and the Gram-positive bacterium Bacillus subtilis. To preserve the state of translation, cells were flash frozen in liquid nitrogen after the rapid filtration of log phase cultures. We prepared the ribosome footprints by lysis and nuclease digestion in the presence of translation elongation inhibitors (see Methods). These steps ensured that the majority of ribosomes were in polysomes after lysis and stayed as assembled 70S particles during digestion (Fig. S2). After deep sequencing, 2,257 genes (E. coli) and 1,580 genes (B. subtilis) had an average coverage of at least 10 sequencing reads per codon. The observed variability of ribosome footprint profiles across individual genes was highly reproducible (r = 0.99 between biological replicates, Fig. S3).
Several observations argued that the ribosome transit time is proportional to the occupancy at each position. First, we observed negligible internal initiation and early termination associated with ribosome pause sites (Fig. S4). Second, ribosomes stayed intact during footprinting, and the majority of ribosome-protected fragments were captured (Fig. S2). Third, the variability introduced during the conversion of RNA fragments into a sequenceable DNA library contributed minimally to our measures of variability in ribosome occupancy (Fig. S5).
With our genome-wide view of local translation rates, we confirmed the widely studied peptide-mediated pausing sites in the secM15 and tnaC16 genes in E. coli and the mifM gene17 in B. subtilis (Fig. 1a and S6). Strikingly, in addition to these known pausing sites, the observed ribosome occupancy is highly variable across coding regions, as illustrated for secA in Fig. 1a. Ribosome density often reaches more than 10-times the mean density and the vast majority of these translational pauses are uncharacterized.
Fig. 1.

Analysis of translational pausing using ribosome profiling in bacteria. a, Validation of the ribosome stalling site in the secM mRNA. b and c, Average ribosome occupancy of each codon relative to their respective tRNA abundance measured by Dong et al18. For growth in Luria broth (b), elevated occupancy at serine codons (blue) likely reflects preferential depletion of this amino acid. In glucose-rich medium (c), the ribosome occupancy is independent of tRNA abundance. d, Plot of cross-correlation function between ribosome occupancy profiles and the presence of the indicated tri-nucleotide sequences.
We first asked whether the identity of the codon being decoded could account for the differences in local translation rates by examining the average ribosome occupancy for each of the 61 codons in the ribosomal A-site. Surprisingly, there is little correlation between the average occupancy of a codon and the existing measurements of the abundance of corresponding tRNAs18 (Fig. 1b, c and S7). Most notably, the six serine codons have the highest ribosome occupancy for E. coli cultured in Luria broth (Fig. 1b). Because serine is the first amino acid to be catabolised by E. coli when sugar is absent19,20, we reasoned that the increased ribosome occupancy might be due to limited serine supply. Indeed, serine associated pauses were greatly reduced in glucose-supplemented MOPS medium (Fig. 1c). The increase of serine codon occupancy when glucose becomes limiting confirmed our ability to capture translation rates at each codon. However, the identity of the A-site codon, which had less than a 2-fold effect on ribosome occupancy (Fig. 1c), cannot account for the large variability in ribosome density along messages.
What then are the sequence features that cause slow translation? Without a priori knowledge about where such features would be located relative to the ribosomal A-site, we calculated the cross-correlation function between intragenic ribosome occupancy profiles and the presence of a given tri-nucleotide sequence on the mRNA independent of reading frames. Strong correlation was observed for six tri-nucleotide sequences (Fig. 1d) which resemble features found in Shine-Dalgarno (SD) sequences. Importantly, the highest correlation occurs when the SD-like feature is 8-11 bases upstream from the position occupied by the ribosomal A-site. This spacing coincides with the optimal spacing for ribosome binding at start codons21. However, unlike canonical SD sites, which enable initiation of translation, the observed pauses were associated with SD-like features within the body of coding regions. The accumulation of ribosomes at internal SD-like sequences was observed across two divergent phyla of bacteria (Fig. 2a), suggesting that the phenomenon occurs generally in bacteria. The same correlation was not observed for the budding yeast S. cerevisiae, whose ribosomes, like other eukaryotes, do not contain an anti-SD (aSD) site.
Fig. 2.
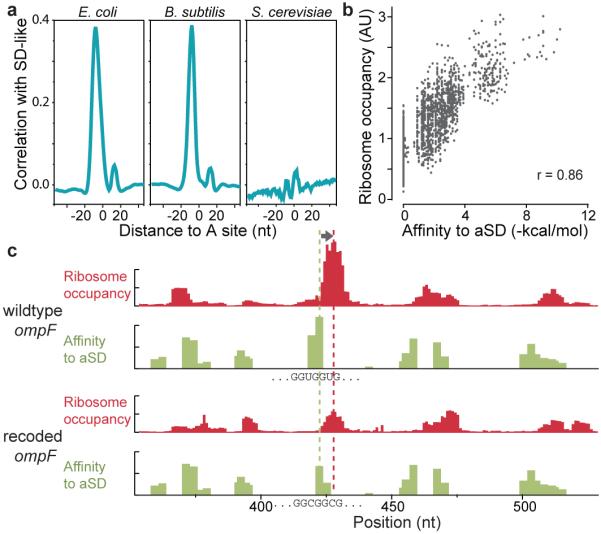
Relationship between ribosome pausing and internal Shine-Dalgarno sequences. a, Plot of correlation between ribosome occupancy and SD-like features for E. coli, B. subtilis, and Saccharomyces cerevisiae. b, Plot of the average ribosome occupancy of hexanucleotide sequences relative to their affinity to the anti-Shine-Dalgarno sequence. c, Re-programmed pausing by recoding the ompF mRNA. Ribosome occupancy (red) increases when the A-site is 8-11 downstream (arrow) from SD-like features (green). Synonymous mutations replacing the SD-like sequence (GGUGGUG) in wildtype ompF (top) with a sequence (GGCGGCG) with lower hybridization to the SD site (bottom) caused a corresponding decrease in ribosome pausing.
As predicted by a model in which the interaction between mRNA and the aSD site of the 16S rRNA is the source of pausing, the predicted hybridization free energy of a hexanucleotide to the aSD sequence is a strong predictor of its average downstream ribosome occupancy (Fig. 2b). Furthermore, there is a clear correspondence on individual transcripts between SD-like sequences and pauses. For example, Fig. 2c shows that in ompF, individual SD-like features are associated with elevated ribosome occupancy 8-11 nucleotides downstream. Moreover, a synonymous mutation (GGUGGU to GGCGGC) that reduced the affinity to the aSD site led to reduced ribosome occupancy specifically at the mutated sequence, arguing for a causal relationship between the SD-like feature and the excess ribosome density.
We next sought to evaluate directly whether the excess footprint density seen at internal SD-like sequences was due to pausing of elongating ribosomes rather than attempted internal initiation, driven by SD-aSD interactions (Fig. 3a). To distinguish between these possibilities, we used a previously described orthogonal ribosome (O-ribosome) strategy in which a mutant form of the 16S rRNA with an altered aSD site is coexpressed with WT 16S rRNA8. O-ribosomes containing the mutant 16S RNA will only translate a target mRNA that has the corresponding orthogonal SD (O-SD) sequence before its start codon. Conversely, a message whose translation is driven by the O-SD sequence will only be translated by O-ribosomes, and not by wildtype ribosomes. This system thus allows one to determine the source of regions of excess ribosome footprints, as elongating O-ribosomes would pause at internal O-SD sequences, whereas attempted internal initiation would still occur at SD sequences due to the cellular pool of wildtype ribosomes.
Fig. 3.

Pausing of elongating ribosomes due to SD-aSD interaction. a, Two models could account for the excess ribosome density at internal SD-like sequences. b, Ribosome occupancy of lacZ mRNA translated by wildtype ribosome. Like other genes translated by the wildtype ribosome, the ribosome occupancy pattern along lacZ is correlated with the presence of SD-like sequences (left), and not with the orthogonal SD sequence (O-SD, right). c, Ribosome occupancy of lacZ mRNA translated by orthogonal ribosome (O-ribosome). Unlike other genes in the same cells, the specialized O-SD-lacZ has ribosome pausing at internal O-SD-like sequences (right), and not at SD-like sites (left).
We compared the ribosome occupancy profiles of a lacZ message that was translated by either O-ribosomes or wildtype ribosomes. Importantly, the occupancy profile of the lacZ message exclusively translated by O-ribosomes was correlated with O-SD-like features, and not with SD-like features (Fig. 3c). This is in marked contrast with the same lacZ sequence translated by wildtype ribosomes (Fig. 3b). As an internal control in the O-ribosomes expressing cells, all other genes, which are translated by wildtype ribosomes, still maintained SD-correlated ribosome occupancy profiles (Fig. 3c). These observations established that elongating ribosomes stall during protein synthesis and that hybridization between the aSD site in the elongating ribosome and internal SD-like sequences gives rise to these pauses.
Global analysis of pause sites revealed that internal SD-like sequences are the dominant feature controlling translation stalling: ~70% of the strong pauses (i.e. those that have ribosome occupancies >10-fold over the mean) are associated with SD sites (Fig. S8). Although the interaction between internal SD sequences in a message and elongating ribosomes has been documented in specialized cases, including promoting frameshift in vivo22,23 and ribosome stalling in single molecule experiments in vitro24, there was little indication that internal SD-like sequences are the major determinant of translation elongation rate.
Because translational pausing limits the amount of free ribosomes available for initiating protein synthesis, wide-spread internal SD-like sequences could reduce bacterial growth rates. Accordingly, we found that strong SD-like sequences are generally avoided in the coding region of E. coli genes: hexamer sequences that strongly bind aSD sites are universally rare, whereas low-affinity hexamers have variable rates of occurrence (Fig. 4a). Consistent with translational pausing being the driving force for this bias, depletion of SD-like sequences is observed only in protein coding genes, and not in rRNA and tRNA coding genes (Fig. S9). The selection against SD-like features in turn impacts both synonymous codon choice and codon-pair choice. At the codon level, SD-like codons GAG, AGG, and GGG are all minor codons in E. coli and B. subtilis. The evolutionary origin of codon selection is often attributed to differences in tRNA abundance2,25 because its level correlate with codon usage18. Instead, we propose that SD-like codons are disfavoured due to their interactions with rRNA, and that tRNA expression levels followed codon adaptation.
Fig. 4.

Selection against SD-like sequences and the constraint on protein coding. a, Rate of occurrence of hexanucleotide sequences in E. coli messages relative to their affinity to the anti-SD site. The orange line shows the average occurrence within a bin size of 0.5 kcal/mol. b, Occurrence of codon-pairs for glycine-glycine residues relative to their affinity to the anti-SD site. The color coding represents the enrichment in occurrence of codon pairs after correcting for the usage of single codons. c, Cross-correlation function of ribosome occupancy profiles between conserved genes in E. coli and B. subtilis. Zero offset means the two sequences are aligned at each amino acid residue.
At the codon-pair level, we can now account for the selection against two consecutive codons that resemble SD sequences. This is illustrated for Gly-Gly pairs, which are coded by GGNGGN sequences (Fig. 4b). The most abundant Gly-Gly coding sequence, GGCGGC, has the lowest affinity to the aSD sequence, whereas Gly-Gly coding sequences that strongly resemble SD sites, including GGAGGU which perfectly complements the aSD site, rarely appear. This disenrichment holds even after correction for the usage of individual codons (Fig. 4b, color coding), for example GGAGGU is considerably less common than GGUGGA. Other amino acid pairs that can be coded with strong SD sites also showed the same bias (Fig. S10). Notably, the preference in codon pairs stems from the sequence identity and not the codon identity, as the same trend is seen in hexamers that are not aligned to codon pairs (Fig. S11). Although not every bias in codon-pair usage can be explained here, the disadvantage associated with SD-induced translational pausing offers a clear mechanistic view of why certain codon pairs are avoided.
Despite the selection against internal SD-like sequences, they remain a major driving force for translational pausing. Additionally, we found similar pausing patterns between conserved genes in E. coli and B. subtilis (Fig. 4c). For an mRNA encoding a specific protein, it may not be possible to fully eliminate sequences with affinity to the aSD site without changing the peptide sequence. For example, in the case of Gly-Gly, even the GGCGGC pair has substantial affinity to the aSD site. The optimization for translation rate therefore cannot be achieved only at the level of mRNA coding, but also with the consideration of having functional peptide sequence.
The observation that the ability of elongating ribosomes to interact with SD-like sequences is highly conserved suggests that this mechanism of pausing is exploited for functional purposes. Indeed, a highly conserved internal SD site exists in the gene encoding peptide chain release factor 2 (RF2)26. This sequence has an important function in promoting a translational frameshift, which is involved in its auto-regulatory gene expression. In addition, pausing at internal SD-like sites could modulate co-translational folding of the nascent peptide chain (Fig. S12). Finally, given the coupling between transcription and translation in bacteria27,28, pausing at SD sites could play a role in transcriptional regulation. We observed internal SD sites and pausing near the stop codon of transcription attenuation leader peptides29, including trpL and thrL (Fig. S13). In contrast to ribosome stalling at regulatory codons during starvation, slow translation near the stop codon could protect alternative structural mRNA elements to prevent formation of anti-termination stem-loops, thereby assuring proper transcription termination30. Our approach and the genome-wide data lay the groundwork for further gene-specific functional studies of translational pausing.
From a more practical perspective, ribosome pausing at internal SD sites presents both a challenge and an opportunity for heterologous protein expression in bacteria. Over-expression of eukaryotic proteins with strong internal SD sites would sequester ribosomes and compromise protein yield. Internal SD sequences could be reduced by re-coding the gene, which has not been considered in conventional strategies of simple codon optimization or over expression of rare tRNAs. Conversely, re-coding can introduce internal SD sites if pausing is required for co-translational processing. Positioning of internal SD sites therefore adds another dimension to the optimization of heterologous protein expression.
Methods Summary
E. coli MG1655 and B. Subtilis 168 were used as wildtype strains. E. coli BJW9 has synonymous substitutions at G141 and G142 in the ompF gene. The orthogonal ribosome experiment was performed in E. coli BW25113 with two plasmids: pSC101-G9, expressing orthogonal 16S rRNA, and pJW1422, expressing O-SD-lacZ mRNA. pSC101-G9 was a gift from Dr. Jason Chin8. pJW1422 has lacZ driven from a tacII promoter and an O-ribosome binding site AUCCCA. Luria broth was used for B. subtilis culture. Cell cultures were harvested at OD600 between 0.3 and 0.4. Flash freezing and ribosome footprinting was previously described5. 3 mM 5′-Guanylyl imidodiphosphate was added to the lysate before thawing and during footprinting to prevent post lysis translation. Conversion of mRNA footprints to cDNA library generation was previously described4,5. Deep sequencing was performed on Illumina HiSeq 2000, and the results were aligned to reference genomes using Bowtie v.0.12.0. Cross-correlation function is defined as for series X=x1,x2,…,xN and Y=y1,y2,…,yN, where μX and σX are the average and the standard deviation of series X, respectively.
Methods
Strains, plasmids, and growth conditions
E. coli K-12 MG1655 and B. Subtilis 168 were used as wildtype strains. E. coli BJW9 with recoded ompF (GGT to GGC synonymous substitutions at G141 and G142) at the endogenous locus was constructed using lambda-Red recombination31 in MG1655. The orthogonal ribosome experiment was performed in E. coli BW25113, which is a K-12 derived strain with a lacZ deletion31.
Plasmid pSC101-G9, a gift from Dr. Jason Chin, expresses orthogonal 16S rRNA from an intact rrnB operon except that the 3′ end of rrsB, which codes for the 16S rRNA, was changed from CCTCCTTA to TGGGATTA8. Plasmid pJW1422 harbors the lacZ gene with a tacII promoter. The ribosome binding site of the lacZ mRNA is replaced with AUCCCA, thus allowing translation initiation by orthogonal ribosomes.
Unless otherwise noted, E. coli strains were grown in MOPS medium supplemented with 0.2% glucose, 20 amino acids, vitamins, bases, and micronutrients as described by Neidhardt et al.32 (Teknova). B. subtilis was grown in Luria broth (LB, BD Difco). For the strain containing pSC101-G9 and pJW1442, the medium was supplemented with 25 μg/ml kanamycin and 15 μg/ml tetracycline. For experiments with E. coli, an overnight liquid culture was diluted 400-fold into fresh medium. For experiments with B. subtilis, an overnight culture on LB plate was washed and diluted to OD600 = 0.00125 in LB. Cell cultures were grown at 37°C until OD600 reached 0.3-0.4.
Ribosome profiling
The protocol for bacterial ribosome profiling with flash freezing was described in detail by Oh et al.5. 200 ml of cell culture was rapidly filtered by passing through a pre-warmed nitrocellulose filter with 200 nm pore size. Cell pellet was flash frozen in liquid nitrogen, and combined with 650 ul of frozen lysis buffer (10 mM MgCl2, 100 mM NH4Cl, 20 mM Tris pH 8.0, 0.1% NP-40, 0.4% Triton X-100, 100 U/ml DNase I, 0.5 U/μl Superase-In, 1 mM chloramphenicol, and 3 mM 5′-Guanylyl imidodiphosphate (GMPPNP)). Addition of GMPPNP together with chloramphenicol inhibits post lysis translation. Cells were pulverized in 10 ml canisters pre-chilled in liquid nitrogen. Lysate containing 0.5 mg of RNA was digested with 750 U of micrococcal nuclease at 25°C for 1 hr. The ribosome-protected fragments were isolated using sucrose gradient and phenol extraction. The footprints were ligated to a 5′ adenylated and 3′-end blocked DNA oligo (/5rApp/CTGTAGGCACCATCAAT/3ddc, Integrated DNA Technologies)4,5. Unless otherwise noted, the ligation was carried out using truncated T4 RNA ligase 2 (New England Biolabs) as previously described4,5. To remove lot-to-lot difference in the activity from the commercial source, we have recently switched to recombinantly expressed truncated T4 RNA ligase 2 K227Q produced in our laboratory. We used this ligase to generate library for the high coverage dataset for E. coli. The 3′ ligated RNA fragments were converted to sequenceable DNA library using reverse transcription, circularization, and PCR amplification as previously described4,5.
Sequencing was performed on an Illumina HiSeq 2000. Sequence alignment using Bowtie v. 0.12.0 mapped the footprint data to the reference genomes NC_000913.fna (E. coli) or NC_000964.fna (B. subtilis) obtained from NCBI Reference Sequence Bank. The data from BJW9 was aligned to a reference modified from NC_000913.fna. The footprint reads vary between 25 to 42 nucleotides in length, mostly due to the specificity of micrococcal nuclease. In contrast to eukaryotic systems where the 5′ end of the footprint is sufficient to carry the positional information3,4, here we distribute the positional information into several nucleotides in the center of the footprint5. For each footprint read, the center residues that are at least 12 nucleotides away from either ends were given the same score, which is weighted by the length of the fragment. The data is available from Gene Expression Omnibus with accession code GSE35641.
To assign the A-site position to the center of ribosome footprints, we made use of the ribosome density at two independent sets of well-defined pause sites. The first set consists of pausing at stop codons5, where the ribosomal A-site is aligned to stop codons prior to binding of release factors. The second set consists of peptide-mediated ribosome stalling sites, where the A-site codons have been identified. These two alignments were consistent with each other. Additionally, the pausing at serine codons at the A-site during starvation confirmed the position assignment of ribosome footprints.
mRNA sequencing
Total RNA was phenol extracted from the same lysate that was used for ribosome footprinting5. Ribosomal RNA and small RNA was removed from the total RNA using MICROBExpress and MEGAclear from Ambion, respectively. mRNA was randomly fragmented as described by Ingolia et al.4. The fragmented mRNA sample was converted to cDNA library using the same strategy for ribosome footprints, and was previously described by Oh et al.5.
Data analysis
Data analysis was performed using scripts written for Python 2.6.6. Global pausing analyses were based on 2,257 genes (E. coli) and 1,580 genes (B. subtilis) that have an average coverage of at least 10 sequencing reads per codon in the ribosome profiling dataset. In addition, analyses on 997 genes in E. coli and 1,189 genes in B. subtilis with an coverage between 1 and 10 sequencing reads per codon showed qualitatively consistent results. For E. coli, tufA and tufB genes were not included in the analysis because of their sequence homology with each other. Genes with known frameshifting sites (prfB and dnaX) were not included in codon-specific analyses. On gene-specific analyses, the coverage was at least 30 sequencing reads per codon in each case.
To focus on the kinetics of translation elongation, the analysis was performed based on ribosome occupancy profiles within protein coding genes, excluding the first 10 codons and the last 10 codons. To calculate the average ribosome occupancy associated with each codon at the A site, the ribosome occupancy profile of each gene is normalized by the mean occupancy of the gene, and the normalized occupancy for each codon was averaged across all genes. Similarly, the average ribosome occupancy for each hexanucleotide at the SD position was calculated by averaging normalized occupancy at between 7 to 12 nucleotide downstream from the hexanucleotide sequence. For each codon, the corresponding tRNA abundance plotted in Fig. 1 and S7 is the sum of the expression levels of the cognate tRNA species measure in references18,33.
To identify dominating sequence features either upstream or downstream from the pausing sites, we slid the ribosome occupancy profile (X=x1,x2,…,xN) along the coding sequence and, at every offset position i, calculated the correlation with the presence of a given sequence (Y=y1,y2,…,yN). In mathematical terms it is given by the normalized cross-correlation function (Ci):
where μX and μY are the average of the series X and Y, respectively. σX and σY are the standard deviation of the series X and Y, respectively. ⟨xj+iyj⟩ is the expectation value of xj+iyj for all possible values of j. We used Python to calculate ∑xj+iyj using the ‘correlate’ function in the ‘same’ mode in the numpy package. The expectation value is obtained by dividing the summation by N-∣i∣. For each gene with >10 sequencing reads/codon and >160 basepairs long, we calculated the normalized cross-correlation function. The average over these cross-correlation functions is presented in this paper.
Hybridization free energy prediction
The hybridization free energy between mRNA and the aSD site was predicted using the RNAsubopt program in the Vienna RNA package34. The energy was predicted for 37°C with contribution from dangling ends. For each hexanucleotide sequence, the lowest possible hybridization free energy was assigned as its affinity to the aSD site. We used the 8-nucleotide sequence CACCUCCU as the aSD sequence. To calculate the cross-correlation function between ribosome occupancy profile and SD-like features, we built the aSD affinity profile for each mRNA by scanning the transcript in overlapping units of 10 nucleotides and calculating the affinity of aSD to the middle 8 nucleotides. The affinity was assigned to the 8th position in the 10 nucleotide window, which corresponds to U in the canonical SD sequence. The distance from the P-site to U in the canonical SD sequence is often defined as the aligned spacing21. Because we align ribosome footprints to the A-site, the distance reported here is 3 nucleotides longer than the aligned spacing.
Analysis of O-ribosome translated messages
Because a lacZ message whose translation is driven by O-SD is exclusively translated by O-ribosomes8, the translational pausing model outlined in Fig. 3a predicts that for the O-SD driven lacZ there will be both the appearance of new ribosome density peaks at internal sites that resemble the O-SD sequence and the disappearance of peaks at the SD-like sequences found when translation is driven by wildtype SD sequence. This prediction is confirmed by our data in Fig. 3c: the ribosome occupancy profile of lacZ with O-SD-driven translation no longer shows a correlation with SD-like sequences, and instead is correlated with O-SD-like sequences. Moreover, because the endogenous messages are still translated solely by wildtype ribosomes even when the O-ribosome is present, the ribosome peaks in the endogenous messages are found at SD-like sequences and not sequences that resemble the O-SD site regardless of whether O-ribosomes are present. This is again confirmed by the data shown in Fig. 3c.
Conservation analysis
Conservation analysis of pausing patterns in E. coli and B. subtilis was carried out in a set of 31 proteins from the curated alignment database AMPHORA35. The nucleotide sequences and the ribosome density profiles were trimmed and concatenated based on the protein alignment. The cross-correlation function between E. coli and B. subtilis ribosome occupancy was calculated for each gene, and then averaged over 31 genes to give the conservation of pausing patterns.
Occurrence of hexamers and codon pairs
The occurrence of hexamers and codon pairs was counted from annotated protein coding genes available from the NCBI Reference Sequence Bank. Normalized occurrence (pi,j) was calculated by dividing the occurrence of a given codon pair (i and j) by the total occurrence of the corresponding amino acid pair. The correction for the usage of single codons was calculated by dividing the normalized occurrence of the codon pair (pi,j) by the frequency of the two individual codons (qi and qj), i.e. enrichment = pi,j/qiqj. The frequency of individual codons is normalized to the occurrence of the corresponding amino acid.
Protein structure analysis
Protein secondary structure was predicted using the PSIPRED method36, with the filtered reference database UniRef9037. Secondary structures were predicted for 271 proteins. Cross-correlation function between the structural assignment with either ribosome occupancy or SD-like features was calculated at the nucleotide level.
Supplementary Material
Acknowledgements
We thank E. Reuman, D. Burkhardt, C. Jan, C. Gross, and J. Elf for discussions; J. Dunn for ribosome profiling data on S. cerevisiae; C. Chu for help with sequencing. J. Chin for orthogonal ribosome reagents and advice. This research was supported by the Helen Hay Whitney Foundation (to G.W.L.) and by the Howard Hughes Medical Institute (to J.S.W.)
Footnotes
Author Contributions G.W.L. and J.S.W. designed the experiments. G.W.L. performed experiments and analyzed the data. E.O. provided technical support and preliminary data. G.W.L. and J.S.W. wrote the manuscript.
Author Information The authors declared no competing financial interests.
The footprint sequencing data have been deposited in the Gene Expression Omnibus (GEO), accession number (GSE35641).
References
- 1.Kramer G, Boehringer D, Ban N, Bukau B. The ribosome as a platform for co-translational processing, folding and targeting of newly synthesized proteins. Nat Struct Mol Biol. 2009;16:589–597. doi: 10.1038/nsmb.1614. [DOI] [PubMed] [Google Scholar]
- 2.Plotkin JB, Kudla G. Synonymous but not the same: the causes and consequences of codon bias. Nat Rev Genet. 2011;12:32–42. doi: 10.1038/nrg2899. [DOI] [PMC free article] [PubMed] [Google Scholar]
- 3.Ingolia NT, Ghaemmaghami S, Newman JR, Weissman JS. Genome-wide analysis in vivo of translation with nucleotide resolution using ribosome profiling. Science. 2009;324:218–223. doi: 10.1126/science.1168978. [DOI] [PMC free article] [PubMed] [Google Scholar]
- 4.Ingolia NT, Lareau LF, Weissman JS. Ribosome profiling of mouse embryonic stem cells reveals the complexity and dynamics of Mammalian proteomes. Cell. 2011;147:789–802. doi: 10.1016/j.cell.2011.10.002. [DOI] [PMC free article] [PubMed] [Google Scholar]
- 5.Oh E, et al. Selective ribosome profiling reveals the cotranslational chaperone action of trigger factor in vivo. Cell. 2011;147:1295–1308. doi: 10.1016/j.cell.2011.10.044. [DOI] [PMC free article] [PubMed] [Google Scholar]
- 6.Shine J, Dalgarno L. The 3′-terminal sequence of Escherichia coli 16S ribosomal RNA: complementarity to nonsense triplets and ribosome binding sites. Proc Natl Acad Sci U S A. 1974;71:1342–1346. doi: 10.1073/pnas.71.4.1342. [DOI] [PMC free article] [PubMed] [Google Scholar]
- 7.Hui A, de Boer HA. Specialized ribosome system: preferential translation of a single mRNA species by a subpopulation of mutated ribosomes in Escherichia coli. Proc Natl Acad Sci U S A. 1987;84:4762–4766. doi: 10.1073/pnas.84.14.4762. [DOI] [PMC free article] [PubMed] [Google Scholar]
- 8.Rackham O, Chin JW. A network of orthogonal ribosome x mRNA pairs. Nat Chem Biol. 2005;1:159–166. doi: 10.1038/nchembio719. [DOI] [PubMed] [Google Scholar]
- 9.Varenne S, Buc J, Lloubes R, Lazdunski C. Translation is a non-uniform process. Effect of tRNA availability on the rate of elongation of nascent polypeptide chains. J Mol Biol. 1984;180:549–576. doi: 10.1016/0022-2836(84)90027-5. [DOI] [PubMed] [Google Scholar]
- 10.Pedersen S. Escherichia coli ribosomes translate in vivo with variable rate. EMBO J. 1984;3:2895–2898. doi: 10.1002/j.1460-2075.1984.tb02227.x. [DOI] [PMC free article] [PubMed] [Google Scholar]
- 11.Sorensen MA, Kurland CG, Pedersen S. Codon usage determines translation rate in Escherichia coli. J Mol Biol. 1989;207:365–377. doi: 10.1016/0022-2836(89)90260-x. [DOI] [PubMed] [Google Scholar]
- 12.Andersson SG, Kurland CG. Codon preferences in free-living microorganisms. Microbiol Rev. 1990;54:198–210. doi: 10.1128/mr.54.2.198-210.1990. [DOI] [PMC free article] [PubMed] [Google Scholar]
- 13.Sorensen MA, Pedersen S. Absolute in vivo translation rates of individual codons in Escherichia coli. The two glutamic acid codons GAA and GAG are translated with a threefold difference in rate. J Mol Biol. 1991;222:265–280. doi: 10.1016/0022-2836(91)90211-n. [DOI] [PubMed] [Google Scholar]
- 14.Gutman GA, Hatfield GW. Nonrandom utilization of codon pairs in Escherichia coli. Proc Natl Acad Sci U S A. 1989;86:3699–3703. doi: 10.1073/pnas.86.10.3699. [DOI] [PMC free article] [PubMed] [Google Scholar]
- 15.Nakatogawa H, Ito K. The ribosomal exit tunnel functions as a discriminating gate. Cell. 2002;108:629–636. doi: 10.1016/s0092-8674(02)00649-9. [DOI] [PubMed] [Google Scholar]
- 16.Gong F, Yanofsky C. Instruction of translating ribosome by nascent peptide. Science. 2002;297:1864–1867. doi: 10.1126/science.1073997. [DOI] [PubMed] [Google Scholar]
- 17.Chiba S, et al. Recruitment of a species-specific translational arrest module to monitor different cellular processes. Proc Natl Acad Sci U S A. 2011;108:6073–6078. doi: 10.1073/pnas.1018343108. [DOI] [PMC free article] [PubMed] [Google Scholar]
- 18.Dong H, Nilsson L, Kurland CG. Co-variation of tRNA abundance and codon usage in Escherichia coli at different growth rates. J Mol Biol. 1996;260:649–663. doi: 10.1006/jmbi.1996.0428. [DOI] [PubMed] [Google Scholar]
- 19.Pruss BM, Nelms JM, Park C, Wolfe AJ. Mutations in NADH:ubiquinone oxidoreductase of Escherichia coli affect growth on mixed amino acids. J Bacteriol. 1994;176:2143–2150. doi: 10.1128/jb.176.8.2143-2150.1994. [DOI] [PMC free article] [PubMed] [Google Scholar]
- 20.Sezonov G, Joseleau-Petit D, D’Ari R. Escherichia coli physiology in Luria-Bertani broth. J Bacteriol. 2007;189:8746–8749. doi: 10.1128/JB.01368-07. [DOI] [PMC free article] [PubMed] [Google Scholar]
- 21.Chen H, Bjerknes M, Kumar R, Jay E. Determination of the optimal aligned spacing between the Shine-Dalgarno sequence and the translation initiation codon of Escherichia coli mRNAs. Nucleic Acids Res. 1994;22:4953–4957. doi: 10.1093/nar/22.23.4953. [DOI] [PMC free article] [PubMed] [Google Scholar]
- 22.Weiss RB, Dunn DM, Dahlberg AE, Atkins JF, Gesteland RF. Reading frame switch caused by base-pair formation between the 3′ end of 16S rRNA and the mRNA during elongation of protein synthesis in Escherichia coli. EMBO J. 1988;7:1503–1507. doi: 10.1002/j.1460-2075.1988.tb02969.x. [DOI] [PMC free article] [PubMed] [Google Scholar]
- 23.Larsen B, Wills NM, Gesteland RF, Atkins JF. rRNA-mRNA base pairing stimulates a programmed -1 ribosomal frameshift. J Bacteriol. 1994;176:6842–6851. doi: 10.1128/jb.176.22.6842-6851.1994. [DOI] [PMC free article] [PubMed] [Google Scholar]
- 24.Wen JD, et al. Following translation by single ribosomes one codon at a time. Nature. 2008;452:598–603. doi: 10.1038/nature06716. [DOI] [PMC free article] [PubMed] [Google Scholar]
- 25.Ikemura T. Correlation between the abundance of Escherichia coli transfer RNAs and the occurrence of the respective codons in its protein genes: a proposal for a synonymous codon choice that is optimal for the E. coli translational system. J Mol Biol. 1981;151:389–409. doi: 10.1016/0022-2836(81)90003-6. [DOI] [PubMed] [Google Scholar]
- 26.Baranov PV, Gesteland RF, Atkins JF. Release factor 2 frameshifting sites in different bacteria. EMBO Rep. 2002;3:373–377. doi: 10.1093/embo-reports/kvf065. [DOI] [PMC free article] [PubMed] [Google Scholar]
- 27.Burmann BM, et al. A NusE:NusG complex links transcription and translation. Science. 2010;328:501–504. doi: 10.1126/science.1184953. [DOI] [PubMed] [Google Scholar]
- 28.Proshkin S, Rahmouni AR, Mironov A, Nudler E. Cooperation between translating ribosomes and RNA polymerase in transcription elongation. Science. 2010;328:504–508. doi: 10.1126/science.1184939. [DOI] [PMC free article] [PubMed] [Google Scholar]
- 29.Kolter R, Yanofsky C. Attenuation in amino acid biosynthetic operons. Annu Rev Genet. 1982;16:113–134. doi: 10.1146/annurev.ge.16.120182.000553. [DOI] [PubMed] [Google Scholar]
- 30.Elf J, Ehrenberg M. What makes ribosome-mediated transcriptional attenuation sensitive to amino acid limitation. PLoS Comput Biol. 2005;1:e2. doi: 10.1371/journal.pcbi.0010002. [DOI] [PMC free article] [PubMed] [Google Scholar]
Additional references
- 31.Datsenko KA, Wanner BL. One-step inactivation of chromosomal genes in Escherichia coli K-12 using PCR products. Proc Natl Acad Sci U S A. 2000;97:6640–6645. doi: 10.1073/pnas.120163297. [DOI] [PMC free article] [PubMed] [Google Scholar]
- 32.Neidhardt FC, Bloch PL, Smith DF. Culture medium for enterobacteria. J Bacteriol. 1974;119:736–747. doi: 10.1128/jb.119.3.736-747.1974. [DOI] [PMC free article] [PubMed] [Google Scholar]
- 33.Kanaya S, Yamada Y, Kudo Y, Ikemura T. Studies of codon usage and tRNA genes of 18 unicellular organisms and quantification of Bacillus subtilis tRNAs: gene expression level and species-specific diversity of codon usage based on multivariate analysis. Gene. 1999;238:143–155. doi: 10.1016/s0378-1119(99)00225-5. [DOI] [PubMed] [Google Scholar]
- 34.Gruber AR, Lorenz R, Bernhart SH, Neubock R, Hofacker IL. The Vienna RNA websuite. Nucleic Acids Res. 2008;36:W70–74. doi: 10.1093/nar/gkn188. [DOI] [PMC free article] [PubMed] [Google Scholar]
- 35.Wu M, Eisen JA. A simple, fast, and accurate method of phylogenomic inference. Genome Biol. 2008;9:R151. doi: 10.1186/gb-2008-9-10-r151. [DOI] [PMC free article] [PubMed] [Google Scholar]
- 36.Jones DT. Protein secondary structure prediction based on position-specific scoring matrices. J Mol Biol. 1999;292:195–202. doi: 10.1006/jmbi.1999.3091. [DOI] [PubMed] [Google Scholar]
- 37.Li W, Jaroszewski L, Godzik A. Clustering of highly homologous sequences to reduce the size of large protein databases. Bioinformatics. 2001;17:282–283. doi: 10.1093/bioinformatics/17.3.282. [DOI] [PubMed] [Google Scholar]
Associated Data
This section collects any data citations, data availability statements, or supplementary materials included in this article.