

Abstract
Study Objective
The purpose of this study is to determine whether older adults presenting to the Emergency Department (ED) with pain are less likely to receive pain medication than younger adults.
Methods
Pain-related visits to US EDs were identified using reason-for-visit codes from 7 years (2003–2009) of the National Hospital Ambulatory Medical Care Survey. The primary outcome was the administration of an analgesic. The percentage of patients receiving analgesics in four age groups were adjusted for measured covariates including pain severity.
Results
Pain-related visits accounted for 88,031 (46.9%) of ED visits by patients 18 or older during the 7-year period. There were 7,585 pain-related ED visits by patients 75 or older, representing an estimated 3.65 million US ED visits annually. Comparing survey-weighted unadjusted estimates, pain-related visits by patients 75 or older were less likely than visits by patients 35–54 to result in administration of an analgesic (49% vs. 68.3%) or an opioid (34.8% vs. 49.3%). Absolute differences in rates of analgesic and opioid administration persisted after adjustment for sex, race/ethnicity, pain severity and other factors and multiple imputation of missing pain severity data, with visits by patients 75 and older being 19.6% (95% CI, 17.8%-21.4%) less likely than visits by patients age 35–54 to receive an analgesic and 14.6% (95% CI, 12.8%–16.4%) less likely to receive an opioid.
Conclusion
Patients 75 and older with pain-related ED visits are less likely to receive pain medication than patients age 35–54.
Keywords: Geriatrics, Pain, Emergency Treatment
INTRODUCTION
Background and Importance
Pain is common in older adults, with pain occurring on most days in one month during the past year in 20–40% of older individuals.1,2 Pain is also a morbid condition in older individuals and associated with poor physical function, falls, and mortality.3–5 In the United States, emergency departments (EDs) play a critical role in providing treatment for acute pain, because they are open 24 hours a day, provide universal access to care, and have the capacity to treat a wide range of illnesses and injury using a full range of analgesic medication. Older adults are a large and growing subgroup of ED patients.6,7
Unfortunately, ED patients often receive inadequate pain treatment,8,9 and some populations are less likely to receive pain medication than others.10–12 Reports from individual sites13–16 and studies of specific conditions17,18 suggest that older adults are also less likely to receive adequate pain treatment in the ED. A recently published study identifying an association between long-term opioid use and mortality in older adults has raised concerns about the use of opioids in older adults but also prompted others to point out the limitations in existing evidence regarding optimal pain management in this population.19,20 The effective management of pain in older adults remains a priority, and further understanding of the epidemiology of pain management in older adults is needed.
Goal of this Investigation
The objective of this study is to compare ED pain treatment in older adults vs. younger adults using data that represents ED care across the United States, with comparisons by type of analgesic and by pain severity.
MATERIALS AND METHODS
Study Design and Administration
We evaluated national survey data on ED visits over 7 years (2003–2009) collected by the National Hospital Ambulatory Medical Care Survey (NHAMCS). The NHAMCS is an annual survey of ambulatory care services at US hospitals designed by the National Center for Health Statistics and administered by the US Census Bureau. The NHAMCS uses a 4-stage probability sample design to collect a nationally-representative sample of all ED visits at non-institutional general and short-stay hospitals, excluding federal, military, and Veterans Administration hospitals. Ratings of pain severity, an important covariate, were not collected during 2001 and 2002. Thus we limited our analyses to 2003 to 2009.
During the 7 years for which data were analyzed, annual NHAMCS surveys were conducted at 357 to 550 participating hospitals. Visit information at sampled hospitals was collected by hospital staff members during randomly assigned 4-week reporting period. Data collection is monitored by NHAMCS field representatives and then checked manually and by computer algorithm to ensure data consistency. Details of the NHAMCS methodology are available from the National Center for Health Statistics.21 This study was exempted from formal review by the institutional review board at The University of North Carolina at Chapel Hill.
Study Sample: Pain-Related Emergency Department Visits
For each ED patient visit in the NHAMCS database, up to 3 reasons for visit (i.e. chief complaints) are recorded using a standardized reason for visit (RFV) classification system.21 Patient visits were selected for inclusion in this study if one or more of their RFV classifications included the following terms: pain; painful; pain and related symptoms; pain, aching, soreness, or tenderness; and pain, ache, soreness, or discomfort. Visits were also included if they had one or more RFV classifications related to burn, fracture or dislocation, or migraine headaches, because these conditions are almost always painful. Secondary analyses examined pain treatment in patients with specific pain severity categories and patients admitted to the hospital or discharged to home.
Primary Predictor: Age Categories
Because we were interested in comparing pain treatment in younger vs. older adults, analyses were limited to visits by patients age 18 years and older. Patients age 75 or older were defined as the oldest adults; patients less than 75 were divided into the following three age groups: 18–34, 35–54, 55–74. Age was evaluated as a categorical variable in all analyses to allow detection of non-linear or threshold effects.
Covariates
To adjust for known or potential influences on ED pain treatment, analyses were adjusted for pain severity, sex,22 race/ethnicity,10 hospital admission, provider type,23 hospital location,10 hospital ownership,10 and year of visit.10 Pain severity was categorized as “none,” “mild,” “moderate,” or “severe” for 2003–2008. For 2009, pain severity was reported by NHAMCS using an 11 point numeric rating scale. Consistent with the scale used internally by NHAMCS for prior years,24 we defined pain scores of 1–3 as mild, 4–6 as moderate, and 7–10 as severe. Patient race and ethnicity were determined by hospital staff according to each hospital’s usual practice including “knowledge of the patient or from information in the medical record.”21 Race and ethnicity were categorized as non-Hispanic white (white), non-Hispanic black (black), Hispanic, or other. Admission to the hospital included admission to an observation unit. Provider type was divided into 3 categories: physician or attending; intern or resident; and mid-level provider (i.e. physician assistant or nurse practitioner). Hospital location was categorized into four regions: Northeast; South; Midwest; and West. Hospital ownership was categorized as voluntary nonprofit, government (non-Federal), and proprietary. All covariates were treated as categorical variables except for year of visit, which was treated as a continuous variable.
Outcome Measures
For each visit, up to 8 medications administered during the visit or prescribed at discharge are recorded in the NHAMCS database. All 8 medication data fields were completed in <1% of pain-related visits by patients 18 or older during the 7 study years, indicating that this limit on the recording of medications did not result in a meaningful loss of medication administration information. The primary outcome was the receipt of any analgesic, defined as an opioid, nonsteroidal anti-inflammatory drug (NSAID), or acetaminophen. Secondary outcomes included the specific receipt of an opioid or an NSAID. Tramadol was classified as an opioid.25 Both aspirin and selective COX-2 inhibitors were classified as NSAIDs. Muscle relaxants and benzodiazepines were not classified as analgesics, and the administration of these medications was not included in analyses. The administration of a medication was determined by searching the variables drugid1, drugid2, etc. using generic drug codes provided by NHAMCS.
From 2005–2009, NHAMCS further characterized medication as being administered in the ED or given as a prescription at discharge. The primary analysis was conducted on data from all 7 years without regard to whether the medication was administered in the ED or prescribed at discharge. Discharge prescriptions for opioids were analyzed separately for visits from 2005–2009. Discharge prescriptions for non-opioid analgesics were not examined because prescriptions are not necessary and often not given for these medications. Data from years 1999–2002 were used to demonstrate trends in pain management over time. These years only included 6 medication fields.
Primary Data Analysis
All analyses were conducted using Stata IC 11.0 (StataCorp LP, College Station, Texas) survey procedures with the weights, strata, and primary sampling unit design variables provided by NHAMCS. Our primary analyses examined the relationship between age category and the administration of any analgesic. We first present raw percentages of pain-related visits in the study sample in which an analgesic was administered by age category and type of analgesic. We then present weighted percentages of patients receiving analgesics using the survey design and weights. A Poisson regression model was then used to obtain adjusted percentages of pain-related visits in which pain medication was administered. Adjusted percentages were calculated at the mean value of each of the covariates, with adjustment for pain severity, sex, race/ethnicity, hospital admission, provider type, hospital location, hospital ownership and year of visit.
Pain severity data were missing for 18% (range: 14%–26%) of the patients during the 7 years. Rates of missing data for other variables were low. The presence of missing pain severity data was modeled using a survey logistic regression. Certain survey items were significantly associated (α=0.05) with missing data, including age category, abdominal pain, generalized pain, administration of an analgesic, provider type, and year of visit. These relationships indicate that the presence of missing pain severity data was not completely random. However, the presence of missing pain severity data was not associated with other sites of pain (e.g. head, neck, chest, or extremity), and there was no difference in the frequency of missing data between patients with and without fractures. These results suggest that the probability of pain severity data being missing was not dependent on unobserved pain severity values. Thus, in addition to a complete case analysis, multiple imputation (MI)26 was performed to estimate missing pain severity data and results using these imputations are also presented. MI was performed using the ice and mim commands developed for STATA 11.027 using 5 imputed data sets. Secondary analyses evaluated the relationships between age category and receipt of an opioid or an NSAID in the ED or receipt of a discharge prescription for an opioid and the relationships between age category and analgesic administration in the ED according to pain severity, patient disposition (admitted vs. discharged), and year of visit.
RESULTS
Characteristics of Study Subjects
A pain-related RFV code was recorded for 88,031 ED visits by patients age 18 or older, representing an estimated 42.7 million pain-related ED visits each year during the study period (46.9% of all ED visits by adults). Patients 75 or older made 7,585 pain-related ED visits during the study period, representing an estimated 3.65 million US ED visits annually. Among pain-related visits by patients 75 or older, whites made 80.9% of visits and females, 66.2% (Table 1). Compared to younger adults, the oldest adults were more likely to visit for pain in the chest or lower extremity, less likely to visit for headache, and more likely to be admitted. Of those visits with recorded pain severity, approximately two-thirds (68.9%) of patients age 75 and older had pain that was moderate or severe.
Table 1.
Characteristics of Pain-Related US Emergency Department Visits, 2003–2009, by Age Category.
| Characteristic | 18–34 (n=32,687)a | 35–54 (n=32,564)a | 55–74 (n=15,195)a | ≥75 (n=7,585)a |
|---|---|---|---|---|
| Sex (%) | ||||
| Male | 37.2 | 43.8 | 43.0 | 33.8 |
|
| ||||
| Female | 62.3 | 56.2 | 57.0 | 66.2 |
|
| ||||
| Race/ethnicityb (%) | ||||
| Non-Hispanic White | 59.3 | 62.1 | 68.6 | 80.9 |
|
| ||||
| Non-Hispanic Black | 24.7 | 24.5 | 19.0 | 10.5 |
|
| ||||
| Hispanicc | 13.4 | 10.9 | 9.4 | 6.0 |
|
| ||||
| Asian/Other | 2.7 | 2.6 | 3.1 | 2.6 |
|
| ||||
| Type of pain (%)d | ||||
| Heade | 22.0 | 18.6 | 12.9 | 9.6 |
|
| ||||
| Neck | 5.4 | 5.2 | 4.2 | 2.7 |
|
| ||||
| Chest | 9.3 | 16.8 | 24.2 | 23.9 |
|
| ||||
| Abdomen | 35.4 | 26.9 | 26.8 | 27.9 |
|
| ||||
| Back | 14.9 | 16.3 | 12.5 | 11.0 |
|
| ||||
| Lower Extremity | 11.6 | 15.1 | 17.4 | 22.0 |
|
| ||||
| Upper Extremity | 10.4 | 11.4 | 11.8 | 11.1 |
|
| ||||
| Generalized | 3.7 | 3.3 | 2.9 | 2.7 |
|
| ||||
| Other | 1.7 | 1.9 | 1.9 | 1.5 |
|
| ||||
| Severity of Pain (%) | ||||
| None | 3.2 | 3.3 | 5.9 | 9.8 |
|
| ||||
| Mild | 11.8 | 10.8 | 13.1 | 13.9 |
|
| ||||
| Moderate | 31.0 | 29.3 | 29.3 | 28.0 |
|
| ||||
| Severe | 36.6 | 39.6 | 32.8 | 24.4 |
|
| ||||
| Not reported/unknown | 17.5 | 17.0 | 18.9 | 23.8 |
|
| ||||
| Provider Type (%) | ||||
| Physician/Attending | 88.6 | 89.7 | 92.1 | 94.6 |
|
| ||||
| Intern/Resident | 1.6 | 1.6 | 1.6 | 1.2 |
|
| ||||
| Mid-level | 9.8 | 8.7 | 6.2 | 4.1 |
|
| ||||
| Hospital Ownership | ||||
| Voluntary non-profit | 72.8 | 73.7 | 75.8 | 80.1 |
|
| ||||
| Government, non-Federal | 16.1 | 16.6 | 14.5 | 11.4 |
|
| ||||
| Proprietary | 11.1 | 9.7 | 9.7 | 8.4 |
|
| ||||
| Hospital Admission (%) | 5.0 | 11.1 | 24.4 | 36.5 |
Numbers indicate the number of observations in the data set for all 7 years. All percentages in this table are calculated using survey weights.
N=84,411 (~4% missing race/ethnicity information)
Includes all persons of any race who are of Hispanic ethnicity.
Derived from reason for visit classification codes, not mutually exclusive.
Includes eye, ear, mouth, tongue, throat, nose, and sinus pain.
Main Results
For adults of all ages with pain-related visits, an analgesic was administered at 63.6% (95% CI, 62.7%–64.5%) of pain-related visits, an opioid analgesic was administered at 44.3% (95% CI, 42.8%–45.8%), and an NSAID was administered at 28.5% (95% CI, 27.7%–29.3%). Pain-related visit by the oldest patients were less likely to result in analgesic or opioid administration than visits by middle-aged patients (Figure 1). Specifically, using survey weighted unadjusted data, pain-related visits by patients 75 and older were 19.3% (95% CI, 17.3%–21.3%) less like than visits by patients age 35–54 to result in administration of an analgesic (Table 2). These absolute differences remained after MI of pain severity and adjustment for pain severity, sex, race/ethnicity, hospital admission, provider type, hospital location, hospital ownership, and year of visit, with pain-related visits by patients 75 and older still being 19.6% (95% CI, 17.8%–21.4%) less likely than visits by patients 35–54 to receive an analgesic. Lower frequencies of pain medication treatment for visits by patients 75 and older as compared to visits by patients age 35–54 were present for opioids (14.6%, 95% CI, 12.8%–16.4%) and NSAIDs (17.5%, 95% CI, 16.1%–19.0%) and for all four categories of pain severity (Table 3). Even among patients who reported severe pain, visits by patients 75 and older were 12.4% (95% CI, 9.5%–15.2%) less likely to result in the administration of an analgesic than visits by patients age 35–54. Differences in ED analgesic administration rates for visits by patients 75 and older vs. patients 35–54 were also present for both admitted (18.3%, 95% CI, 14.9%–21.7%) and discharged (17.7%, 95% CI, 15.5%–19.8%) patients. For pain-related ED visits, the frequency of analgesic and opioid administration increased from 1999 to 2009 (Figures 2a, 2b), but treatment differences between the oldest and younger patients remained.
Figure 1.
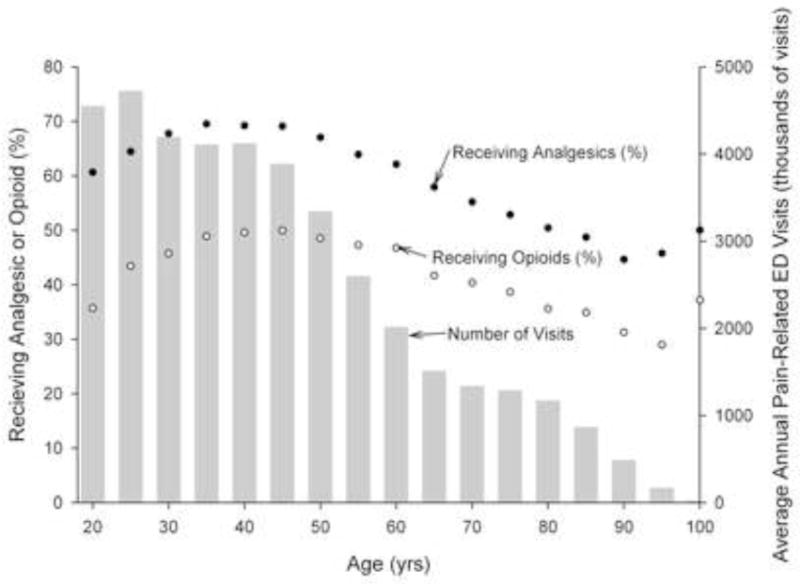
Percentage of Emergency Department Pain-Related Visits by Adults in Which Any Analgesic or an Opioid was Administered by Patient Age in 5 Year Increments, NHAMCS 1999–2008.
Table 2.
Predicted Percentagesa of Patients Receiving an Analgesic, an Opioid, an NSAID, or a Discharge Prescription for an Opioid During a Pain-Related Emergency Department Visit by Age Group.
| Age Subgroup | Raw %b | Weighted % (95% CI)c | Adjusted % (95% CI)c,d,e | MI Adjusted (95% CI)%c,d,f |
|---|---|---|---|---|
| Any Analgesic | ||||
| all | 63.2 | 63.6 (62.7–64.5) | 64.5 (63.7–65.4) | 62.0 (61.2–62.8) |
|
| ||||
| 18–34 | 63.9 | 64.8 (63.8–65.7) | 65.5 (64.5–66.4) | 63.3 (62.4–64.2) |
|
| ||||
| 35–54 | 67.6 | 68.3 (67.2–69.4) | 69.0 (68.0–69.9) | 66.8 (65.8–67.7) |
|
| ||||
| 55–74 | 59.2 | 59.8 (58.5–61.0) | 60.7 (59.5–61.9) | 58.0 (56.9–59.2) |
|
| ||||
| ≥75 | 49.2 | 49.0 (47.4–50.7) | 50.5 (48.7–52.3) | 47.2 (45.7–48.8) |
|
| ||||
| Opioid | ||||
| all | 42.8 | 44.3 (42.8–45.8) | 43.2 (41.9–44.4) | 41.4 (40.2–42.6) |
|
| ||||
| 18–34 | 40.3 | 42.2 (40.4–44.0) | 41.1 (39.6–42.6) | 39.6 (38.1–41.1) |
|
| ||||
| 35–54 | 47.5 | 49.3 (47.6–51.1) | 48.0 (46.6–49.4) | 46.4 (45.0–47.8) |
|
| ||||
| 55–74 | 42.4 | 44.0 (42.3–45.6) | 42.6 (41.1–44.1) | 40.9 (39.5–42.3) |
|
| ||||
| ≥75 | 34.3 | 34.8 (33.4–36.2) | 34.0 (32.6–35.5) | 31.8 (30.6–33.1) |
|
| ||||
| NSAID | ||||
| all | 29.4 | 28.5 (27.7–29.3) | 28.8 (28.0–29.6) | 27.5 (26.7–28.2) |
|
| ||||
| 18–34 | 32.6 | 33.0 (32.0–33.9) | 33.2 (32.2–34.3) | 32.2 (31.3–33.1) |
|
| ||||
| 35–54 | 32.1 | 31.8 (30.7–32.8) | 31.8 (30.8–32.8) | 30.7 (29.8–31.7) |
|
| ||||
| 55–74 | 23.9 | 23.3 (22.2–24.5) | 23.3 (22.1–24.5) | 22.1 (21.1–23.1) |
|
| ||||
| ≥75 | 14.6 | 14.1 (12.9–15.3) | 14.4 (13.3–15.6) | 13.2 (12.2–14.3) |
|
| ||||
| Discharge Opioidg | ||||
| all | 25.8 | 26.6 (25.5–27.7) | 20.9 (19.8–21.9) | 20.5 (19.3–21.6) |
|
| ||||
| 18–34 | 27.2 | 28.9 (27.5–30.4) | 25.7 (24.4–27.0) | 25.2 (24.0–26.4) |
|
| ||||
| 35–54 | 28.7 | 30.1 (28.9–31.4) | 24.3 (23.0–25.6) | 24.0 (22.7–25.3) |
|
| ||||
| 55–74 | 22.3 | 23.1 (21.4–24.8) | 14.9 (13.5–16.2) | 15.0 (13.4–16.6) |
|
| ||||
| ≥75 | 14.0 | 14.3 (12.9–15.7) | 7.9 (6.7–9.0) | 7.8 (6.6–9.0) |
CI=Confidence Interval; MI= Multiple Imputation
Predicted percentages calculated at the average of the covariates.
Sample patients only, not calculated using survey design and weights (n=88,031).
Accounts for survey design and weights.
Adjusted for pain severity, sex, race/ethnicity, hospital admission, provider type, hospital location, hospital ownership, and year of visit.
Adjusted n=69,218 (~18% of individuals missing pain severity score; ~4% race/ethnicity information)
MI Adjusted n=88,031
Only for survey years 2005–2009: Raw, Weighted, and MI Adjusted n=61,560; Adjusted n=49,048
Table 3.
Predicted Percentagesa of Patients Receiving an Analgesic for Pain-Related Emergency Department Visits by Age Group and Pain Severity Subgroups.
| Age Subgroup | Raw %b | Weighted % (95% CI)c | Adjusted %c (95% CI)d | MI Unadjusted %e (95% CI) | MI Adjusted % (95% CI)e |
|---|---|---|---|---|---|
| No Pain | |||||
| all | 31.8 | 31.8 (29.6–34.0) | 31.3 (29.0–33.5) | 29.8 (27.8–31.8) | 29.4 (27.5–31.4) |
|
| |||||
| 18–34 | 34.8 | 35.0 (30.4–39.7) | 34.0 (29.6–38.5) | 33.2 (28.9–37.5) | 32.7 (28.7–36.8) |
|
| |||||
| 35–54 | 35.2 | 35.1 (30.9–39.4) | 35.6 (31.3–39.8) | 33.9 (29.8–38.0 | 33.5 (29.5–37.5) |
|
| |||||
| 55–74 | 29.4 | 29.8 (26.1–33.5) | 28.4 (24.5–32.4) | 27.8 (24.4–31.1) | 27.5 (29.5–37.5) |
|
| |||||
| ≥75 | 25.3 | 26.1 (21.6–30.6) | 25.8 (21.2–30.4) | 23.6 (19.5–27.7) | 23.4 (19.4–27.4) |
|
| |||||
| Mild Pain | |||||
| all | 51.4 | 51.5 (50.0–53.0) | 51.5 (50.0–53.1) | 49.0 (47.6–50.4) | 48.6 (47.1–50.0) |
|
| |||||
| 18–34 | 52.6 | 52.7 (50.4–55.1) | 52.6 (50.3–55.0) | 50.4 (48.2–52.6) | 50.0 (47.8–52.1) |
|
| |||||
| 35–54 | 54.4 | 54.6 (52.4–56.7) | 54.8 (52.6–57.0) | 52.5 (50.3–54.6) | 52.0 (49.8–54.1) |
|
| |||||
| 55–74 | 48.4 | 48.5 (45.8–51.2) | 48.6 (45.7–51.6) | 46.2 (43.7–48.6) | 45.7 (43.3–48.2) |
|
| |||||
| ≥75 | 42.2 | 43.3 (39.1–47.6) | 43.4 (39.2–47.5) | 39.9 (36.1–43.7) | 39.6 (35.8–43.3) |
|
| |||||
| Moderate Pain | |||||
| all | 64.2 | 64.1 (63.2–65.0) | 63.9 (62.0–64.8) | 61.9 (61.0–62.9) | 61.6 (60.7–62.5) |
|
| |||||
| 18–34 | 64.6 | 65.1 (63.7–66.4) | 64.7 (63.3–66.2) | 63.1 (61.7–64.5) | 62.7 (61.4–64.1) |
|
| |||||
| 35–54 | 67.9 | 67.8 (66.5–69.0) | 67.7 (66.5–68.9) | 65.8 (64.5–67.1) | 65.5 (64.2–66.7) |
|
| |||||
| 55–74 | 60.8 | 61.2 (59.4–63.1) | 60.9 (59.1–62.8) | 58.9 (57.0–60.9) | 58.6 (56.8–60.4) |
|
| |||||
| ≥75 | 52.2 | 51.3 (48.3–54.2) | 51.3 (48.5–54.2) | 48.9 (46.1–51.8) | 48.7 (45.9–51.5) |
|
| |||||
| Severe Pain | |||||
| all | 75.9 | 76.3 (75.3–77.3) | 76.1 (75.1–77.1) | 74.6 (73.6–75.6) | 74.3 (73.3–75.3) |
|
| |||||
| 18–34 | 75.0 | 75.5 (74.1–76.9) | 75.3 (73.9–76.8) | 74.0 (72.6–75.3) | 73.6 (72.2–75.0) |
|
| |||||
| 35–54 | 78.8 | 79.2 (78.0–80.5) | 78.8 (77.6–80.1) | 77.7 (76.5–79.0) | 77.4 (76.2–78.6) |
|
| |||||
| 55–74 | 74.2 | 74.3 (72.6–75.9) | 74.2 (72.6–75.9) | 72.3 (70.7–73.9) | 72.1 (70.5–73.7) |
|
| |||||
| ≥75 | 67.4 | 68.2 (65.6–70.7) | 68.2 (65.6–70.8) | 65.2 (62.6–67.8) | 65.0 (62.5–67.6) |
CI=Confidence Interval; MI=Multiple Imputation
Predicted percentages calculated at the average of the covariates.
Sample patients only, not calculated using survey design and weights. Ns are 3,824; 11,205; 26,814; and 30,273 for pain categories none; mild; moderate; and severe, respectively (total n=72,116).
Accounts for survey design and weights.
Adjusted for sex, race/ethnicity, hospital admission, provider type, hospital location, hospital ownership and year of visit (total n=71,935)
N=88,031
Figure 2.
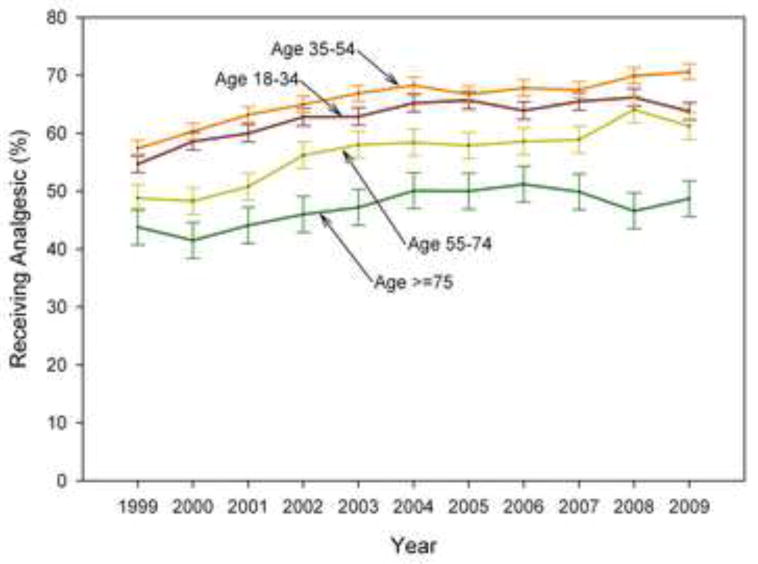
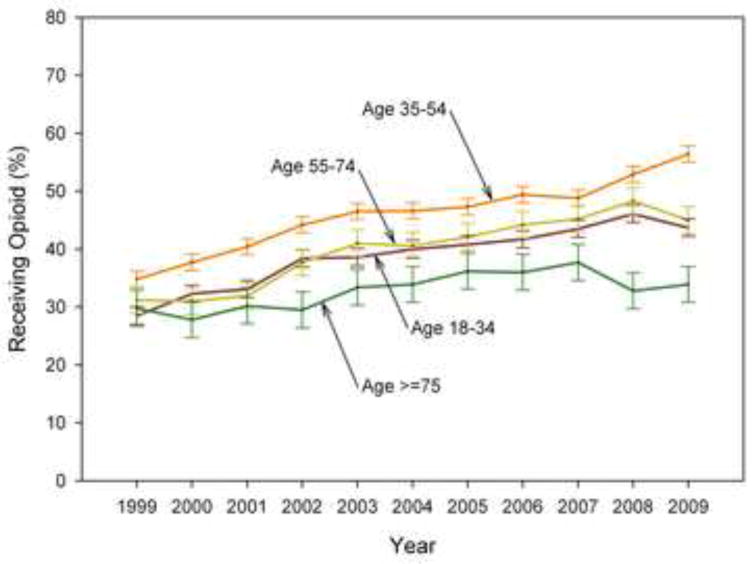
Figures 2a, 2b. Percentage of Emergency Department Pain-Related Visits in Which an Analgesic (a) and an Opioid (b) were Prescribed, by Age Category and Survey Year, NHAMCS 1999–2008.
LIMITATIONS
Some limitations of our analyses result from the limited clinical information provided in the NHAMCS database. The NHAMCS provides a single pain score for each patient visit but the time during the ED visit when this pain score is assessed is not defined and may occur either before or after pain medications are administered. For the same reason, we were not able to assess changes in pain symptoms during the ED visit or assess the adequacy of analgesia among patients who did receive pain medication. We were also not able to describe delays in the administration of opioids, which have been described as a problem for ED patients9 and serve as a potential measure of the quality of ED care. For patients who did not get analgesics, we do not know whether patients were offered medications and declined or were never offered medications. We also do not know which patients received pain medication during ambulance transport. However, since pain scores are obtained in the ED, any benefit of prehospital analgesia should be reflected in and adjusted for by ED pain severity ratings. Missing pain severity scores may introduce bias into the analyses of pain medication administration for all pain-related ED visits; we used MI in order to address this potential bias. We did not adjust the results for chief complaint, which may have affected analgesic administration directly or through an interaction with pain severity. The inclusion of aspirin as an NSAID in our analyses may have slightly inflated the estimate of pain medication use because aspirin is commonly provided to patients with chest pain as an anti-platelet agent rather than as an analgesic.
Our definition of pain treatment did not include the use of topical, local, or regional analgesia or non-pharmacologic therapies such as immobilization, ice, or massage. Regional analgesia and non-pharmacologic therapy have the potential to play important roles in ED pain management, particularly in older patients who are at high risk of adverse effects from systemic analgesia.28 Non-inclusion of these alternative forms of pain management may have led us to underestimate the proportion of patients receiving treatment for pain. However, we believe that at present non-pharmacologic therapies other than immobilization are rarely utilized in the ED. The results presented in figures 2a and 2b are based on 6 medications recorded by NHAMCS for 1999–2002 and 8 medications recorded for 2003–2009. Between 2003 and 2009, 1.9% of all patients and 4.5% of patients age 75 or older had data in either medication fields 7 or medication fields 7 and 8, but only 1.1% and 1.2%, respectively, contained any pain medication information. Thus the inclusion of two additional medication fields for the later years is unlikely to have made more than a small contribution to the observed trends in the frequencies of analgesic and opioid administration over time.
DISCUSSION
In this analysis of national trends in ED practice, more than half of all pain-related visits by patients 75 or older and a third of those with severe pain did not receive an analgesic. During the 7 years analyzed, visits by patients 75 or older were approximately 19% less likely to receive pain medication than were visits by patients 35–54. This estimate remained after adjustment for measurable confounders including pain severity. These estimates suggest that of 6 adults age 75 or older presenting to an ED with pain, 1 fewer would receive analgesic treatment than if all 6 patients were middle-aged. Pain-related visits for the oldest adults were also less likely to result in the administration of an opioid or an NSAID, and differences were present regardless of pain severity or whether the patient was being admitted or discharged. Differences in the frequency of analgesic administration between the oldest and younger patients persisted across the study period. Pain-related visits by adults age 18–34 and adults 55–74 were also significantly less likely to receive pain medication than patients age 35–54, but the difference was less pronounced in these age groups than for the oldest age group.
Our results are consistent with those from single-site studies which found lower rates of opioid administration for older adults for all pain-related visits15 and lower rates of discharge prescriptions for opioids for older adults.14 No prior study has reported lower rates of administration of analgesics in general for all types of pain-related ED visits for older adults. Thus, the present report extends the findings of prior studies and identifies oligoanalgesia in older ED patients in the US as a general phenomenon. Our findings add to the body of literature which is the basis for the recent Institute of Medicine report which describes the enormous burden of pain in the US and calls for a “transformation in the way pain is understood, assessed, and treated.”29
A number of factors may contribute to reduced pain treatment in older adults. Emergency providers may choose not to given analgesics to older adults because of concerns about potential short term30,31 or long term19,32–35 adverse effects. However, the observed difference in pain medication administration rates among admitted patients suggests that concerns about side effects in older adults do not entirely explain differences in rates of analgesia administration because providers concerns about side effects such as falls and sedation should be reduced for admitted patients. Because severe illness or injury is more common in older adults, there may be increased attention placed on diagnostics and less attention on treating pain for these patients.9 In this context, patient self-advocacy may be an important determinant of receiving pain treatment, and older patients may be less effective advocates than younger patients for the treatment of their pain. Documentation of pain severity is more often missing for older adults, and patients with missing pain severity scores are less likely to receive analgesics,36 suggesting that providers are less attentive to pain in older ED patients. In some older adults, patient failure to request analgesics or provider failure to recognize pain may be due to cognitive impairment.37 These potential barriers to care may be further compounded by limited formal training of emergency providers in the care of older adults.38
The treatment of pain in older adults is important not only to achieve an immediate reduction in suffering but also because untreated pain may impact long term health outcomes. Patients who present to the ED with pain and don’t receive treatment are likely to leave the ED with pain.39 Persistent pain in older adults is associated with decreased quality of life,40 impaired function,41 poor sleep,42 decreased balance,3 increased falls,4 and mortality,5 perhaps mediated through increased stress43 or pain’s effect on function.44 However, effective management of acute pain is associated with reduced persistent pain and improved function at 6 months in older patients following orthopedic surgery,45 suggesting that treating acute pain in ED patients has the potential to improve long term outcomes. Because of the negative effects of pain in older adults and the potential to reduce persistent pain by treating acute pain, the effective management of acute pain in this population is an important priority.
We found that pain-related visits by adults age 75 or older are less likely to result in analgesic treatment than visits by middle-aged adults, even after adjusting for pain severity. Our results suggest that additional efforts are needed to understand and overcome obstacles to the treatment of acute pain in older adults in the United States. In particular, additional research is needed to better define the relationship between analgesic administration for acute pain and long term health outcomes, determine the frequency of and risk factors for adverse effects from the short term use of analgesics, develop strategies to minimize adverse effects, and incorporate pharmacologic therapy into a multidisciplinary approach to pain management for this large, growing, and vulnerable population.
Acknowledgments
Funding: This study was supported by National Center for Research Resources grant KL2RR025746 (Dr Platts-Mills) and National Center for Research Resources UL1RR025747 (Dr Esserman) and institutional resources.
Role of the Sponsors:
The National Center for Research Resources had no role in the design and conduct of the study; the collection, management, analysis, and interpretation of the data; or the preparation, review or approval of the manuscript.
Footnotes
Presentations: Presented orally at the Society for Academic Emergency Medicine meeting in Boston, MA, June 2011.
Reprints: Reprints not available from the author.
Publisher's Disclaimer: This is a PDF file of an unedited manuscript that has been accepted for publication. As a service to our customers we are providing this early version of the manuscript. The manuscript will undergo copyediting, typesetting, and review of the resulting proof before it is published in its final citable form. Please note that during the production process errors may be discovered which could affect the content, and all legal disclaimers that apply to the journal pertain.
Contributor Information
Timothy F. Platts-Mills, Department of Emergency Medicine and Department of Anesthesiology, University of North Carolina Chapel Hill, 101 Manning Drive, CB #7010, Chapel Hill, NC 27599-7010.
Denise A. Esserman, University of North Carolina Chapel Hill, Departments of Biostatistics and Medicine, Division of General Medicine and Clinical Epidemiology.
D. Levin Brown, University of North Carolina Chapel Hill, School of Medicine.
Andrey V. Bortsov, University of North Carolina Chapel Hill, Department of Anesthesiology.
Philip D. Sloane, University of North Carolina Chapel Hill, Department of Family Medicine.
Samuel A. McLean, University of North Carolina Chapel Hill, Departments of Emergency Medicine and Anesthesiology.
References
- 1.Magni G, Caldieron C, Rigatti-Luchini S, Merskey H. Chronic musculoskeletal pain and depressive symptoms in the general population. An analysis of the 1st National Health and Nutrition Examination Survey data. Pain. 1990;43:299–307. doi: 10.1016/0304-3959(90)90027-B. [DOI] [PubMed] [Google Scholar]
- 2.Magni G, Marchetti M, Moreschi C, Merskey H, Luchini SR. Chronic musculoskeletal pain and depressive symptoms in the National Health and Nutrition Examination. I. Epidemiologic follow-up study. Pain. 1993;53:163–8. doi: 10.1016/0304-3959(93)90076-2. [DOI] [PubMed] [Google Scholar]
- 3.Poole E, Treleaven J, Jull G. The influence of neck pain on balance and gait parameters in community-dwelling elders. Man Ther. 2008;13:317–24. doi: 10.1016/j.math.2007.02.002. [DOI] [PubMed] [Google Scholar]
- 4.Leveille SG, Jones RN, Kiely DK, et al. Chronic musculoskeletal pain and the occurrence of falls in an older population. JAMA. 2009;302:2214–21. doi: 10.1001/jama.2009.1738. [DOI] [PMC free article] [PubMed] [Google Scholar]
- 5.Zhu K, Devine A, Dick IM, Prince RL. Association of back pain frequency with mortality, coronary heart events, mobility, and quality of life in elderly women. Spine (Phila Pa 1976) 2007;32:2012–8. doi: 10.1097/BRS.0b013e318133fb82. [DOI] [PubMed] [Google Scholar]
- 6.Strange GR, Chen EH. Use of emergency departments by elder patients: a five-year follow-up study. Acad Emerg Med. 1998;5:1157–62. doi: 10.1111/j.1553-2712.1998.tb02688.x. [DOI] [PubMed] [Google Scholar]
- 7.Roberts DC, McKay MP, Shaffer A. Increasing rates of emergency department visits for elderly patients in the United States, 1993 to 2003. Ann Emerg Med. 2008;51:769–74. doi: 10.1016/j.annemergmed.2007.09.011. [DOI] [PubMed] [Google Scholar]
- 8.Rupp T, Delaney KA. Inadequate analgesia in emergency medicine. Ann Emerg Med. 2004;43:494–503. doi: 10.1016/j.annemergmed.2003.11.019. [DOI] [PubMed] [Google Scholar]
- 9.Todd KH, Ducharme J, Choiniere M, et al. Pain in the emergency department: results of the pain and emergency medicine initiative (PEMI) multicenter study. J Pain. 2007;8:460–6. doi: 10.1016/j.jpain.2006.12.005. [DOI] [PubMed] [Google Scholar]
- 10.Pletcher MJ, Kertesz SG, Kohn MA, Gonzales R. Trends in opioid prescribing by race/ethnicity for patients seeking care in US emergency departments. JAMA. 2008;299:70–8. doi: 10.1001/jama.2007.64. [DOI] [PubMed] [Google Scholar]
- 11.Todd KH, Samaroo N, Hoffman JR. Ethnicity as a risk factor for inadequate emergency department analgesia. JAMA. 1993;269:1537–9. [PubMed] [Google Scholar]
- 12.Todd KH, Deaton C, D’Adamo AP, Goe L. Ethnicity and analgesic practice. Ann Emerg Med. 2000;35:11–6. doi: 10.1016/s0196-0644(00)70099-0. [DOI] [PubMed] [Google Scholar]
- 13.Jones JS, Johnson K, McNinch M. Age as a risk factor for inadequate emergency department analgesia. Am J Emerg Med. 1996;14:157–60. doi: 10.1016/S0735-6757(96)90123-0. [DOI] [PubMed] [Google Scholar]
- 14.Terrell KM, Hui SL, Castelluccio P, Kroenke K, McGrath RB, Miller DK. Analgesic prescribing for patients who are discharged from an emergency department. Pain Med. 2010;11:1072–7. doi: 10.1111/j.1526-4637.2010.00884.x. [DOI] [PubMed] [Google Scholar]
- 15.Hwang U, Richardson LD, Harris B, Morrison RS. The quality of emergency department pain care for older adult patients. J Am Geriatr Soc. 2010;58:2122–8. doi: 10.1111/j.1532-5415.2010.03152.x. [DOI] [PMC free article] [PubMed] [Google Scholar]
- 16.O’Connor AB, Zwemer FL, Hays DP, Feng C. Outcomes after intravenous opioids in emergency patients: a prospective cohort analysis. Acad Emerg Med. 2009;16:477–87. doi: 10.1111/j.1553-2712.2009.00405.x. [DOI] [PubMed] [Google Scholar]
- 17.Brown JC, Klein EJ, Lewis CW, Johnston BD, Cummings P. Emergency department analgesia for fracture pain. Ann Emerg Med. 2003;42:197–205. doi: 10.1067/mem.2003.275. [DOI] [PubMed] [Google Scholar]
- 18.Dohrenwend PB, Fiesseler FW, Cochrane DG, Allegra JR. Very young and elderly patients are less likely to receive narcotic prescriptions for clavicle fractures. Am J Emerg Med. 2007;25:651–3. doi: 10.1016/j.ajem.2006.11.040. [DOI] [PubMed] [Google Scholar]
- 19.Solomon DH, Rassen JA, Glynn RJ, Lee J, Levin R, Schneeweiss S. The comparative safety of analgesics in older adults with arthritis. Arch Intern Med. 2010;170:1968–76. doi: 10.1001/archinternmed.2010.391. [DOI] [PubMed] [Google Scholar]
- 20.Hwang U, Morrison RS, Richardson LD, Todd KH. A painful setback: misinterpretation of analgesic safety in older adults may inadvertently worsen pain care. Arch Intern Med. 2011;171:1127. doi: 10.1001/archinternmed.2011.262. [DOI] [PMC free article] [PubMed] [Google Scholar]
- 21.NHAMCS description. [Accessed November 26, 2010];US Centers for Disease Control and Prevention Web site. at http://www.cdc.gov/nchs/about/major/ahcd/nhacmsds.htm.
- 22.Chen EH, Shofer FS, Dean AJ, et al. Gender disparity in analgesic treatment of emergency department patients with acute abdominal pain. Acad Emerg Med. 2008;15:414–8. doi: 10.1111/j.1553-2712.2008.00100.x. [DOI] [PubMed] [Google Scholar]
- 23.Safdar B, Heins A, Homel P, et al. Impact of physician and patient gender on pain management in the emergency department--a multicenter study. Pain Med. 2009;10:364–72. doi: 10.1111/j.1526-4637.2008.00524.x. [DOI] [PubMed] [Google Scholar]
- 24. [Accessed September 9th, 2011];NHAMCS Micro-Data File Documentation. 2008 at ftp://ftp.cdc.gov/pub/Health_Statistics/NCHS/Dataset_Documentation/NHAMCS/doc08.pdf.
- 25.Grond S, Sablotzki A. Clinical pharmacology of tramadol. Clin Pharmacokinet. 2004;43:879–923. doi: 10.2165/00003088-200443130-00004. [DOI] [PubMed] [Google Scholar]
- 26.Little RJA, Rubin DB. Statistical Analysis with Missing Data. 2. Hoboken, NJ: John Wiley & Sons, Inc; 2002. [Google Scholar]
- 27.Royston P. Multiple imputation of missing values: update of ice. Stata J. 2005;5:527–36. [Google Scholar]
- 28.Chau DL, Walker V, Pai L, Cho LM. Opiates and elderly: use and side effects. Clin Interv Aging. 2008;3:273–8. doi: 10.2147/cia.s1847. [DOI] [PMC free article] [PubMed] [Google Scholar]
- 29.IOM. Relieving Pain in American: A Blueprint for Transforming Prevention, Care, Education, and Research. Washington, DC: The National Academies Press; 2011. [PubMed] [Google Scholar]
- 30.Miller M, Sturmer T, Azrael D, Levin R, Solomon DH. Opioid analgesics and the risk of fractures in older adults with arthritis. J Am Geriatr Soc. 2011;59:430–8. doi: 10.1111/j.1532-5415.2011.03318.x. [DOI] [PMC free article] [PubMed] [Google Scholar]
- 31.Gaudreau JD, Gagnon P, Roy MA, Harel F, Tremblay A. Opioid medications and longitudinal risk of delirium in hospitalized cancer patients. Cancer. 2007;109:2365–73. doi: 10.1002/cncr.22665. [DOI] [PubMed] [Google Scholar]
- 32.Pugsley MK. The diverse molecular mechanisms responsible for the actions of opioids on the cardiovascular system. Pharmacol Ther. 2002;93:51–75. doi: 10.1016/s0163-7258(02)00165-1. [DOI] [PubMed] [Google Scholar]
- 33.Gomes T, Mamdani MM, Dhalla IA, Paterson JM, Juurlink DN. Opioid dose and drug-related mortality in patients with nonmalignant pain. Arch Intern Med. 2011;171:686–91. doi: 10.1001/archinternmed.2011.117. [DOI] [PubMed] [Google Scholar]
- 34.Salvo F, Fourrier-Reglat A, Bazin F, et al. Cardiovascular and Gastrointestinal Safety of NSAIDs: A Systematic Review of Meta-Analyses of Randomized Clinical Trials. Clin Pharmacol Ther. doi: 10.1038/clpt.2011.45. [DOI] [PubMed] [Google Scholar]
- 35.Fick DM, Cooper JW, Wade WE, Waller JL, Maclean JR, Beers MH. Updating the Beers criteria for potentially inappropriate medication use in older adults: results of a US consensus panel of experts. Arch Intern Med. 2003;163:2716–24. doi: 10.1001/archinte.163.22.2716. [DOI] [PubMed] [Google Scholar]
- 36.Iyer RG. Pain Documentation and Predictors of Analgesic Prescribing for Elderly Patients During Emergency Department Visits. J Pain Symptom Manage. 2010 doi: 10.1016/j.jpainsymman.2010.04.023. [DOI] [PubMed] [Google Scholar]
- 37.Shega J, Emanuel L, Vargish L, et al. Pain in persons with dementia: complex, common, and challenging. J Pain. 2007;8:373–8. doi: 10.1016/j.jpain.2007.03.003. [DOI] [PubMed] [Google Scholar]
- 38.McNamara RM, Rousseau E, Sanders AB. Geriatric emergency medicine: a survey of practicing emergency physicians. Ann Emerg Med. 1992;21:796–801. doi: 10.1016/s0196-0644(05)81024-8. [DOI] [PubMed] [Google Scholar]
- 39.Todd KH, Sloan EP, Chen C, Eder S, Wamstad K. Survey of pain etiology, management practices and patient satisfaction in two urban emergency departments. CJEM. 2002;4:252–6. doi: 10.1017/s1481803500007478. [DOI] [PubMed] [Google Scholar]
- 40.Wu CL, Naqibuddin M, Rowlingson AJ, Lietman SA, Jermyn RM, Fleisher LA. The effect of pain on health-related quality of life in the immediate postoperative period. Anesth Analg. 2003;97:1078–85. doi: 10.1213/01.ANE.0000081722.09164.D5. table of contents. [DOI] [PubMed] [Google Scholar]
- 41.Morrison RS, Magaziner J, McLaughlin MA, et al. The impact of post-operative pain on outcomes following hip fracture. Pain. 2003;103:303–11. doi: 10.1016/S0304-3959(02)00458-X. [DOI] [PubMed] [Google Scholar]
- 42.Pavlin DJ, Chen C, Penaloza DA, Buckley FP. A survey of pain and other symptoms that affect the recovery process after discharge from an ambulatory surgery unit. J Clin Anesth. 2004;16:200–6. doi: 10.1016/j.jclinane.2003.08.004. [DOI] [PubMed] [Google Scholar]
- 43.McEwen BS, Stellar E. Stress and the individual. Mechanisms leading to disease. Arch Intern Med. 1993;153:2093–101. [PubMed] [Google Scholar]
- 44.Vangronsveld KL, Peters M, Goossens M, Vlaeyen J. The influence of fear of movement and pain catastrophizing on daily pain and disability in individuals with acute whiplash injury: a daily diary study. Pain. 2008;139:449–57. doi: 10.1016/j.pain.2008.05.019. [DOI] [PubMed] [Google Scholar]
- 45.Morrison RS, Flanagan S, Fischberg D, Cintron A, Siu AL. A novel interdisciplinary analgesic program reduces pain and improves function in older adults after orthopedic surgery. J Am Geriatr Soc. 2009;57:1–10. doi: 10.1111/j.1532-5415.2008.02063.x. [DOI] [PMC free article] [PubMed] [Google Scholar]