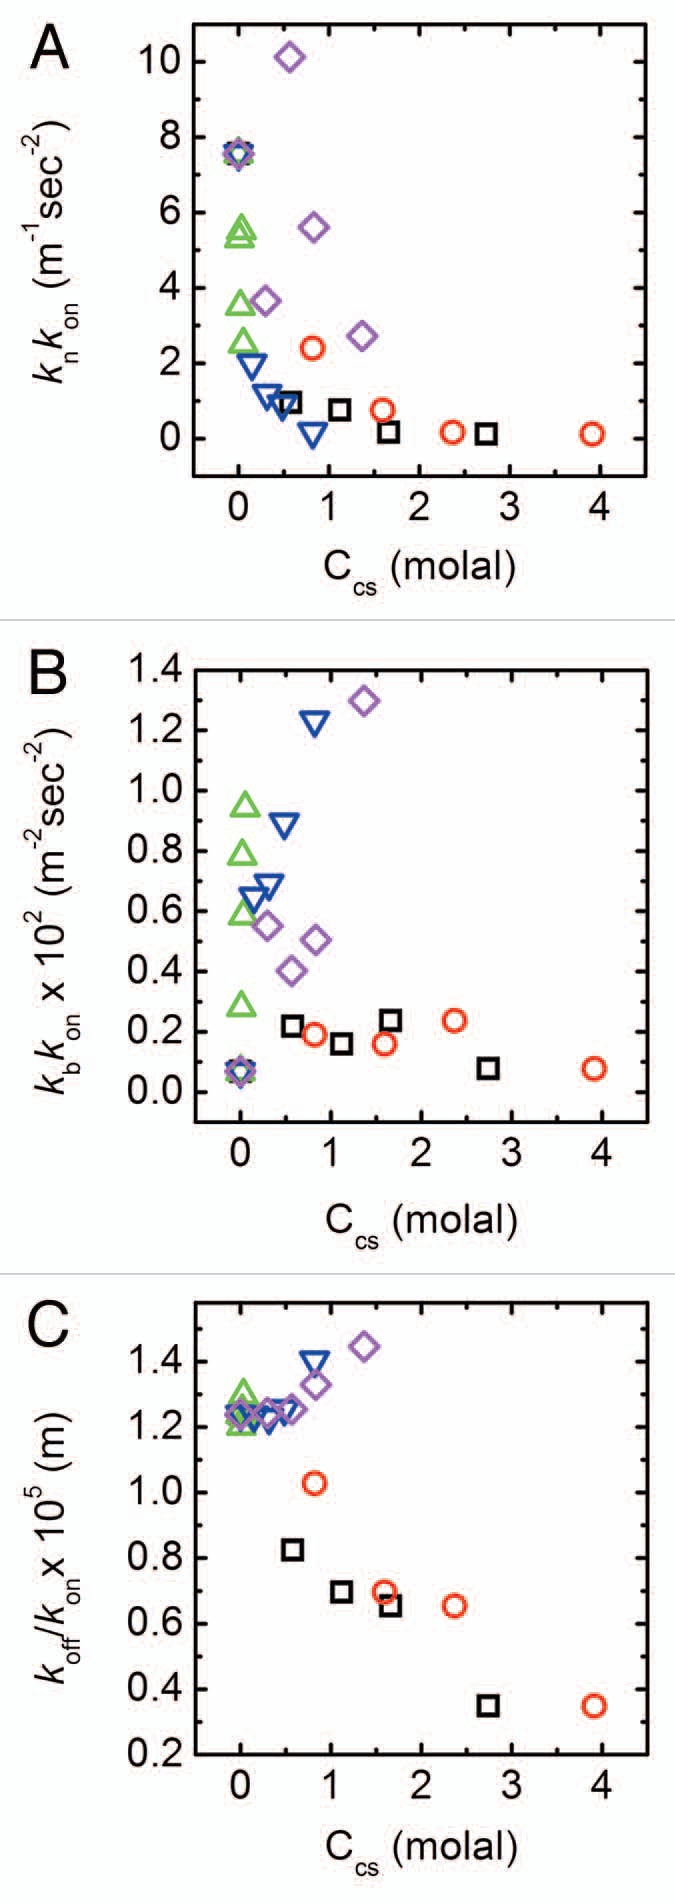
Figure 3.

Changes in fibrillation kinetic constants with cosolute concentration. Results are shown in terms of best fitted values for (A) kn kon, which represents rates at the nucleation step, (B) kb kon that is related to the rate of filament population growth and (C) koff/kon representing the quasi-equilibrium constant for monomer-fibril dissociation. Symbols as in Figure 1D. Errors as determined by an average of 3 fits to each curve are <1%.
