

Abstract
Background:
Azelaic acid (AzA) is the best known dicarboxilic acid to have pharmaceutical benefits and clinical applications and also to be associated with some diseases pathophysiology.
Materials and Methods:
We extracted and methylesterified AzA and determined its concentration in human plasma obtained from healthy individuals and also in mice fed AzA containing diet for three months.
Results:
AzA was detected in Gas Chromatography (GC) and confirmed by Liquid chromatography mass spectrometry (LCMS), and gas chromatography mass spectrometry (GCMC). Our results have shown that AzA can be determined efficiently in selected biological samples by GC method with 1nM limit of detection (LoD) and the limit of quantification (LoQ); was established at 50nM. Analytical Sensitivity as assayed by hexane demonstrated an analytical sensitivity at 0.050nM. The method has demonstrated 8-10% CV batch repeatability across the sample types and 13-18.9% CV for the Within-Lab Precision analysis. The method has shown that AzA can efficiently be recovered from various sample preparation including liver tissue homogenate (95%) and human plasma (97%).
Conclusions:
Because of its simplicity and lower limit of quantification, the present method provides a useful tool for determining AzA in various biological sample preparations.
Keywords: Fatty acids, dicarboxilic acids, method validation, lipids
Introduction
1, 7-heptanedicarboxylic acid belongs to a family of a naturally occurring saturated dicarboxylic fatty acid. The IUPAC name for 1, 7-heptanedicarboxylic acid is nonanedioic acid which is commonly known as azelaic acid (AzA). AzA has several beneficial properties such as its anti-inflammatory, antibacterial, and antikeratinizing effects[1,2]. It is a known inhibitor of tyrosinase, a vital constituent in the production of melanin and also has the ability to inhibit 5a-reductase, which is involved in androgenetic alopecia. AzA was also found to decrease the fibrinolytic potential of cultured human melanoma cells[3–5] and has been shown to have inhibitory effect on neutrophil functions[6]. Elevated amounts of AzA and pimelic acids are excreted in the urine of mitochondrial beta-oxidation disorders and also in peroxisomal beta-oxidation dysfunction. The measurement of AzA in these disorders is of great diagnostic value[7]. Bertuzzi and his coworkers have demonstrated through a pharmacokinetics studies in 12 healthy volunteers that venous infusion of AzA has extensive and rapid urinary clearance and a low estimated value of the maximal cellular uptake; these investigators have indicated that AzA is not suitable as an energy substrate for total parenteral nutrition[8].
AzA has also been used in various formulations to treat rosacea, acne, and melasma. The use of AzA 15% gel for the topical dermatologic treatment has already been approved by the Food and Drug Administration[9–11]. AzA penetrates into the stratum corneum (approximately 3 to 5% of the applied dose) and other viable skin layers (up to 10% of the dose is found in the epidermis and dermis). Negligible cutaneous metabolism occurs after topical application. Nearly 4% of the topically applied azelaic acid is systemically absorbed and excreted unchanged in the urine but undergoes some β-oxidation to shorter chain dicarboxylic acids[12]. AzA administered in healthy subjects has approximately a half life of 45 minutes after oral dosing and 12 hours after topical dosing, indicating percutaneous absorption rate-limited kinetics[12]. Despite of AzA diverse clinical application there is limited number of studies pertaining to its pathophysiology role in disease. Although the dicarboxylic acids do not occur in appreciable amounts as components of animal or vegetal lipids, they are in general important metabolic products of fatty acids since they are the byproducts of fatty acids oxidation. It is however, not clear whether AzA may have any physiological or pathological role in humans.
We are currently studying mechanisms involving AzA in cardiovascular disease, although the data is not yet published, our initial findings indicate several lines of interesting involvement of AzA in mechanisms related to cardiovascular disease. One of the problems for studying AzA in biological samples is the availability of a reliable and sensitive detection method for its measurement. The determination of dicaroboxylic acids in different sample preparations often poses great challenge because of the absence of a strong chromophore and fluorophore in these compounds as well as the difficulties associated with its derivatization for gas chromatograph analysis[13]. Earlier GC method for the determination of AzA in air was reported after derivatization of AzA with N, O-bis (trimethylsilyl) trifluoroacetamide[14].
In order to measure AzA and optimize its analysis in biological samples, the current study was designed to provide an improved, simple and precise procedure. The goal is to employ this method for the measurement of AzA in clinical samples with the possibility to widen the robustness of AzA clinical research.
Materials and Methods
AzA and all other chemicals were purchased from Sigma- Aldrich (St. Louis, MO) unless otherwise indicated. All organic solvent were obtained from Fisher Scientifics, Pittsburgh, PA, USA). C57 Black mice were obtained from The Jackson Laboratory, Bar Harbor, ME. 0.1% AzA in customized atherogenic diet was prepared by Harlan Teklad, Madison, USA. Human plasma was received from the Red Cross, Columbus, OH
Animals, diet administration, and collection of the samples
Ohio State University Animal Care Committee (OSUACC) approved the protocol and animals were treated in compliance with the university Animal Committee regulations and the research was conducted in conformity with this PHS policy.
Eighteen females C57BL6 mice weighing 18–21 gm were used in the study. Animals were divided into two groups, control group, (n=9) fed atherogenic diet and experimental, group (n=9) fed atherogenic diet mixed with 0.1% AzA, animals were housed under controlled light and temperature conditions (12-h light-dark cycle) for fifteen days. At the end of the feeding period, animal chow was removed and mice were fasted over night; and blood collected into tubes containing heparin. After centrifugation, plasma was stored at –80° C until processed for lipid analysis. Mice livers were collected after animal were euthanize following the OSUACC approved procedure. Livers were washed using phosphate buffer saline, and immediately frozen in liquid nitrogen and stored at –80° C. Approximately 100 mg of each liver was then homogenized and lipid was extracted following the Bligh and Dyer method[15]. The mice and human plasma lipids were also extracted following this method with internal standard added to the original samples (Table 1).
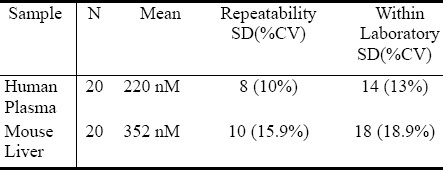
Table 1.
Precision Studies
Methylesterfication and Gas Chromatography Analysis
Methylester of human and mice plasma lipids as well as in the extracted mice liver lipids was prepared by adding 1ml of 14% boron trifluoride (BF3)/methanol to the extracted and dried lipids to; the mixture was then placed in water bath with temperature set at 75° C for 20 minutes. A methylestered AzA was later extracted in ether and dried under nitrogen gas. AzA methylester standard stoke (1M) was prepared in PBS following the methylesterfication procedure mentioned above. Prepared methylesters were then dissolved in hexane and injected in a Sigma-Supelco capillary column (50m × 0.25 mm, CP 6173); installed in a Varian CP-3380 Gas Chromatography (Varian, Inc USA). The column temperature was kept at 140° C for 0.5 min, and then gradually increased up to 225° C at the rate of 4° C per minute. The injector temperature was kept at 270° C and the detector (FID) temperature at 300° C.
AzA determination in GC-MS
Identification and quantification of AzA in GC-MS was performed on a Shimadzu gas chromatograph coupled to mass spectrometer (QP2010) equipped with Rtx®-2330 polar capillary column stationary phases. Cyano groups on both sides of the polymer backbone rinsed (90% biscyanopropyl/10% phenylcyanopropyl polysiloxane). The oven temperature was maintained at 120 °C for 0.5 min, ramped at 5 °C/min to 200° C and held for 15 min. The injector and interface were maintained at 260 °C. The ion source temperature was set at 160 °C. Carrier gas flow rate was maintained at a constant 1.51mL/min throughout. Total ion monitoring was performed, encompassing mass ranges from 50 to 550 atomic mass units. Peak identification was based on comparison of both retention time and mass spectra of the unknown peak to those of known standards within the GC-MS database library.
AzA determination in LCMS
A 3200 Q TRAP LC/MS/MS (Applied Biosystems/MDS Sciex) was used for the analysis. AzA (1nM) was injected using Hamilton Syringe 4.6 mm in diameter and a set flow rate of10.00 uL/min. Negative ion electrospray ionization (ESI) mode was employed, and a Q1MS Q1 scan was conducted to simultaneously scan for ions between 100-300 m/z. Heat block temperatures for the analysis was set at 300°C, with ion Source gas 1 flow set at 20 l/min and detector voltage at 5500 eV.
Method validation Parameters
To assess the performance of the method several validation attributes were evaluated these includes, Limits of detection (LODs), reproducibility, Within-Lab, recovery and interferences as outlined by Tietz Textbook clinical biochemistry and in the current approved Clinical and Laboratory Standards Institute (CLSI) guidelines[16].
Calculations of validation parameters and statistical analysis were performed on KaleidaGraph 4.0, Synergy Software, Reading, PA 19606
Limit of detection (LoD)
The lowest amount of AzA in a human plasma sample that can be detected (with a stated probability), was performed by series dilution using hexane on 5 replicates of methylestered lipid extracts.
Limit of quantification (LoQ)
The lowest amount of AzA in a human plasma sample that can be reliably detected was assessed by a series dilution using hexane on 5 replicates of methylestered lipid extracts.
The LoB and LoD was computed from replicate measurements made on a set of blank and of low AzA containing samples.
Analytical Sensitivity
The objective of this experiment is to estimate the analytical sensitivity (AS) of the AzA determination. It was performed by injecting five (5) replicates of the diluted lowest AzA detected level 4 times to yield a total of 20 tests, As was calculated by sum of the mean and 2SD.
Reproducibility (Batch Repeatability) and Within-Lab precision analysis
Pools for each sample type (human plasma, and Mice liver extracts) were made for this analysis, sample aliquots 4 of each sample type was injected 5 times for AzA analysis. This had yielded a total of 20 data points for Batch Repeatability testing for each pool. In a different set of experiments two replicates of each sample type pools were injected twice (4 hours apart) for a minimum of 20 test days for the Within-Lab Precision analysis.
Recovery studies
To assess the ability of the method to correctly measure the amount of pure AzA that is added to test samples. Recovery experiments were setup to establish method accuracy and to assess matrix effects on method performance. This was done by spiking a know amount of purified AzA into plasma from human and mice samples and also on liver extracts and compared the observed values with the expected results . AzA recovery studies were performed in mouse liver homogenate (10mg) and human plasma (50μl); PBS (50μl) served as control. In brief, aliquots of 10μmol AzA was dissolved in methanol and later dried under nitrogen before adding the liver homogenate, plasma and PBS to these aliquots, samples were then acidified with 50μl 12M HCl, and extracted in 1ml ethyl acetate. The ethyl acetate was then evaporated under nitrogen. Samples were then derivatized with 1ml 14% BF3, extracted in ether, and dissolved in hexane after the drying the ether phase. 1 μl of the hexane containing samples were injected in the GC following the same GC parameters mentioned above.
AzA percent recovery for each base sample was calculated.
Results
We assessed the limit of detection (LoD) using 5 replicates of series of diluted human methylesterified plasma. The lowest amount of AzA that can be detected was 1nM. The limit of quantification (LoQ); was established at 50nM as the lowest amount of AzA in a human plasma sample that can be reliably detected in a series dilution using hexane on 5 replicates of methylestered lipid extracts. Analytical Sensitivity was assayed by hexane injection n=20, and calculating the SD of the mean recovery. The results of the calculated sensitivity (mean concentration of negative sample + (2x pooled standard deviation)) demonstrated an analytical sensitivity 0.050nM. The method also has demonstrated acceptable linear relationship when AzA standard was run at incremental concentration (data not shown). Precisions data is shown in table 1, Repeatability SD (%CV) for human plasma was 8(10%), and mice liver 10(15.9%). The Within lab SD (%CV) was 14 (13%) for human and 18 (18.9) for mice liver.
Discussion
Gas chromatography in combination with mass spectrometry (MS) has become one of the most powerful tools in experimental lipids. However classical GC methods remain popular because of the cost associated with GCMS systems. It is therefore likely that even more laboratories will continue to use this method for the regular lipids analysis. The primary difficulties that arise in compounds with labile functional groups are that they may not always be analyzed easily or recognized by simple GC analysis. This is where the combination of GCMS will help to differentiate between molecules with similar retention time in a given programmed separation where excessive fragmentation may occur during sample derivatization[17,18]. Methyl ester derivatives of fatty acids are not always useful for identification purposes. It therefore essential to compare results obtained by employing different techniques before making a conclusion on results of compounds peak obtained by GC run[17]. Our initial animal and cell culture experiments targeting AzA involvement in inflammation process of cardiovascular diseases (data not published) have prompted us for the need a simple and reliable method to identify and quantify AzA bioavailability in biological samples. The available methods for the measurement of AzA were limited in sample types and were not thoroughly validated to meet the research or the future diagnosis needs[8,13,19,20]; a validated method should essentially address the basic methodology aspects pertaining to recovery from plasma and animal tissues as well as the other attribute of method precision and accuracy. The current AzA method is designed and investigated to provide a robust and validated procedure for possible future diagnostic and clinical research use.
The study was conducted in three stages; these are: identification, quantification and validation of the method. To identify the compound in some biological samples we acidified and later derivatized AzA using BF3 14% which is recommended in large volume of fatty acids, we also derivetized limited number of mice plasma with N, O. –Bis (trimethylsilyl) trifluoroacetamide (BSTFA) and extracted in ether and subsequently dried under nitrogen gas and later dissolved in hexane for GC injection. We did not see appreciable differences between the use of BSTFA and BF3; (data not shown) in fact samples run with BF3 had shown reproducible retention time compare to those run with BSTFA derivetization. Biological samples like plasma and tissue extracts would essentially contain complex mixtures of lipids, depending on its source; their fatty acids composition constitutes a major portion of each GC chromatogram. Optimal column, detector and injector conditions were chosen to allow the separation of the majority of these fatty acids[14], without compromising the AzA detection and separation. As seen from Fig. 1A, AzA standard eluted at around 12.5 min. When we added a known concentration of AzA methyl ester to mixture of a predetermined fatty acid methyl ester standards (FAME), AzA eluted with absolute distinction at the same retention time and concentration (Fig. 1B). We also looked at the effect of treating and extracting AzA powder with different solvent combinations before derivatization (data not shown). The results did not show appreciable difference between methanol/ HCl treatment and direct esterification without acidification, however data obtained from samples treated and later methylesterified have less noise, and we therefore decided to continue acidify prior to the methylesterification process. In order to further verify the formation of AzA methylester and also to see if the profile can be established through systems of higher detection, we directly injected known concentration of non esterified AzA in A 3200 Q TRAP LC/MS/MS employing negative ion electrospray ionization (ESI) mode, and a Q1MS Q1 scan was for a simultaneous scan for ions between 100-300 m/z. This has resulted in AzA mass eluted at a mass of 187.2 (Fig. 2). We further injected an esterified AzA standard in GCMS to verify its peak and resulted fragmentation following a modified method and a different column as mentioned above. We further injected an esterified AzA standard in GCMS to verify its peak and any resulted fragmentation following a modified method in another column as mentioned above. This has resulted in clear identification of the AzA methyl ester with a retention time at 9.5 min and a typical mass spectrum (Fig. 3). We repeated injections with different compositions of AzA containing samples. Mice plasma spiked with a known amount of AzA, and plasma obtained from set of mice fed AzA plasma samples were also run and have shown sufficient detection of AzA at the same retention time and a typical mass spectrum. As one can expect the AzA peak was not detected in mice plasma with no AzA fed or spiked into it. After AzA is efficiently detected by GC and confirmed by LCMS and GC-MC as mentioned earlier; we further focused on quantification and validation of the method.
Fig. 1A.
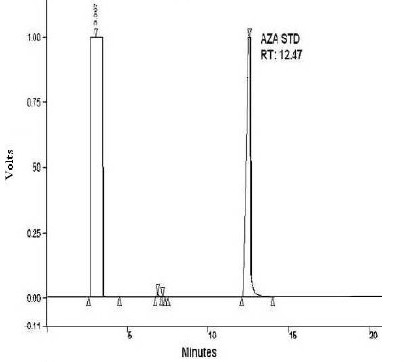
AzA methylester standard run in GC. 1 mM of AzA methylester was esterified by BF3, extracted in ether and dried under nitrogen gas and then dissolved in hexane and injected in a Sigma-Supelco capillary column (50m × 0.25 mm, CP 6173); The column temperature was kept at 140 ° C for 0.5 min, and then gradually increased up to 225° C at the rate of 4° C per minute. The injector temperature was kept at 270 ° C and the detector (FID) temperature at 300°C.
Fig. 1B.
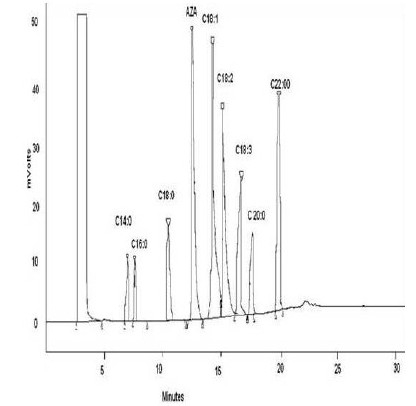
AzA spiked in FAME standard. 1 part of 1 mM of AzA methylester was mixed with 4 parts of 1mg/ml FAME standards and injected in GC. The column temperature was kept at 140 ° C for 0.5 min, and then gradually increased up to 225° C at the rate of 4° C per minute. The injector temperature was kept at 270 ° C and the detector (FID) temperature at 300°C.
Fig. 2.
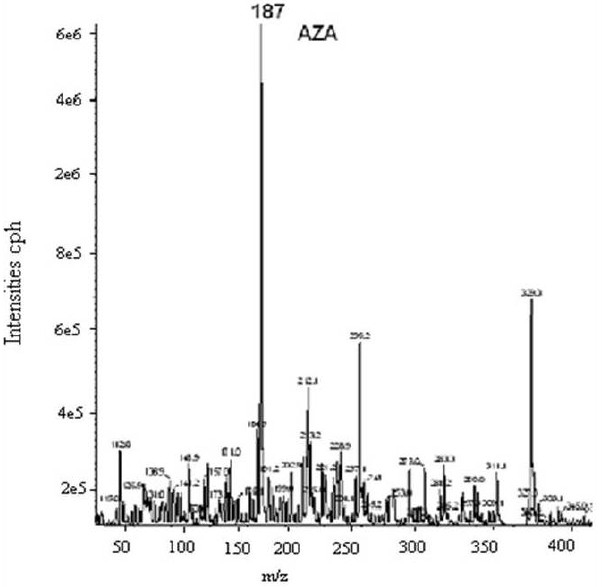
LCMS AzA profile. AzA (1nM) was injected using Hamilton Syringe (4.6 mm in diameter) and a set flow rate of10.00 uL/min. Negative ion electrospray ionization (ESI) mode was employed, and a Q1MS Q1 scan was conducted to simultaneously scan for ions between 100-300 m/z.
Fig. 3.
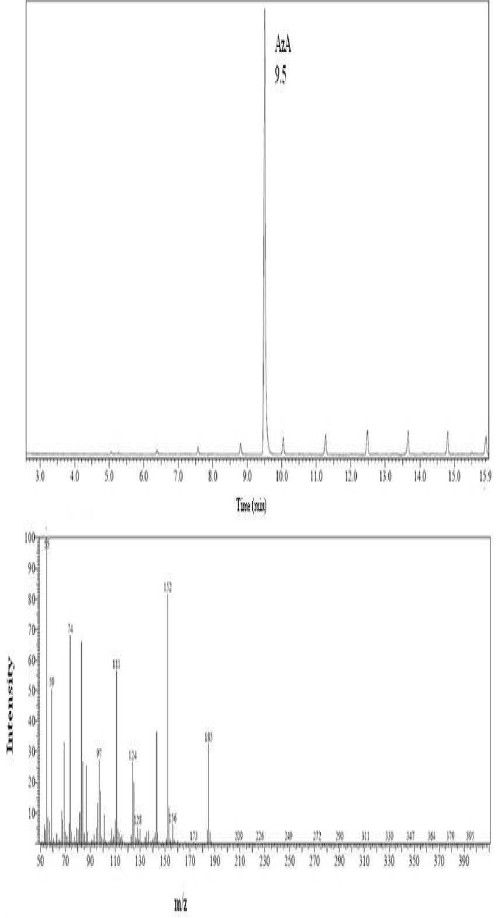
AzA standard GCMS profile. 1 mM of AzA methylester was esterified by BF3 , extracted in ether and dried under nitrogen gas and then dissolved in hexane and injected in GCMS; the oven temperature was maintained at 120 °C for 0.5 min, ramped at 5 °C/min to 200° C and held for 15 min. The injector and interface were maintained at 260 °C. The ion source temperature was set at 160 °C. Carrier gas flow rate was maintained at a constant 1.51mL/min throughout. Total ion monitoring was scan at ranges from 50 to 550 atomic mass units.
The robustness of any method depends on the level of precision that it can provide, we therefore performed intensive precision studies for two sample types (human plasma, and Mice liver extracts) as can be seen from table 1, the method have demonstrated 8-10% CV batch repeatability across the sample types and 13-18.9% CV for the Within-Lab Precision analysis. These have confirmed the observation for the results collected over several months of AzA GC analysis.
The recovery data demonstrate that AzA can efficiently be recovered from various sample preparation including liver tissue homogenate (95%) and human plasma (97%). The great recovery see in this study will allow specific concentrations dependent AzA studies in cell culture and also provide an opportunity to analyze its metabolic profile and account for the loss due to uptake and metabolism. It is worth mentioning that, acidification with HCl and extraction in ethyl acetate before derivatization with BF3, greatly enhance the recovery.
Conclusion
Because of its simplicity, lower limit of quantification, precision and great recovery, the present method provides a useful tool for determining AzA in biological samples preparation, and may be utilized in clinical research. The AzA method validation parameters were not performed on the LCMS and GCMS platforms as this goes beyond the scope of the current study. It is however important to perform a method comparison to a validated LCMS and GCMS using other sample types including cell culture and human tissues.
References
- 1.Nazzaro-Porro M. Azelaic acid. JAAD. 1987;17:1033–1041. doi: 10.1016/s0190-9622(87)70294-1. [DOI] [PubMed] [Google Scholar]
- 2.Passi S, Picardo M.G., Mingrone A, Breathnach M, Nazzaro-Porro Azelaic acid biochemistry and metabolism. Acta Dermato-Venereologica. 1989;143:8–13. doi: 10.2340/00015555143813. [DOI] [PubMed] [Google Scholar]
- 3.Rodriguez-Vicente J, Vicente-Ortega V, Canteras-Jordana M. The effects of different antineoplastic agents and of pretreatment by modulators on three melanoma lines. Cancer. 1998;82:495–502. doi: 10.1002/(sici)1097-0142(19980201)82:3<495::aid-cncr11>3.0.co;2-x. [DOI] [PubMed] [Google Scholar]
- 4.Breathnach A. Azelaic acid: potential as a general antitumoural agent. Medical Hypotheses. 1999;52(3):221–226. doi: 10.1054/mehy.1997.0647. [DOI] [PubMed] [Google Scholar]
- 5.Addo-Boadu K, Wojta J, Christ G, Hufnagl P, Pehamberger H, Binder R. Azelaic acid decreases the fibrinolytic potential of cultured human melanoma cells in vitro. Cancer Letters. 1996;103(2):125–129. doi: 10.1016/0304-3835(96)04185-7. [DOI] [PubMed] [Google Scholar]
- 6.Akamatsu H, Komura J, Asada Y, Miyachi Y, Niwa Y. Inhibitory effect of azelaic acid on neutrophil functions: a possible cause for its efficacy in treating pathogenetically unrelated diseases. Arc Derm Res. 1991;283(3):162–166. doi: 10.1007/BF00372056. [DOI] [PubMed] [Google Scholar]
- 7.Bennett J, Ragni C, Hood I, Hale E. Azelaic and pimelic acids: metabolic intermediates or artefacts? J Inh Met Dis. 1992;15(2):220–223. doi: 10.1007/BF01799635. [DOI] [PubMed] [Google Scholar]
- 8.Bertuzzi A, Gandolfi A, Salinari S, Mingrone G, Arcieri-Mastromattei E, Finotti V, Greco E. Pharmacokinetic analysis of azelaic acid disodium salt. A proposed substrate for total parenteral nutrition. Clinical Pharmacokinetics. 1991;20(5):411–449. doi: 10.2165/00003088-199120050-00005. [DOI] [PubMed] [Google Scholar]
- 9.Del Rosso Q. The use of topical azelaic acid for common skin disorders other than inflammatory rosacea. Cutis. 2006;77(2 Suppl):22–24. [PubMed] [Google Scholar]
- 10.Elewski B, Thiboutot D. A clinical overview of azelaic acid. Cutis. 2006;77(2 Suppl):126. [PubMed] [Google Scholar]
- 11.Gollnick M, Graupe K, Zaumseil P. Azelaic acid 15% gel in the treatment of acne vulgaris. Combined results of two double-blind clinical comparative studies. J der Deutschen Dermatologischen Gesellschaft. 2004;2(10):841–847. doi: 10.1046/j.1439-0353.2004.04731.x. [DOI] [PubMed] [Google Scholar]
- 12.Drug Information Sheet, AZELEX® (azelaic acid cream) (2003) Distributed by ALLERGAN, Irvine, California 92612, U.S.A., ©2002 Allergan, Inc. Distributed under license; U.S. Patent No. 4,386,104. Jun 5; [Google Scholar]
- 13.Ferioli V, Rustichelli C, Vezzalini F, Gamberini G. Determination of azelaic acid in pharmaceuticals and cosmetics by RP-HPLC after pre-column derivatization. Farmaco. 1994;49(6):421–425. [PubMed] [Google Scholar]
- 14.Palassis J. The sampling and determination of azelaic acid in air. Am Industr Hyg Associat J. 1978;39(9):731–736. doi: 10.1080/0002889778507842. [DOI] [PubMed] [Google Scholar]
- 15.Bligh G, Dyer A. A rapid method of total lipid extraction and purification. Can J Biochem Physiol. 1959;37:911–917. doi: 10.1139/o59-099. [DOI] [PubMed] [Google Scholar]
- 16.Koch D, Peters T. Selection and Evaluation of Methods. In: Burtis C., Ashwood E., editors. Tietz Textbook of Clinical Chemistry. 2nd ed. Philladelphia: W.B. Saunders Company; 1994. pp. 508–522. [Google Scholar]
- 17.Eder K. Gas chromatographic analysis of fatty acid methyl esters. J Chromatogr B Biomed Appl. 1995;671(1-2):113–131. doi: 10.1016/0378-4347(95)00142-6. [DOI] [PubMed] [Google Scholar]
- 18.Rashed S. Clinical applications of tandem mass spectrometry: ten years of diagnosis and screening for inherited metabolic diseases. J Chromatogr B Biomed Sci Appl. 2001;758(1):27–48. doi: 10.1016/s0378-4347(01)00100-1. [DOI] [PubMed] [Google Scholar]
- 19.Daverat P, Geffard M, Orgogozo M. Identification and characterization of anti-conjugated azelaic acid antibodies in multiple sclerosis. J Neuroimmunol. 1989;22(2):129–134. doi: 10.1016/0165-5728(89)90043-x. [DOI] [PubMed] [Google Scholar]
- 20.Mingrone G, Tacchino M, Greco V, Arcieri-Mastromattei E, Marino F, Finotti E, Castagneto E. Preliminary studies of a dicarboxylic acid as an energy substrate in man. JPEN. 1989;13(3):299–305. doi: 10.1177/0148607189013003299. [DOI] [PubMed] [Google Scholar]