Abstract
Background:
Despite the advances in the diagnosis and treatment of leishmaniasis, it is still considered as a severe public health problem particularly in developing countries and a great economic burden on the health resources. The present study was designed and conducted to determine the eco-environmental characteristics of the leishmaniasis disease by spatial analysis.
Materials and Methods:
In an ecological study, data were collected on eco-environmental factors of Fars province in Iran and on cutaneous leishmaniasis (CL) cases from 2002 to 2009. geographic weighted regression (GWR) was used to analyse the data and compare them with ordinary least square (OLS) regression model results. Moran's Index was applied for analysis of spatial autocorrelation in residual of OLS. P value less than 0.05 was considered as significant and adjusted R2 was used for model preferences.
Results:
There was a significant spatial autocorrelation in the residuals of OLS model (Z=2.45, P=0.014). GWR showed that rainy days, minimum temperature, wind velocity, maximum relative humidity and population density were the most important eco-environmental risk factors and explained 0.388 of the associated factors of CL.
Conclusion:
Spatial analysis can be a good tool for detection and prediction of CL disease. In autocorrelated and non-stationary data, GWR model yields a better fitness than OLS regression model. Also, population density can be used as a surrogate variable of acquired immunity and increase the adjusted R2.
KEYWORDS: Ecological study, environmental factors, geographic information systems, geographic weighted regression, leishmaniasis, spatial analysis
INTRODUCTION
Leishmaniasis is a complex disease with different clinical presentations and is caused by a parasite belonging to the Leishmania genus.[1] Although leishmaniasis is a worldwide vector-borne disease affecting 88 countries, recent studies show that 90% of cutaneous leishmaniasis (CL) cases occur in seven East Mediterranean countries including Afghanistan, Algeria, Brazil, Iran, Peru, Saudi Arabia and Syria.[1] Today, due to the increase in urbanisation, agricultural development, deforestation, irrigation, and more recently human immunodeficiency virus (HIV) infection in many countries, the transmission and spread of this disease shows an increasing trend.[2] It is estimated that more than 15 million people are infected with this disease,[3] with 1.5-2 million new cases per year.[4] Leishmaniasis is now considered as a severe public health problem particularly in developing countries[1,5] and Iran and a great economic burden on the health resources,[3] despite advances in its diagnosis and treatment.[5] It has been underestimated for many years until 1993 and is now classified by the World Health Organization (WHO) as one of the most neglected tropical diseases.[2,5] It is obvious that today the disease is much more prevalent than previously suspected and even its risk will be on increase in the future.[2] Also, the burden of disease is increasing such that its global burden is estimated to be equal to 2,357,000 years.[1]
CL is a disabling form of the disease when lesions are multiple, frequently self-healing in the old world and is the most common form of the disease in Iran.[6,7] Fars province in the south of Iran is one of the important foci of the disease. Based on the reported evidence, most rural areas in this province such as Arsanjan, Neiriz and Marvdasht cities can be considered as a CL focus.[8]
Many vector-bone diseases including malaria, Rift Valley fever, Lyme disease, Fasciola and Schistosoma have a focal area, where the spatial distribution of the parasite, host, vector and required environmental conditions coincide and geographic information systems (GIS) are used for description of these diseases.[9] Leishmaniasis is another vector-borne disease related to environmental factors[10] and its vector has a spatial distribution.[11] GIS is a method for spatial analysis that could create, archive, analyse traditional map and place data of diseases distribution in epidemiology and combine these with environmental data.[9] With this tool, data from different scales and types, for example, population health data, can be integrated with environmental data such as topographic maps or climatic information.[10]
There are many studies conducted on the risk factors which effect on the spread of CL diseases, but because environmental and geographical characteristics have an important effect on the disease spread,[12] all recent studies in Iran have focussed on characteristics of vectors of the disease or patients.[4,6,13–16] So, we designed and conducted the present study to determine the eco-environmental characteristics of this disease by spatial analysis.
MATERIALS AND METHODS
This was an ecological study conducted on CL cases in relation to eco-environmental factors.
Study area and population
Fars province is located in the south of Iran [Figure 1] at 27°31’ N, 50°55’ E and contains approximately 8% of the total surface area of Iran including 125,000 km.[2] This province covers 188 counties and has mountains with an average of 5000 feet height above the sea level; its climate is quite dusty and dry, with warm summers, mild winters and a great deal of sunshine throughout the year. The temperature range varies from 10°C in winter to 30°C in summer.[3,17,18] The study subjects consisted of all the residents in the counties of Fars province, including 188 counties.[17]
Figure 1.
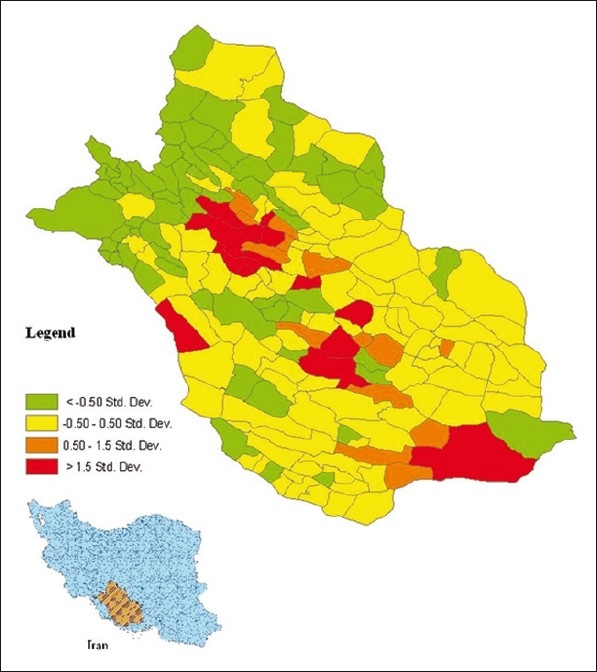
Location of Fars province and standardised variation in leishmaniasis cases from 2002 to 2009
Data collection
Eco-environmental and climate data such as earth topology, herb coverage, temperature, relative humidity, rainfall, evaporation rates and wind speed were obtained by weather bureau of Fars province, collected by meteorograph stations in separate shape file format. Also, CL cases were gathered as census by health surveillance system in all counties and in control diseases center (CDC) of Fars province. Then, these data were interpolated to all the counties or their neighbourhood by kiriging method. Data were collected through a questionnaire and a checklist. The questionnaire contained data on the demographic variables of patients, such as place of residence, lesion characteristics, vector, probable reservoir and treatment. This form was completed for all patients by auxiliary or health workers and sent to CDC in province health center (PHC). CL cases data were gathered for all the counties from 2002 to 2009 and were considered as outcome variable. Cumulative incident cases of the disease were rechecked by all the reported cases in these years by health centers. Because in the south of Iran CL is a rodent disease which be caused by Leishmania major and transmitted mainly by Phlebotomus papatasi sand flies and also the main reservoir hosts of the disease is Tatera indica,[3] the agent and vector of disease were not considered as covariates.
After collection of CL and climate data, all the collected data were entered and a data file was created that was useful for Arc GIS 9.3 software and spatial analysis.
Statistical analysis
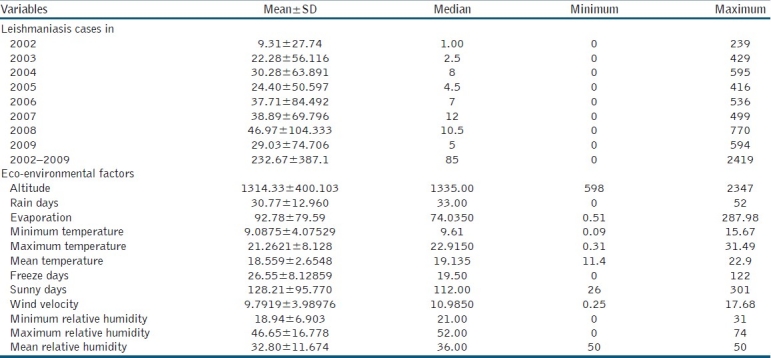
We analysed the data in county level instead of cities due to the wide variation in CL cases and for better fitting of the spatial models. To study the spatial distribution and within the context of the environmental characteristics, Arc GIS 9.3 software was applied. Spatial models such as geographic weighted regression (GWR) were used for analysis and compared with ordinary least square (OLS) model. In the first stage, we ran the OLS with 12 explanatory variables as shown in Table 1, and then residuals of OLS test by Moran's Index were used for spatial autocorrelation. In the third stage, we used GWR because of the existence of autocorrelation in residual of OLS regression models, unfitness of linear regression model and significant non-stationary nature of the regression model.
Table 1.
Explanatory variables included in the study
GWR is one of the several spatial regression techniques and an extension of traditional regression to predict, detect and estimate spatial non-stationary coefficient for model variables.[19,20] This spatially localised model assumes variability in relationships between the regression variables over space and generates a set of local models for the outcome variable or process we are trying to predict and fit a regression equation to every feature.[19,21] Arc GIS 9.3 and SPSS16 were used for analysis of the data. A P value of 0.05 was considered as significant.
RESULTS
Table 1 shows the explanatory variables included in the present study and summarises the mean, median, minimum and maximum of these variables. The location of Fars province and standardised variation in CL cases from 2002 to 2009 in all counties of the province are plotted in Figure 1.
In OLS model, Chi-square of Joint Wald Statistic was equal to 58.8 and robust overall model was significant, so the robust t-statistics and its probability were used for deciding about predictor variables. OLS (global) model results are shown in Table 2, indicating that rainy days, minimum temperature, wind velocity, maximum and minimum relative humidity were significant variables that can predict the CL (P< 0.05). The standardised residuals of OLS model are plotted in Figure 2, showing that the model has no goodness of fit in center, south and west south of the study area. Also, the Jarque-Bera statistic probability (P< 0.05) shows deficiency of a magnitude variable in the model.
Table 2.
Variables and their statistics in ordinary least square model

Figure 2.
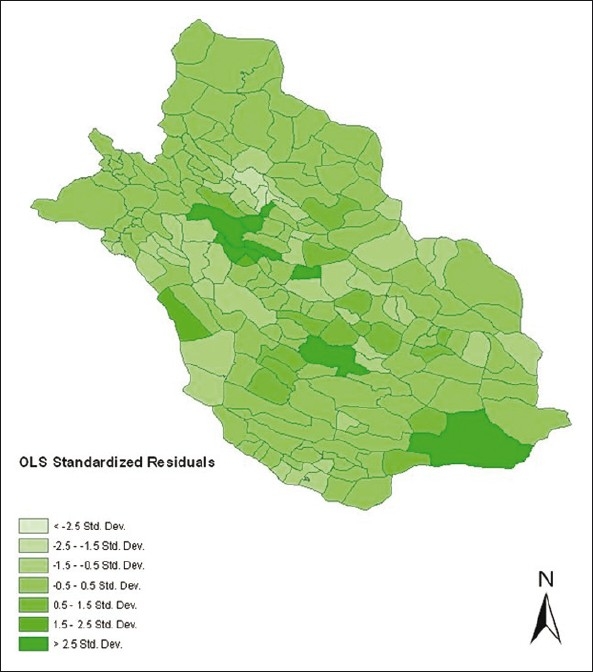
Standardised residual plot of OLS in the study area by all explanatory variables
We used the spatial autocorrelation (Moran's I) tool to ensure that residuals of OLS were not spatially autocorrelated. This test showed that there was a significant spatial autocorrelation in residuals of OLS model (Z=2.45 and P-value=0.014). On other hand, CL cases were more likely to be similar among nearby counties than among greater distant counties.
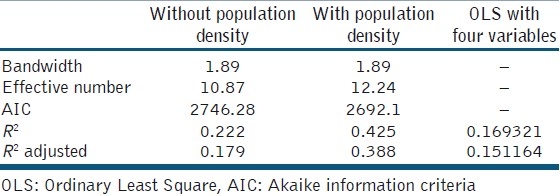
The probability of Koenker statistics was less than 0.05, suggesting that the data were non-stationary, so we used GWR to remove the effect of non-stationary features of data. After running GWR with all explanatory variables, the model was severely complex and not executed, so we conducted factor analysis to reduce the variables. Based on principal component analysis method, rainy days, minimum temperature, wind velocity and maximum relative humidity were the important factors in its components. According to these variables, the R2 and adjusted R2 reduced to 0.222 and 0.179, respectively. These models suggested missing of a very important variable in the model. So, in the next stage, we included population density as surrogate of acquired immunity and then the R2 and adjusted R2 increased to 0.425 and 0.389, respectively. The standardised residual of local models is plotted in Figure 3.
Figure 3.
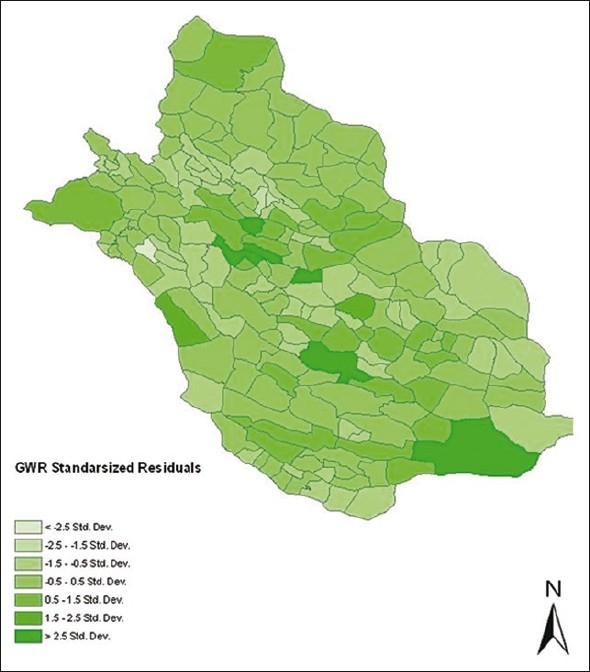
Standardised residual plot of GWR in the study area by rain days, minimum temperature, wind velocity, maximum relative humidity and population density
Table 3 compares the goodness of fit parameters in three used models and shows that the GWR model is more efficiently. The akaike information criteria (AIC) and R2 show that GWR model with population density is better fitted.
Table 3.
Goodness of fit for the three models used in the study including rainy days, minimum temperature, wind velocity, maximum relative humidity
DISCUSSION
Recent advances in techniques and computer-based geographical information systems help the scientists and researchers to predict, monitor and diagnose the environmental and ecological factors affecting the spatial and temporal distribution of several vector-borne diseases including malaria, leishmaniasis, and schistosomiasis,[22] and also other diseases such as coronary heart diseases.[19] Determination of the relationship of descriptive data with geographical places was an important characteristic of this study that contributes to evaluation of eco-environmental factors related to CL.
Based on the results of OLS model, among the ecological factors under study, rainy days, minimum temperature, wind velocity and maximum relative humidity were the most important predictors of spatial distribution of CL. In the present study, we predicted the most important eco-environmental factors pertaining to spatial relationship and compared OLS and GWR models. In ordinary regression models, autocorrelation can affect the coefficients of the variables and disturb the fitness of the model, which was shown in the present study.[20] Although in this study R2 of GWR is reduced because of fewer explanatory variables in the model, GWR in comparison with OLS with fixed explanatory variables has a higher adjusted R2 (0.18 vs. 0.15) because the GWR weights to any spatial according to its features but OLS cannot do it.[20] Other studies also compare the fitness of OLS and GWR. Grillet et al. showed that GWR models in mosquito-borne infection greatly improved prediction of malaria risk as compared to OLS regression models.[23]
Low adjusted R2 in GWR and OLS models indicates the deficiency of important variables in the model. So, population density was used as a surrogate for acquired immunity variable[24] and included in the final model. This surrogate variable increases the adjusted R2 from 0.18 to 0.388. It was found that rainy days, minimum temperature, wind velocity, maximum relative humidity and population density can be considered as predictors of eco-environmental factors of CL. Some other studies[11,22] have been conducted in this area and have come to the same conclusion. One study in spatial relations between environmental and meteorological factors in central Spain showed that shelter against wind, lower summer mean temperature and lower annual mean precipitation are important factors in sand fly frequency.[11] In another study conducted in Sudan,[22] altitude and downpour were the most important factors. However, in our study, although the same conclusion was reached as to rain, altitude was not a significant factor in our results.
There are some important factors such as demographic and human behaviors that were not included in this study while they are related to CL.[4,8,25,26] In addition, seasonal, cycle and genetic variation of the vector can affect the presence of CL.[11,24] But Gonzalez et al. predicted that due to the capacity of vectors to persist in the habitats with different degrees of ecological suitability and climate changes, the number of cases will increase in upcoming decades.[27]
This study had some limitations that might have affected our results. The surveillance system of CL in Iran is a passive system and many of the patients with small lesions or with lesions in the masked area might not refer to health centers or surveillance system. It can affect the number of reported cases in some areas, especially in rural areas. Another limitation in our study was the variety in climate factors and disease pattern. It caused a wide variation in the reported cases in the province, which is reflected in our maps, but studying on counties reduces this effect and helps us in disease mapping and modeling of related factors. Future researches are required to evaluate the effect of other ecological and sero-epidemiologic features in other agents and vectors.
CONCLUSION
Spatial analysis can be a good tool for detection and prediction of CL disease. As compared to autocorrelated and non-stationary data, GWR model yields a better fitness than OLS model. Therefore, based on our results and other recent studies on demographic factors that affect CL cases and disease pattern, it is essential for the health authorities to take measures to control this epidemic and prevent its spread to non-contaminated or low-rated counties. Also, rapid treatment of patients in the coming years is essential as well. Since CL is a multifactorial disease, and ecological, demographic, temporal and climatic factors affect it,[22,28,29] for the control of leishmaniasis and CL, close cooperation between the universities of medical sciences, health centers and the government is recommended.
ACKNOWLEDGEMENTS
We are very thankful to all health care workers in the health system network for assistance in data collection and research. We thank the Vice-Chancellor of Shiraz University of Medical Sciences for financial support of this thesis with No. 5000. The authors are also grateful to the assistant of aerological organization experts of Fars province for preparing climate data. This article is a part of MSc thesis in epidemiology major at Shiraz University of Medical Sciences. The authors would like to thank Dr. Nasrin Shokrpour at Center for Development of Clinical Research of Nemazee Hospital for editorial assistance.
Footnotes
Source of Support: Shiraz University of Medical Sciences
Conflict of Interest: None declared.
REFERENCES
- 1.Desjeux P. Leishmaniasis: Current situation and new perspectives. Comp Immunol Microbiol Infect Dis. 2004;27:305–18. doi: 10.1016/j.cimid.2004.03.004. [DOI] [PubMed] [Google Scholar]
- 2.Desjeux P. Global control and leishmania HIV co-infection. Clin Dermatol. 1999;17:317–25. doi: 10.1016/s0738-081x(99)00050-4. [DOI] [PubMed] [Google Scholar]
- 3.Asgari GH, Motazedian MH, Mehrabani D, Oryan A, Hatam GH, Owji SM, et al. Zoonotic cutaneous leishmaniasis in Shiraz, Southern Iran: A molecular, isoenzyme and morphologic approach. JRMS. 2007;12:7–15. [Google Scholar]
- 4.Talari SA, Talaei R, Shajari G, Vakili Z, Taghaviardakani A. Childhood cutaneous leishmaniasis: Report of 117 cases from Iran. Korean J Parasitol. 2006;44:355–60. doi: 10.3347/kjp.2006.44.4.355. [DOI] [PMC free article] [PubMed] [Google Scholar]
- 5.Zimmermann S, Moll H, Solbach W, Luder CG. Meeting Report IFoLeish-2008: Current status and future challenges in leishmania research and leishmaniasis. Protist. 2009;160:151–8. doi: 10.1016/j.protis.2008.12.001. [DOI] [PubMed] [Google Scholar]
- 6.Abai MR, Oshaghi MA, Tajedin L, Rassi Y, Akhavan AA. Geographical distribution and ecological features of the great gerbil subspecies in the main zoonotic cutaneous leishmaniasis foci in Iran. Asian Pac J Trop Med. 2010;3:800–3. [Google Scholar]
- 7.Oshaghi MA, Rasolian M, Shirzadi MR, Mohtarami F, Doosti S. First report on isolation of leishmania tropica from sandflies of a classical urban Cutaneous leishmaniasis focus in southern Iran. Exp Parasitol. 2010;126:445–50. doi: 10.1016/j.exppara.2010.05.020. [DOI] [PubMed] [Google Scholar]
- 8.Rassi Y, Javadian E, Jalali M, Motazedian MH, Vatndoost H. Investigation on zoonotic cutaneous leishmaniasis, Southern Iran. Iran J Public Health. 2004;33:31–5. [Google Scholar]
- 9.Malonea JB, Gommesb R, Hansenb J, Yilmac JM, Slingenbergb J, Snijdersb F, et al. A geographic information system on the potential distribution and abundance of Fasciola hepatica and F.gigantica in east Africa based on Food and Agriculture Organization databases. Vet Parasitol. 1998;78:87–101. doi: 10.1016/s0304-4017(98)00137-x. [DOI] [PubMed] [Google Scholar]
- 10.Correa Antonialli SA, Torres TG, Paranhos Filho AC, Tolezano JE. Spatial analysis of American Visceral Leishmaniasis in Mato Grosso do Sul State, Central Brazil. J Infect. 2007;54:509–14. doi: 10.1016/j.jinf.2006.08.004. [DOI] [PubMed] [Google Scholar]
- 11.Gálvez R, Descalzo MA, Miró G, Jiménez MI, Martín O, Dos Santos-Brandao F, et al. Seasonal trends and spatial relations between environmental/meteorological factors and leishmaniosis sand fly vector abundances in Central Spain. Acta Trop. 2010;115:95–102. doi: 10.1016/j.actatropica.2010.02.009. [DOI] [PubMed] [Google Scholar]
- 12.Alonso F, Gimenez Font P, Manchon M, Ruiz de Ybanez R, Segovia M, Berriatua E. Geographical variation and factors associated to seroprevalence of canine leishmaniosis in an endemic Mediterranean area. Zoonoses Public Health. 2010;57:318–28. doi: 10.1111/j.1863-2378.2008.01228.x. [DOI] [PubMed] [Google Scholar]
- 13.Oshaghi MA, Rasolian M, Shirzadi MR, Mohtarami F, Doosti S. First report on isolation of Leishmania tropica from sandflies of a classical urban Cutaneous leishmaniasis focus in southern Iran. Exp Parasitol. 2010;126:445–50. doi: 10.1016/j.exppara.2010.05.020. [DOI] [PubMed] [Google Scholar]
- 14.Parvizi P, Baghban N, Novin EA, Absavaran A. Detection, identification and molecular typing of Leishmania major in Phlebotomus papatasi from a focus of zoonotic cutaneous leishmaniasis in central of Iran. Exp Parasitol. 2010;124:232–7. doi: 10.1016/j.exppara.2009.10.004. [DOI] [PubMed] [Google Scholar]
- 15.Yaghoobi-Ershadi MR, Javadian E, Tahvildare-Bidnmi GH. The isolation of Leishmania major from Phlebotomus (Paraphlebotomus) caucasicus, in Isfahan Province, Islamic Republic of Iran. Trans R Soc Trop Med Hyg. 1994;88:518–9. doi: 10.1016/0035-9203(94)90142-2. [DOI] [PubMed] [Google Scholar]
- 16.Yaghoobi-Ershadi MR, Akhavan AA, Mohebali M. Meriones Iibycus and Rhombomys opimus (Rodentia: Gerbillidae) are the main reservoir hosts in a new focus of zoonotic cutaneous leishmaniasis in Iran. Trans R Soc Trop Med Hyg. 1996;90:503–4. doi: 10.1016/s0035-9203(96)90295-3. [DOI] [PubMed] [Google Scholar]
- 17.Azimi F, Sepehri Manesh MF, Akram A. Geography of fars province. Tehran: Iran Educational Book's Publication; 2003. p. 64. [Google Scholar]
- 18.Razmjou S, Hejazy H, Motazedian MH, Baghaei M, Emamy M, Kalantary M. A new focus of zoonotic cutaneous leishmaniasis in Shiraz, Iran. Trans R Soc Trop Med Hyg. 2009;103:727–30. doi: 10.1016/j.trstmh.2008.12.013. [DOI] [PubMed] [Google Scholar]
- 19.Hu Z. Spatial analysis of MODIS aerosol optical depth, PM2.5, and chronic coronary heart disease. Int J Health Geogr. 2009;8:27. doi: 10.1186/1476-072X-8-27. [DOI] [PMC free article] [PubMed] [Google Scholar]
- 20.Fotheringham AS, Brunsdon C, Charlton M. Geographically weighted regression: The analysis of spatially varying relationships. Chichester, UK: John Wiley and Sons; 2002. [Google Scholar]
- 21.Mandal R, St-Hilaire S, Kie JG, Derryberry D. Spatial trends of breast and prostate cancers in the United States between 2000 and 2005. Int J Health Geogr. 2009;8:53. doi: 10.1186/1476-072X-8-53. [DOI] [PMC free article] [PubMed] [Google Scholar]
- 22.Elnaiem DE, Schorscher J, Bendall A, Obsomer V, Osman ME, Mekkawi AM, et al. Risk mapping of visceral leishmaniasis: The role of local variation in rainfall and altitude on the presence and incidence of kala-azar in eastern Sudan. Am J Trop Med Hyg. 2003;68:10–7. [PubMed] [Google Scholar]
- 23.Grillet ME, Barrera R, Martinez JE, Berti J, Fortin MJ. Disentangling the effect of local and global spatial variation on a mosquito-borne infection in a neotropical heterogeneous environment. Am J Trop Med Hyg. 2010;82:194–201. doi: 10.4269/ajtmh.2010.09-0040. [DOI] [PMC free article] [PubMed] [Google Scholar]
- 24.Machado-Coelho GL, Assuncao R, Mayrink W, Caiaffa WT. American cutaneous leishmaniasis in Southeast Brazil: Space-time clustering. Int J Epidemiol. 1999;28:982–9. doi: 10.1093/ije/28.5.982. [DOI] [PubMed] [Google Scholar]
- 25.Vinitsky O, Ore L, Habiballa H, Cohen-Dar M. Geographic and epidemiologic analysis of the cutaneous leishmaniasis outbreak in northern Israel, 2000-2003. Isr Med Assoc J. 2010;12:652–6. [PubMed] [Google Scholar]
- 26.el-Hassan AM, Zijlstra EE. Leishmaniasis in Sudan. Cutaneous leishmaniasis. Trans R Soc Trop Med Hyg. 2001;95(Suppl 1):S1–17. doi: 10.1016/s0035-9203(01)90216-0. [DOI] [PubMed] [Google Scholar]
- 27.González C, Wang O, Strutz SE, González-Salazar C, Sánchez-Cordero V, Sarkar S. Climate change and risk of leishmaniasis in north america: Predictions from ecological niche models of vector and reservoir species. PLoS Negl Trop Dis. 2010;4:e585. doi: 10.1371/journal.pntd.0000585. [DOI] [PMC free article] [PubMed] [Google Scholar]
- 28.Desjeux P. The increase in risk factors for leishmaniasis worldwide. Trans R Soc Trop Med Hyg. 2001;95:239–43. doi: 10.1016/s0035-9203(01)90223-8. [DOI] [PubMed] [Google Scholar]
- 29.Raymond RW, McHugh CP, Witt LR, Kerr SF. Temporal and spatial distribution of leishmania mexicana infections in a population of Neotoma micropus. Mem Inst Oswaldo Cruz. 2003;98:171–80. doi: 10.1590/s0074-02762003000200002. [DOI] [PubMed] [Google Scholar]


