Abstract
Objective
We recorded intra-operative and post-operative electrically-evoked compound action potentials (ECAPs) in rhesus monkeys implanted with a vestibular neurostimulator. The objectives were to correlate the generation of slow-phase nystagmus or eye twitches induced by electrical stimulation of the implanted semicircular canal with the presence or absence of the vestibular ECAP responses, and to assess the effectiveness of ECAP monitoring during surgery to guide surgical insertion of electrode arrays into the canals.
Design
Four rhesus monkeys (a total of seven canals) were implanted with a vestibular neurostimulator modified from the Nucleus Freedom™ cochlear implant. ECAP recordings were obtained during surgery or at various intervals post-surgery using the Neural Response Telemetry™ feature of the clinical Custom Sound EP™ software. Eye movements during electrical stimulation of individual canals were recorded with a scleral search coil system in the same animals.
Results
Measurable vestibular ECAPs were observed intra-operatively or post-operatively in three implanted animals. Robust and sustained ECAPs were obtained in three monkeys at the test intervals of 0, 7, or >100 days post implantation surgery. In all three animals, stimulation with electrical pulse trains produced measurable eye movements in a direction consistent with the vestibulo-ocular reflex from the implanted semicircular canal. In contrast, electrically-evoked eye movements could not be measured in three of the seven implanted canals none of which produced distinct vestibular ECAPs. In two animals, ECAP waveforms were systematically monitored during surgery and the procedure proved crucial to the success of vestibular implantation.
Conclusions
Vestibular ECAPs exhibit similar morphology and growth characteristics to cochlear ECAPs from human cochlear implant patients. The ECAP measure is well correlated with the functional activation of eye movements by electrical stimulation post implantation surgery. The intra-operative ECAP recording technique is an efficient tool to guide the placement of electrode array into the semicircular canals.
Keywords: vestibular prosthesis, electrically-evoked compound action potential, cochlear implant, vestibular-ocular reflex, nystagmus
I. Introduction
Implantable vestibular prostheses are being developed to restore balance control for patients with vestibular dysfunctions caused by a variety of disorders or vestibular loss [1–5]. Animal experiments have shown that electrical stimulation could excite vestibular nerve fibers and produce a measurable eye movement response [1, 4, 6–11], mimicking the vestibulo-ocular-reflex (VOR), a reflex eye movement during head rotation.
Oculomotor responses are an objective measure of assessing the success of vestibular stimulation. Electrically-evoked eye movements (EEM) have been successfully reported in guinea pigs [3, 7], chinchillas [4], monkeys [1, 6, 8], cats [9] and humans [12]. These early findings suggest that peripheral electrical stimulation can provide functional input to the vestibular system, a requisite for the prosthetic control of visual stability and balance.
While the measurement of EEM is a useful and behaviorally relevant way to assess implant functionality, it is impractical for the surgical setting. Measuring eye positions requires the use of specialized sensors and other hardware while the animal’s head is restrained during the entire measurement session. Moreover, vestibular responses are best recorded in the alert animal, because the oculomotor system is sensitive to many common types of anesthesia that can suppress eye movements [9, 13, 14] or produce nystagmus unrelated to stimulation [15, 16]. However, without a reliable intra-operative measure of neural responses, improper placement of an electrode array can fail to produce any eye movement responses. Results of computational models and electrophysiological experiments [17–20] have also shown that electrode distance from the target neural fibers has a significant impact on the threshold of excitation and the amount of cross-talk between electrodes due to current spread. An intra-operative measure of the efficacy of electrode placement would be useful to enhance the success of vestibular implantation and post-surgery behavioral assessment.
The electrically-evoked compound action potential (ECAP) is a measure of the gross action potential activity generated by a population of nerve fibers in response to electrical stimulation. ECAPs from the auditory branch of the eighth nerve have been recorded intra-operatively or postoperatively from animals [21–25] and humans [26–29] with cochlear implants. Subsequently, characteristics of cochlear ECAPs such as thresholds, latencies, and growth of amplitude have been extensively studied and related to perceptual measures in human subjects [30–34]. The morphology of auditory ECAPs provides an objective measure of the excitability of the auditory nerve fiber ensemble and it has been demonstrated to be useful clinically for designing auditory prostheses [30, 35].
Modern commercial cochlear implant systems contain a built-in means of recording ECAPs using standard clinical software. However, whether the ECAP recording technology developed for cochlear implants can be applied to vestibular implantation has not been systematically studied. In a previous case report of a human patient [36] vestibular ECAPs were recorded when the electrodes of a cochlear implant were accidentally misdirected into the vestibular part of the labyrinth. If ECAPs could be reliably evoked from a vestibular implant, the method would have two potential advantages relative to measuring EEMs. First, vestibular ECAP recordings could be made intraoperatively when the subject is sedated, because the excitatory mechanisms of peripheral nerve stimulation are typically not affected by general anesthesia [37, 38]. Second, the ECAP recordings could be made quickly, allowing repeated measures to be made while the electrode array placement is adjusted.
In this paper, we describe the application of ECAPs to evaluate the functionality of intraoperative and postoperative vestibular implant stimulation in Rhesus macaque monkeys (Macca mulatta). The implants were driven by the Nucleus Freedom™ receiver-stimulator with a customized electrode array for vestibular neurostimulation. Section II of the paper presents design details of the vestibular implants and a brief description of the implantation surgery. Section II also describes the methods for collecting vestibular ECAPs and eye movement responses. Section III presents a series of vestibular ECAPs recorded intraoperatively or post-operatively and their relationship to electrically-evoked eye movement responses. Discussion and conclusions are given in Section IV. These findings suggest that the vestibular ECAP recording technique may be a valuable tool when vestibular prostheses are translated from animal models to human patients.
II. Materials and Methods
Device Design and Animal Implantation
The electrode array of the Nucleus Freedom™ cochlear implant was modified for facilitating vestibular implantation in collaboration with Cochlear Ltd (Lane Cove, Australia). The customized array had a total of 9 electrode contacts, with three contacts on each of three leads. Each electrode contact was a cylindrical band of width 0.2 mm and diameter 0.15 mm. The interelectrode spacing was 0.2 mm on each lead. A separate ball electrode served as the return ground, in addition to the shell ground of the receiver-stimulator. In a revised design, the width of the electrode bands was increased to 0.25 mm, which produces lower electrode impedances and higher maximum currents.
Four monkeys (Table 1) were implanted with the vestibular prosthesis in the right ear at the National Primate Research Center, Seattle, WA. Monkeys A, B, and D received the device with 0.2 mm diameter electrodes; monkey C had the 0.2 mm device but later received the 0.25 mm device. Mastoidectomy was performed to expose the incus and the target semicircular canals. The canals to be implanted were “blue-lined” and fenestrated adjacent to the ampullary end. Each stimulating electrode array was inserted in parallel to the lumen of the target canal, with the tip of the array pointing toward the canal’s ampulla. As shown in Table 1, we implanted the lateral canal of all four animals. In addition, we implanted the device in the posterior canal of 2 monkeys, and the superior canal of 1 monkey, for a total of seven implanted canals.
Table 1.
A list of all implanted canals of four rhesus monkeys, the status of whether vestibular ECAPs were detectable (>50 µV in N1-P1 amplitude growth), and the primary direction of eye movements that reached a minimum velocity criterion (>20 degree/sec).
| Animal | Implanted Canals | ECAP1 | Eye Movements2 |
|---|---|---|---|
| Monkey A | Lateral | Yes | Horizontal |
| Posterior | Yes 3 | Vertical | |
| Monkey B | Lateral | Yes | Horizontal |
| Monkey C | Lateral | Yes | Horizontal |
| Superior | No | None 4 | |
| Monkey D | Lateral | No | None |
| Posterior | No | None |
A minimum N1-P1 amplitude of 50 µV was adopted as threshold for indicating the presence or absences of an ECAP.
A threshold velocity of 20 dec/sec was used for determining the presence of an EEM.
High-amplitude stimulus artifacts were recorded when the stimulating and recording electrodes were both in the posterior canal. However, ECAP waveforms were observed when stimulating in the posterior canal and recording in the lateral canal.
Subthreshold EEM nystagmus could only be observed at high current levels that were close to the maximum limit of the device output.
ECAP Recording Methods
All vestibular ECAP recordings were performed with the standard clinical software—Nucleus Freedom Custom Sound EP 1.3™ provided by Cochlear Ltd [39]. In all trials, the implanted semicircular canal was typically activated using monopolar (MP) stimulation of the most proximal electrode (with respect to the ampulla) of the three-electrode array, and recorded from the most distal electrode in the same canal (except one cross-channel case, see notes of Table 1).
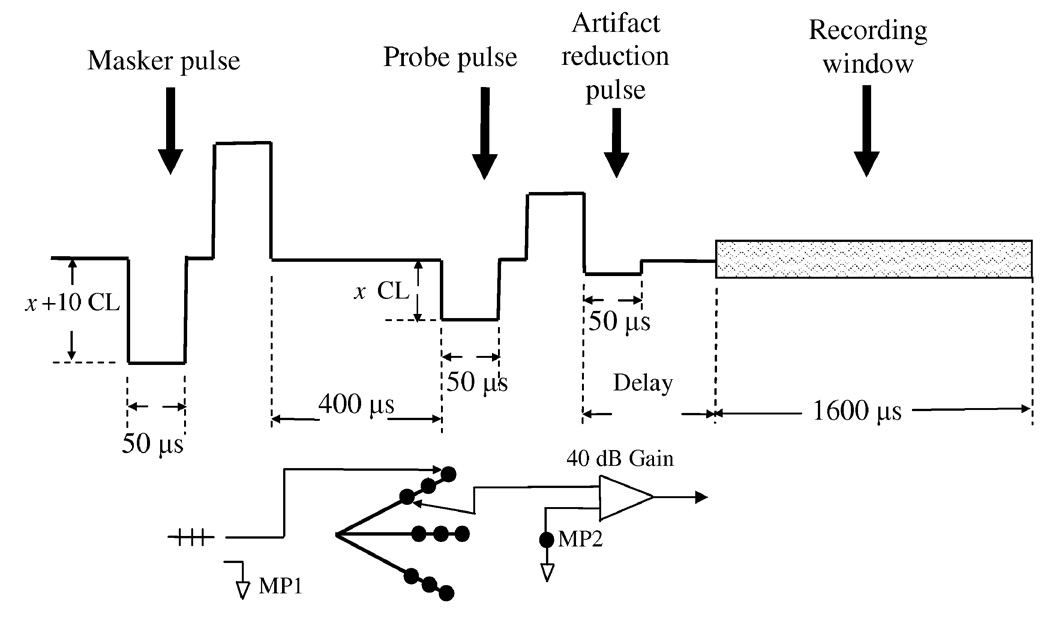
To minimize the stimulation artifacts, a forward masking paradigm [29, 40] was adopted in all vestibular ECAP recordings similar to that used in cochlear ECAP recordings. Figure 1 illustrates the experimental paradigm for artifact reduction in the vestibular ECAP recordings. The artifact reduction process consists of four phases of separate recordings [29, 40]. Recordings were averaged over 50 presentations with a repetition rate of 50–80 Hz. The amplifier gain was set at the lowest setting (40 dB) to avoid saturation.
Figure 1.
Illustration of the ECAP artifact reduction paradigm and recording settings. A four-phase forward masking paradigm was used to eliminate stimulus artifacts. The masker pulse leads the probe pulse by 400 µs and it is set to 10 CL (Clinical Level) higher. In some trials, an additional artifact reduction pulse, 50 µs long and monophasic, was inserted to further cancel the artifacts caused by the positive pulse in the probe. After the offset of pulse stimulation, with a short delay, a 16-ms long window is open for recording waveforms. Electrode settings: the vestibular prostheses have 9 intralabyinthine stimulating electrodes with 3 for each canal. During ECAP recordings, the deepest electrode served as the stimulation electrode while the most distal electrode in the same canal from this tip was set as a recording electrode. The ECAP signal was amplified by 40 dB and then sent back to the Nucleus signal processor via a wireless link. MP1 and MP2 are two separate ground electrodes.
The amplitude of the probe pulse was progressively increased by a step size of 10 clinical levels (CL) from a sub-threshold level up to the maximal safe level as determined from charge-density calculations. Clinical levels can be converted into currents in µA using the following formula:
| (1) |
where X is in the range of 0–255 CLs.
Recordings of Electrically-evoked Eye Movements
Electrically-evoked eye movements (EEMs) were measured at various intervals after each animal recovered from the implantation surgery. Tracking of horizontal and vertical eye positions was implemented with an implanted scleral eye coil and the CED Power 1401 (Cambridge Electronic Design Ltd.) data acquisition system. Each animal was seated in a dark booth and the animal’s head was fixed during experimental sessions. The animal tracked a laser LED target projected onto a surrounding drum (with a diameter of 88cm) for a food reward; The target was blanked 100 ms prior to the onset of the electrical stimulus train while fixating the target at the straight ahead position. A Nucleus Laura-34 research processor, which provides the capability of direct control over the vestibular neurostimulator, was used to communicate with the vestibular prosthesis. Customized pulse generation software was developed to drive the research processor and implanted electrodes.
We recorded two types of EEMs, eye twitches elicited by low-rate pulse trains at 2 pulses/sec (pps) and nystagmus induced by high-rate pulse trains at 100–600 pps. The direction, amplitude, and velocity of eye movements were measured in each animal as a function of stimulus intensity and pulse repetition rate. Angular eye positions and eye velocities were used to measure the evoked EEM responses. Eye velocities were calculated as the derivative of eye positions using the standard 5-point central formula in Spike2 (Cambridge Electronic Design Ltd.).
EEM-eye Twitches
To visualize the eye movements that could be elicited using the same stimuli that produce vestibular ECAP responses, low-rate pulse train stimuli (2 pulses/sec, the probe pulses only) were delivered using the Custom Sound EP. The width of each pulse was 50 µs. The stimulation current level was varied from sub-threshold levels to a maximum level below the compliance limit in the same way as during ECAP recordings.
EEM-nystagmus
High-rate biphasic pulse trains with durations of 2 seconds were constructed with the Laura-34 research processor. The pulse width for recording EEM nystagmus was set to 100 or 400 µs and the pulse rate was typically varied from 100 pps to 600 pps. A pulse train was automatically initiated by a triggering signal from the Spike2 system 100 ms after the laser target was turned off.
For the purpose of correlating EEM nystagmus with vestibular ECAPs, we defined a stimulation array as functionally active if it could produce a nystagmus having a slow phase velocity of at least 20 degrees/sec in response to a pulse train at acceptable current levels (i.e. up to the compliance limit of the electrode) and at the optimal pulse rate for the canal (typically between 300 pps and 600 pps). This criterion is at the low-end of EEM velocities that could be reliably achieved with repeated stimulus presentations.
III. Results
Table 1 summarizes results from the four monkeys. Measurable ECAPs were found in 3 of 4 lateral canals, and all three of these canals produced robust horizontal EEM nystagmus to pulse train stimulations. One posterior canal (monkey A) elicited measurable ECAPs and electrical pulse train stimulation also produced predominantly vertical eye movements. For one superior canal (monkey C) distinct ECAPs could not be measured and the EEM nystagmus failed to reach the slow phase threshold criterion of 20 deg/sec. As noted in the table, however, this canal did produce a subthreshold and mostly vertical EEM at stimulation levels close to the maximum allowable current. Finally, monkey D failed to show either ECAP or EEM responses for either implanted canal.
Vestibular ECAPs Recorded in Three Implanted Monkeys
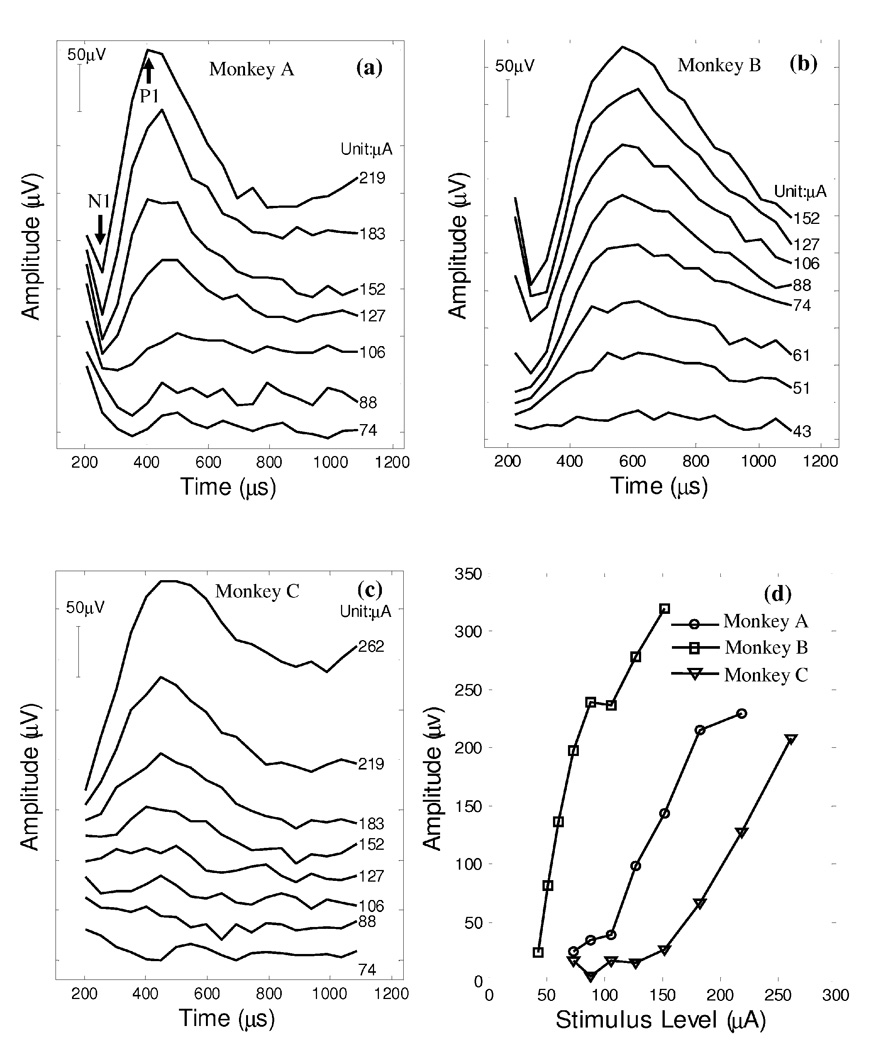
Figure 2 presents typical vestibular ECAP waveforms (panels a–c), as well as their amplitude growth functions (panel d), measured postoperatively from the lateral canals of three monkeys.
Figure 2.
Post-operative ECAP recordings from the lateral canal of three implanted animals, monkey A (panel a), monkey B (panel b) and monkey C (panel c). Panel d plots the N1-P1 amplitude growth functions of these three ECAP series.
Monkey A
Figure 2a presents the recorded vestibular ECAP waveforms collected from the lateral canal of this animal three months after implant surgery. The ECAP magnitude exhibited a strong pattern of response growth as the amplitude of the probe pulse was gradually increased from 74 µA to 219 µA. The P1 (the 1st positive peak) occurred at around 500 µs under the 106-µA stimulation condition, and the N1-P1 (N1: the 1st negative peak) pattern became progressively more distinct as the pulse amplitude was further increased from 127 µA up to 219 µA. The latency of P1 decreased from 500 µs to 400 µs as current increased. The ECAP threshold of monkey A was close to 106 µA as revealed by the N1-P1 growth function (panel d).
Monkey B
Figure 2b presents ECAP recordings 1-week post implant surgery. The response pattern of this monkey was similar to monkey A, but with a relatively lower activating threshold around 51 µA and a larger P1 latency between 560 and 610 µs.
Monkey C
Figure 2c presents vestibular ECAP recordings collected 1-week post the implantation surgery. The amplitude of P1 response was progressively increased when the stimulation current was above the activating threshold (~152 µA).
For comparison across animals, the N1-P1 amplitude growth was calculated by subtracting the N1 amplitude from the P1 amplitude of each ECAP waveform. The growth functions of all three animals are plotted in Figure 2d. The ECAP amplitudes exhibited a monotonic and roughly linear increasing pattern as stimulus current was gradually increased above the respective activating threshold. A linear regression of data points above the activating threshold was conducted on each ECAP series. The slopes of the ECAP amplitude growth functions were 2.23 µV/µA (A), 2.12 µV/µA (B), and 0.89 µV/µA (C) respectively. As discussed above, the ECAP thresholds of the three monkeys varied from as low as 51 µA to 152 µA.
Monkey D
The monkey failed to show ECAPs from stimulation of either implanted canal. This animal was implanted with a vestibular prosthesis without ECAP monitoring during surgery. In post-surgery tests, no distinguishable ECAP responses can be measured at various stimulation settings. The ECAP traces contained large artifacts or remained flat at all stimulation current levels up to 140 CL.
EEM Responses
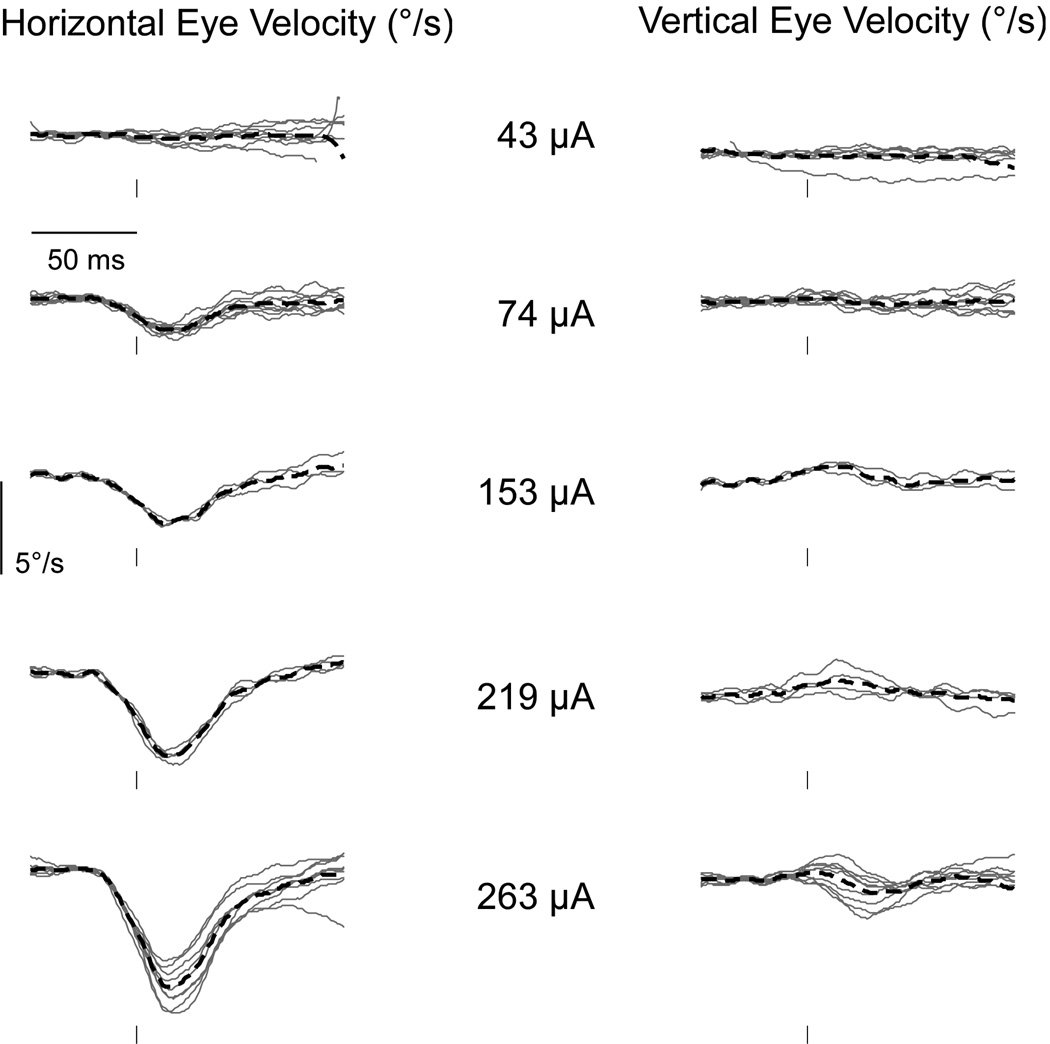
The three animals for which ECAPs could be measured from the lateral canals produced robust and repeatable eye movements in response to pulse trains. Examples of eye movements from monkey B elicited by single biphasic pulses are shown in Figure 3. The stimuli were a series of low-rate (10 pps) pulse trains at current amplitudes ranging from 43 to 263 µA. At each current level, 10 brief segments of the derived horizontal (left column) and vertical (right column) eye velocities, beginning 50 ms before and 100 ms after consecutive pulses, were aligned and superimposed. Stimulation induced no consistent eye movements at 43 µA, but horizontal eye movements of increasing velocity were observed when the pulse strength rose above 74 µA. In contrast, the same pulses elicited much smaller velocities in the vertical direction. The threshold of activation for the horizontal eye movements (between 43 and 74 µA) was close to the ECAP threshold (~51 µA; Figures 2b & 2d).
Figure 3.
Horizontal and vertical eye velocity traces from monkey B in response to single electrical pulses. Each panel depicts individual eye velocity traces starting 50 ms before the stimulus pulse at intensities from 43 to 263 µA. In addition, the thick dashed lines indicate the average eye velocity traces for each current level. The stimulating electrode was implanted in the lateral canal, resulting in predominantly horizontal eye deviations.
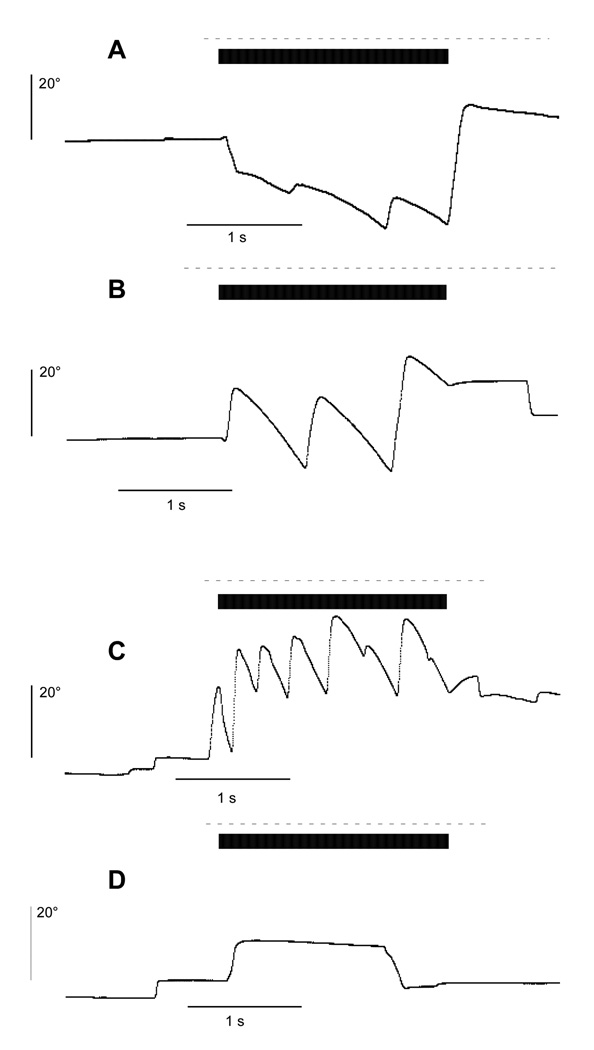
Figure 4 presents examples of horizontal eye movement responses collected from the lateral canals of all 4 animals. Monkeys A–C were stimulated briefly with a 2s-long pulse burst at 300 pps. The pulse amplitude was set differently for each animal, to 100 µA (A), 20 µA (B) and 100 µA (C), to obtain measurable eye movements. For each of these three animals, the eye velocity increased following the onset of the pulse train and developed into a nystagmus that continued through the stimulation period, The nystagmus was characterized by several slow-phase leftward eye movements (down in the figure) interspersed with fast phases in the opposite direction. In contrast, monkey D did not exhibit a nystagmus, despite stimulation at a relatively high current and pulse rate (100 µA at 600 pps). As discussed previously, this animal also did not exhibit a measurable ECAP.
Figure 4.
Horizontal eye position traces during lateral canal stimulation of monkeys A–D with a 2s-long pulse train. The black bars indicate the duration of the stimulation pulse train and the dashed lines mark the off period of the laser target. Electrically-evoked slow-phase nystagmus was observed in three animals (monkeys A–C) but not in monkey D. The current amplitude, pulse rate and pulse width were set individually for each animal at: (A) 100 µA, 300 pps, 400 µs; (B) 20 µA, 300 pps, 100 µs; (C) 100 µA, 300 pps, 100 µs; and (D) 100 µA, 600 pps, 400 µs.
Electrode Positioning with the Assistance of Intraoperative ECAP Monitoring
The presence of ECAPs coupled with reliable EEM responses in the first implanted monkey A and the lack of measurable vestibular ECAPs after unsuccessful vestibular implantation (e.g. monkey D) points toward a potential correlation between ECAP responses and electrically-evoked eye movements.
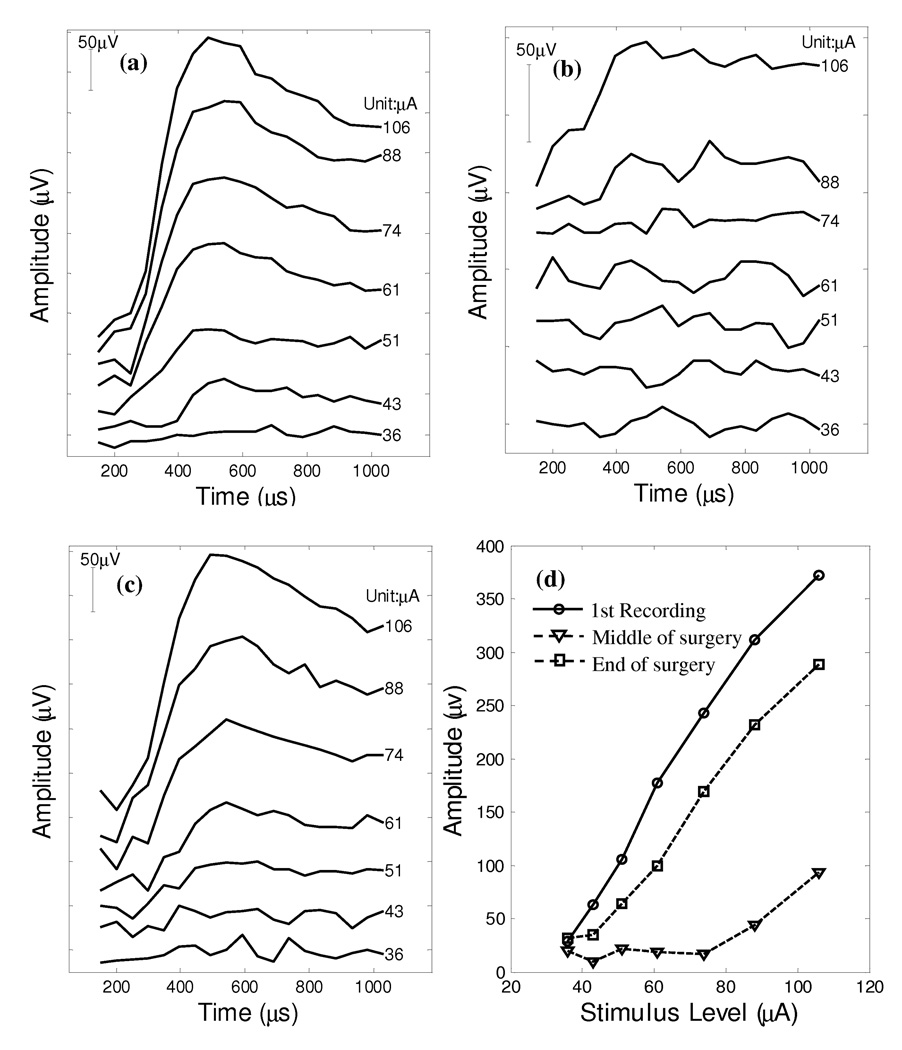
To test this hypothesis, we applied vestibular ECAP recording intraoperatively to monkey B for the purpose of guiding surgical insertion of the stimulating electrode array. The first ECAP series (Figure 5a) was immediately collected when the electrode array was fully inserted in the lateral canal of monkey B during surgery. A significant increase in the N1-P1 amplitude was observed when the current level of the probe pulse was gradually varied from 36 µA to 106 µA.
Figure 5.
ECAP recordings from monkey B collected during the implantation surgery. Panel (a): the electrode array was fully inserted in the lateral canal at the beginning of the surgery; (b): loss of ECAPs when the electrode array was partially pulled out; (c): recovery of ECAPs at the end of the surgery after securing the electrodes using glue; (d): N1-P1 amplitude growth functions of the three recording series.
However, the electrode position was not fixed when measuring the first ECAP signals. When the electrode was withdrawn less than 2mm (Figure 5b), the vestibular ECAPs were lost despite stimulation at exactly the same setting as the first trial. With current pulse amplitude up to 74 µA, no vestibular neural responses can be found in these recorded ECAP waveforms. The loss of vestibular ECAP in this trial indicates that vestibular ECAP recording is an extremely sensitive measure of the proximity of the electrode array to the target neural fibers.
With the assistance of vestibular ECAP recording, the electrode was then repositioned to maximize the ECAP. ECAP responses were recovered when the electrode array was fully inserted in the lateral canal of this animal. The electrode array at full insertion depth was then secured with a 4-0 nylon suture at the tegmen mastoidii and cyanoacrylate tissue glue in the mastoid. At the end of the surgery, a series of ECAPs were collected and the last ECAP data are shown in Figure 5c. The ECAP responses recovered with a similar amplitude growth pattern as compared to the data collected in the first trial (Figure 5a).
For comparison, all three amplitude growth functions were plotted in Figure 5d. The 1st trial had greater responses when the same level of currents was applied. The slopes of amplitude growth are 4.99 µV/µA and 4.22 µV/µA respectively for the first and last ECAP recording series. However, when the electrode was withdrawn, both the absolute amplitude of the recorded ECAPs and the slope of ECAP amplitude growth (2.7 µV/µA) were substantially smaller than the other two ECAP series.
EEM responses also demonstrated that the vestibular implant on monkey B is physiologically activating the vestibular nerve. It consistently produced nystagmus when pulse trains were delivered to the electrodes.
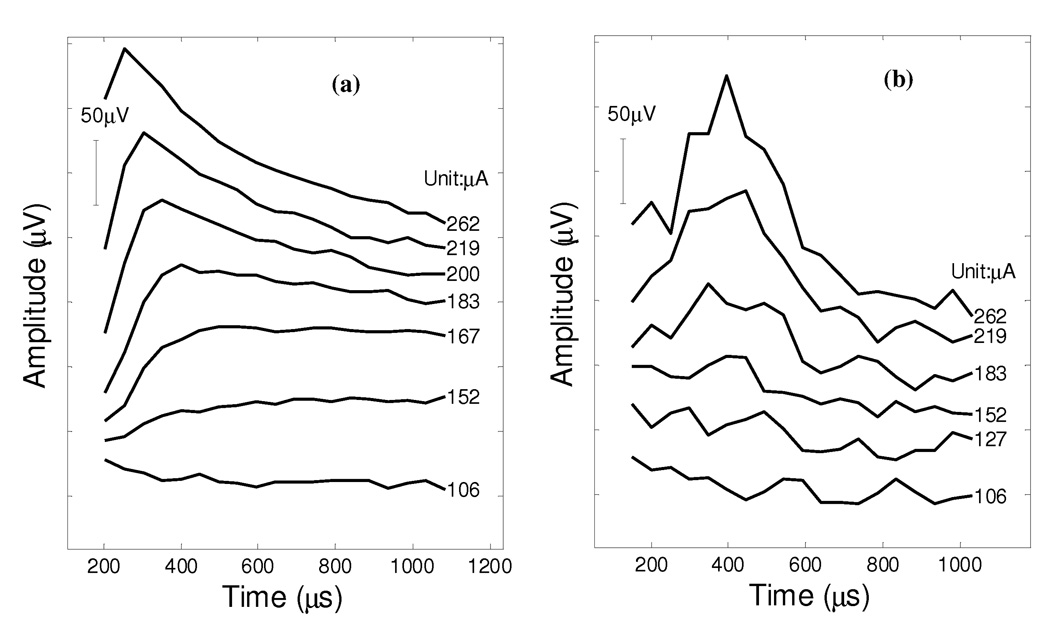
The ECAP monitoring procedure was also performed on monkey C during a revision surgery. This monkey showed abnormal ECAP series waveforms following an initial surgery. Figure 6a presents the compound action potentials measured 4 months following the initial surgery. It required a larger amount of current to evoke any ECAP-like responses and these ECAPs had atypical P1 latencies. Only weak EEM responses were produced by implanted prosthesis in this animal following the initial surgery, even at larger pulse stimulation levels.
Figure 6.
Panel (a): the ECAP series collected on monkey C which had atypical P1 latencies and required high levels of current stimulation to elicit neural responses, possibly due to the improper positioning of the vestibular electrode array. This animal failed to show distinct EEM responses when pulse trains were applied. Panel (b): normal ECAP responses collected on the same animal at the end of a revision surgery. Eye movements were elicited in response electrical stimulation after the animal recovered from the revision surgery.
A subsequent revision surgery was performed on this animal to replace the poorly performing implant. In the revision surgery, this monkey was implanted with the modified electrode array (0.25mm leads). ECAP responses were monitored periodically to guide the positioning of the electrode array as described above. Figure 6b shows the recorded ECAP series at the end of the revision surgery, after fixing the electrode array in the lateral canal with the help of ECAP monitoring. This monkey showed a higher activation threshold near 183 µA. The success of the surgical placement of the stimulation electrode array was proved by subsequent EEM recordings post surgery as displayed in Figure 4.
Stability of Vestibular ECAPs
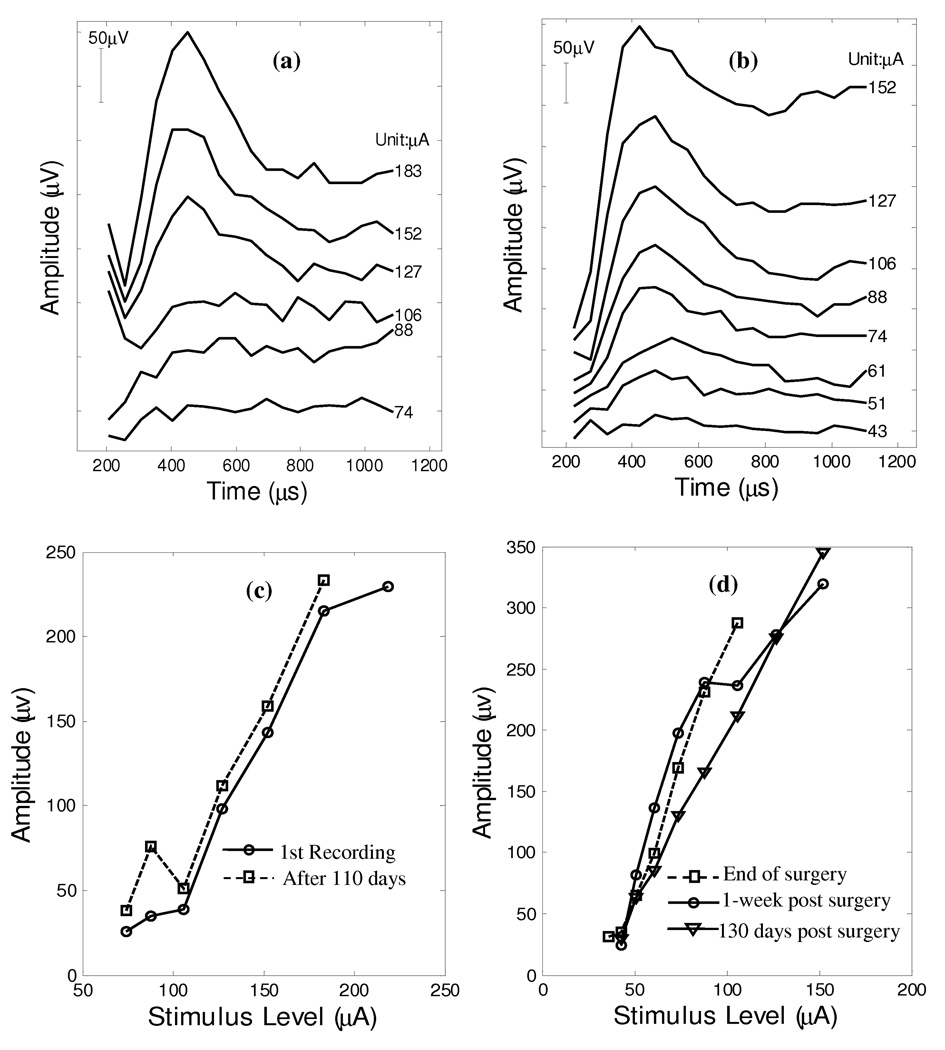
Figure 7a presents the last vestibular ECAP series from monkey A 110 days after the first measurements and Figure 7c shows the corresponding N1-P1 amplitude growth functions. The later ECAP waveforms closely resemble those from the first trial (Figure 2a). ECAPs collected from monkey A at two separate time-points suggested that the vestibular ECAP threshold and amplitude growth functions were well maintained over a period of 110 days. Figure 7c presents the N1-P1 amplitude growth as a function of stimulus level for both data collection sessions. No clear neural responses can be observed below 106 µA for both trials. The slopes are 2.23 µV/µA and 2.32 µV/µA, respectively for the first and the last trial.
Figure 7.
ECAP recordings were repeated on monkey A (Panel a) 110 days past the initial collection and on monkey B (Panel b) 130 days post surgery. The 110-day N1-P1 amplitude growth function of monkey A is plotted on Panel c (□) together with a replot of the growth function from the 1st trial (○) (Figure 2). Similarly, Panel d shows the N1-P1 amplitude growth function of ECAPs collected at various periods; i.e., immediately following implantation surgery (□), 1-week post surgery (○), 130 days post surgery (▽).
Similarly, the vestibular ECAP recording from monkey B was repeated 1-week and 130 days (Figure 7b) post the implantation surgery respectively. Figure 7d shows the amplitude growth functions at the end of the surgery (□), 1-week post surgery (○) and 130 days post surgery (▽). The response pattern of monkey B was well preserved after 1-week of recovery from the surgery and maintained after 130 days. With regard to amplitude growth, the recording series at the 1-week interval is similar to that at the end of the surgery (4.25 vs. 4.22 µV/µA). A smaller slope at 2.8 µV/µA was also observed for the 130-days recordings.
IV. Discussion
In this paper, we demonstrated that similar vestibular ECAP responses can be collected from the vestibular nerve using the same stimulation paradigm as in cochlear implants. The vestibular ECAP response, which has not previously been systematically recorded in the vestibular end organ, displays many of the characteristics of the compound action potential recorded in the cochlea.
Vestibular ECAP recordings collected from monkeys A, B and C showed consistent patterns in waveform morphology, response latency and amplitude growth comparable to previously recorded cochlear ECAPs in human patients [27, 28, 31, 33, 41]. The N1 latency of the vestibular ECAPs is between 200 µs and 400 µs and the P1 peak occurs after 400 to 600 µs, which are both consistent with observations in cochlear ECAPs.
Similar amplitude growth functions were found in vestibular ECAPs compared to cochlear ECAPs. The N1-P1 amplitude increases linearly as the current level is steadily increased above the activation threshold. The slope of the amplitude growth functions derived from the vestibular ECAPs is from 2.2 µV to 4.99 µV per µA, which is comparable to the ECAP growth slopes obtained in cochlear recordings [33].
Previous data from human patients showed that the ECAP threshold of cochlear stimulation is in the range of 175 CL to 190 CL (or 413 µA to 541 µA) [28, 33]. However, the vestibular ECAP recordings indicated a much lower threshold, between 53 µA and 183 µA. The difference in ECAP threshold might reflect the closer proximity of the stimulating electrodes to the target nerve fibers in vestibular implantation.
Vestibular ECAP responses were observed in 3 monkeys during stimulation by a vestibular neurostimulator. Monkeys A and B showed progressively larger vestibular ECAPs with increasing stimulus current amplitude. Monkeys A and B had sustained vestibular ECAPs over a long period of time (>110 and 130 days). Both intra-operative and post-operative vestibular ECAP recordings in monkeys B and C highlight the potential role of vestibular ECAP data collection in the placement of the electrode array within the semicircular canals. The recovery of monkey B’s vestibular ECAPs with repositioning of the electrode suggests that the vestibular ECAP recordings can provide useful feedback on the positioning of the electrode relative to the target nerve fibers during surgery.
Vestibular ECAP data from four animals suggested that the ECAP amplitude growth function and ECAP threshold are highly related to their EEM responses driven by current stimulation. The other two implant procedures (initial implantation in monkey C and implantation in monkey D) failed to produce either vestibular ECAP or EEM responses. Vestibular ECAP recordings might be useful for finding the threshold of activation in a manner similar to such recordings from cochlear implants. The three monkeys with measurable ECAPs showed different activation threshold, 51 µA (B), 106 µA (A), and 183 µA (C). Monkeys A and B also consistently showed a very robust behavioral response to electrical stimulation, while monkey C showed a very weak EEM response with an unsuccessful initial surgery and a strong EEM responses after a revision surgery. Even the lowest current limit (~20 µA) can elicit nystagmus on monkey B. These findings suggest that vestibular ECAP recording may offer an effective intraoperative prediction of the physiologic success of vestibular implantation. The likely correlation between the neurophysiologic ECAP activation threshold and EEM threshold indicates that the ECAP measure can be potentially used to predict the EEM threshold and thus may provide a useful tool for surgery and clinical fitting of a vestibular implant.
Although we have observed that activating electrodes in the lateral or posterior canal predominantly produced corresponding horizontal or vertical eye movements, measurable crosstalk still exists from the unstimulated canal (Fig. 3). The crosstalk is likely inevitable at high levels due to the current spread of electrical stimulation. Vestibular ECAP monitoring can help optimize surgical placement of the stimulation electrode array into the target semicircular canals as demonstrated in two monkeys (Figs. 5&6). The procedure can potentially minimize crosstalk between canals. To further eliminate canal crosstalk, one potential method is to use focused stimulation (e.g. bipolar or tripolar mode) which produces spatially restricted current fields compared to the monopolar stimulation used in the present studies. The vestibular neurostimulators used in the present study were designed to work under bipolar or tripolar stimulation mode and the effect of stimulation mode on canal crosstalk minimization will be further investigated in the future.
In summary, the recording technique used in the present study is analogous to ECAP recordings that are widely used in cochlear implant research and clinical practice. This gives us a convenient tool to evaluate whether the implanted electrode is driving a neural response. For the purpose of developing vestibular prostheses for human patients, these findings suggest that intraoperative vestibular ECAP recording should be considered to optimize electrode placement in vestibular implant surgery.
Acknowledgements
We would like to thank Dr. Paul Abbas for providing valuable insights on setting appropriate parameters for artifact reductions in ECAP recordings, and Elyse Jameyson for assisting data collection with the Custom Sound EP software. Colin Irwin from Cochlear, Ltd provided extensive assistance with software tools. We also thank the anonymous reviewers for their helpful comments.
This project is supported by NIH contract HHS-N-260-2006-00005-C (JOP).
This study is partly supported by Cochlear, Ltd, the manufacturer of the device being studied. Dr Rubinstein is a paid consultant for Cochlear, Ltd.
Footnotes
Publisher's Disclaimer: This is a PDF file of an unedited manuscript that has been accepted for publication. As a service to our customers we are providing this early version of the manuscript. The manuscript will undergo copyediting, typesetting, and review of the resulting proof before it is published in its final citable form. Please note that during the production process errors may be discovered which could affect the content, and all legal disclaimers that apply to the journal pertain.
References
- 1.Phillips JO, Bierer S, Fuchs AF, Kanek CRS, Ling L, Nie K, Rubinstein JT. Neurophysiological Studies of Electrical Stimulation for the Vestibular Nerve. NIH Quarterly Progress Report. (1–11):2007–2009.
- 2.Shkel AM, Zeng FG. An electronic prosthesis mimicking the dynamic vestibular function. Audiol Neurootol. 2006;11(2):113–122. doi: 10.1159/000090684. [DOI] [PubMed] [Google Scholar]
- 3.Gong W, Merfeld DM. Prototype neural semicircular canal prosthesis using patterned electrical stimulation. Ann Biomed Eng. 2000;28(5):572–581. doi: 10.1114/1.293. [DOI] [PubMed] [Google Scholar]
- 4.Della Santina CC, Migliaccio AA, Patel AH. A multichannel semicircular canal neural prosthesis using electrical stimulation to restore 3-d vestibular sensation. IEEE Trans Biomed Eng. 2007;54(6 Pt 1):1016–1030. doi: 10.1109/TBME.2007.894629. [DOI] [PMC free article] [PubMed] [Google Scholar]
- 5.Wall C, 3rd, Merfeld DM, Rauch SD, Black FO. Vestibular prostheses: the engineering and biomedical issues. J Vestib Res. 2002;12(2–3):95–113. [PubMed] [Google Scholar]
- 6.Gong W, Haburcakova C, Merfeld DM. Vestibulo-ocular responses evoked via bilateral electrical stimulation of the lateral semicircular canals. IEEE Trans Biomed Eng. 2008;55(11):2608–2619. doi: 10.1109/TBME.2008.2001294. [DOI] [PMC free article] [PubMed] [Google Scholar]
- 7.Merfeld DM, Gong W, Morrissey J, Saginaw M, Haburcakova C, Lewis RF. Acclimation to chronic constant-rate peripheral stimulation provided by a vestibular prosthesis. IEEE Transactions on Biomedical Engineering. 2006;53(11):2362–2372. doi: 10.1109/TBME.2006.883645. [DOI] [PubMed] [Google Scholar]
- 8.Merfeld DM, Haburcakova C, Gong W, Lewis RF. Chronic vestibulo-ocular reflexes evoked by a vestibular prosthesis. IEEE Trans Biomed Eng. 2007;54(6 Pt 1):1005–1015. doi: 10.1109/TBME.2007.891943. [DOI] [PubMed] [Google Scholar]
- 9.Cohen B, Suzuki JI, Bender MB. Nystagmus induced by electrical stimulation of the ampullary nerves. Acta Oto-Laryngol. 1965;60:422–436. [Google Scholar]
- 10.Fridman GY, Davidovics NS, Dai C, Migliaccio AA, Della Santina CC. Vestibulo-Ocular Reflex Responses to a Multichannel Vestibular Prosthesis Incorporating a 3D Coordinate Transformation for Correction of Misalignment. J Assoc Res Otolaryngol. 2010 doi: 10.1007/s10162-010-0208-5. (in press). [DOI] [PMC free article] [PubMed] [Google Scholar]
- 11.Della Santina C, Migliaccio A, Patel A. Electrical stimulation to restore vestibular function development of a 3-d vestibular prosthesis. Conf Proc IEEE Eng Med Biol Soc. 2005;7:7380–7385. doi: 10.1109/IEMBS.2005.1616217. [DOI] [PMC free article] [PubMed] [Google Scholar]
- 12.Wall C, 3rd, Kos MI, Guyot JP. Eye movements in response to electric stimulation of the human posterior ampullary nerve. Ann Otol Rhinol Laryngol. 2007;116(5):369–374. doi: 10.1177/000348940711600509. [DOI] [PubMed] [Google Scholar]
- 13.Favilla M, Ghelarducci B, La Noce A, Starita A. Phase changes induced by ketamine in the vertical vestibulo-ocular reflex in the rabbit. Brain Res. 1981;224(1):213–217. doi: 10.1016/0006-8993(81)91136-7. [DOI] [PubMed] [Google Scholar]
- 14.Eckmiller R, Mackeben M. Functional changes in the oculomotor system of the monkey at various stages of barbiturate anesthesia and alertness. Pflugers Arch. 1976;363(1):33–42. doi: 10.1007/BF00587399. [DOI] [PubMed] [Google Scholar]
- 15.Mettens P, Godaux E, Cheron G. Effects of ketamine on ocular movements of the cat. J Vestib Res. 1990;1(4):325–338. [PubMed] [Google Scholar]
- 16.Porro CA, Biral GP, Benassi C, Cavazzuti M, Baraldi P, Lui F, Corazza R. Neural circuits underlying ketamine-induced oculomotor behavior in the rat: 2-deoxyglucose studies. Exp Brain Res. 1999;124(1):8–16. doi: 10.1007/s002210050594. [DOI] [PubMed] [Google Scholar]
- 17.Cohen LT. Practical model description of peripheral neural excitation in cochlear implant recipients: 1. Growth of loudness and ECAP amplitude with current. Hear Res. 2009;247(2):87–99. doi: 10.1016/j.heares.2008.11.003. [DOI] [PubMed] [Google Scholar]
- 18.Rubinstein JT. An introduction to the biophysics of the electrically evoked compound action potential. Int J Audiol. 2004;43(Suppl 1):S3–S9. [PubMed] [Google Scholar]
- 19.Rubinstein JT, Della Santina CC. Development of a biophysical model for vestibular prosthesis research. J Vestib Res. 2002;12(2–3):69–76. [PubMed] [Google Scholar]
- 20.Mino H, Rubinstein JT, Miller CA, Abbas PJ. Effects of electrode-to-fiber distance on temporal neural response with electrical stimulation. IEEE Trans Biomed Eng. 2004;51(1):13–20. doi: 10.1109/TBME.2003.820383. [DOI] [PubMed] [Google Scholar]
- 21.Stypulkowski PH, van den Honert C. Physiological properties of the electrically stimulated auditory nerve. I. Compound action potential recordings. Hear Res. 1984;14(3):205–223. doi: 10.1016/0378-5955(84)90051-0. [DOI] [PubMed] [Google Scholar]
- 22.Brown CJ, Abbas PJ. Electrically evoked whole-nerve action potentials: parametric data from the cat. J Acoust Soc Am. 1990;88(5):2205–2210. doi: 10.1121/1.400117. [DOI] [PubMed] [Google Scholar]
- 23.Jeng FC, Abbas PJ, Brown CJ, Miller CA, Nourski KV, Robinson BK. Electrically evoked auditory steady-state responses in Guinea pigs. Audiol Neurootol. 2007;12(2):101–112. doi: 10.1159/000097796. [DOI] [PubMed] [Google Scholar]
- 24.Nagel D. Compound action potential of the cochlear nerve evoked electrically. Electrophysiological study of the acoustic nerve (guinea pig) Arch Otorhinolaryngol. 1974;206(4):293–298. doi: 10.1007/BF00460282. [DOI] [PubMed] [Google Scholar]
- 25.Matsuoka AJ, Abbas PJ, Rubinstein JT, Miller CA. The neuronal response to electrical constant-amplitude pulse train stimulation: evoked compound action potential recordings. Hear Res. 2000;149(1–2):115–128. doi: 10.1016/s0378-5955(00)00172-6. [DOI] [PubMed] [Google Scholar]
- 26.Abbas PJ, Brown CJ, Shallop JK, Firszt JB, Hughes ML, Hong SH, Staller SJ. Summary of results using the nucleus CI24M implant to record the electrically evoked compound action potential. Ear Hear. 1999;20(1):45–59. doi: 10.1097/00003446-199902000-00005. [DOI] [PubMed] [Google Scholar]
- 27.Brown CJ, Abbas PJ, Gantz B. Electrically evoked whole-nerve action potentials: data from human cochlear implant users. J Acoust Soc Am. 1990;88(3):1385–1391. doi: 10.1121/1.399716. [DOI] [PubMed] [Google Scholar]
- 28.Brown CJ, Abbas PJ, Gantz BJ. Preliminary experience with neural response telemetry in the nucleus CI24M cochlear implant. Am J Otol. 1998;19(3):320–327. [PubMed] [Google Scholar]
- 29.Gantz BJ, Brown CJ, Abbas PJ. Intraoperative measures of electrically evoked auditory nerve compound action potential. Am J Otol. 1994;15(2):137–144. [PubMed] [Google Scholar]
- 30.Abbas PJ, Hughes ML, Brown CJ, Miller CA, South H. Channel interaction in cochlear implant users evaluated using the electrically evoked compound action potential. Audiol Neurootol. 2004;9(4):203–213. doi: 10.1159/000078390. [DOI] [PubMed] [Google Scholar]
- 31.Brown CJ, Hughes ML, Luk B, Abbas PJ, Wolaver A, Gervais J. The relationship between EAP and EABR thresholds and levels used to program the nucleus 24 speech processor: data from adults. Ear Hear. 2000;21(2):151–163. doi: 10.1097/00003446-200004000-00009. [DOI] [PubMed] [Google Scholar]
- 32.Hughes ML, Abbas PJ, Brown CJ, Gantz BJ. Using electrically evoked compound action potential thresholds to facilitate creating MAPs for children with the Nucleus CI24M. Adv Otorhinolaryngol. 2000;57:260–265. doi: 10.1159/000059125. [DOI] [PubMed] [Google Scholar]
- 33.Hughes ML, Brown CJ, Abbas PJ, Wolaver AA, Gervais JP. Comparison of EAP thresholds with MAP levels in the nucleus 24 cochlear implant: data from children. Ear Hear. 2000;21(2):164–174. doi: 10.1097/00003446-200004000-00010. [DOI] [PubMed] [Google Scholar]
- 34.Craddock L, Cooper H, Heyning P, Vermeire K, Davies M, Patel J, Cullington H, Ricaud R, Brunelli T, Knight M, Plant K, Cafarelli Dees D, Murray B. Comparison between NRT-based MAPs and behaviourally measured MAPs at different stimulation rates - a multicentre investigation. Cochlear Implants Int. 2003;4(4):161–170. doi: 10.1179/cim.2003.4.4.161. [DOI] [PubMed] [Google Scholar]
- 35.Miller CA, Abbas PJ, Nourski KV, Hu N, Robinson BK. Electrode configuration influences action potential initiation site and ensemble stochastic response properties. Hear Res. 2003;175(1–2):200–214. doi: 10.1016/s0378-5955(02)00739-6. [DOI] [PubMed] [Google Scholar]
- 36.Pau H, Parker A, Sanli H, Gibson WP. Displacement of electrodes of a cochlear implant into the vestibular system: intra- and postoperative electrophysiological analyses. Acta Otolaryngol. 2005;125(10):1116–1118. doi: 10.1080/00016480510038554. [DOI] [PubMed] [Google Scholar]
- 37.Miller CA, Brown CJ, Abbas PJ, Chi SL. The clinical application of potentials evoked from the peripheral auditory system. Hear Res. 2008;242(1–2):184–197. doi: 10.1016/j.heares.2008.04.005. [DOI] [PubMed] [Google Scholar]
- 38.van Wermeskerken GK, van Olphen AF, van Zanten GA. A comparison of intra- versus post-operatively acquired electrically evoked compound action potentials. Int J Audiol. 2006;45(10):589–594. doi: 10.1080/14992020600833189. [DOI] [PubMed] [Google Scholar]
- 39.Briaire JJ, Frijns JH. Unraveling the electrically evoked compound action potential. Hear Res. 2005;205(1–2):143–156. doi: 10.1016/j.heares.2005.03.020. [DOI] [PubMed] [Google Scholar]
- 40.Miller CA, Abbas PJ, Brown CJ. An improved method of reducing stimulus artifact in the electrically evoked whole-nerve potential. Ear Hear. 2000;21(4):280–290. doi: 10.1097/00003446-200008000-00003. [DOI] [PubMed] [Google Scholar]
- 41.Hughes ML, Stille LJ. Psychophysical and physiological measures of electrical-field interaction in cochlear implants. J Acoust Soc Am. 2009;125(1):247–260. doi: 10.1121/1.3035842. [DOI] [PMC free article] [PubMed] [Google Scholar]


