

Abstract
A novel class of photoreceptors, the intrinsically photosensitive retinal ganglion cells (ipRGCs), expresses the photopigment melanopsin and drives non-image-forming responses to light such as circadian photoentrainment, the pupillary light reflex, and suppression of nocturnal melatonin production in the pineal. Because dendrites from one subclass of these cells – the M1-type ipRGCs – make presumptive synaptic contacts at sites of dopamine release from dopaminergic amacrine cells, they are prime targets for modulation by dopamine, a neuromodulator implicated in retinal circadian rhythms and light adaptation. In patch-clamp recordings from ipRGCs in intact rat retinas, dopamine attenuated the melanopsin-based photocurrent. We confirmed that this was the result of direct action on ipRGCs by replicating the effect in dissociated ipRGCs that were isolated from influences of other retinal neurons. In these recordings, the D1-family dopamine receptor agonist SKF38393 attenuated the photocurrent, caused a modest depolarization, and reduced the input resistance of ipRGCs. The D2-family agonist quinpirole had no effect on the photocurrent. Single-cell RT-PCR revealed that the majority of ipRGCs tested expressed drd1a, the gene coding for the D1a dopamine receptor. This finding was supported by immunohistochemical localization of D1a receptor protein in melanopsin-expressing ganglion cells. Finally, the adenylate cyclase activator forskolin, applied in combination with the phosphodiesterase inhibitor IBMX, mimicked the effects of SKF38393 on the ipRGC photocurrent, membrane potential, and input resistance, consistent with a D1-receptor signaling pathway. These data suggest that dopamine, acting via D1-family receptors, alters the responses of ipRGCs and thus, of non-image-forming vision.
Keywords: Intrinsically photosensitive retinal ganglion cells (ipRGCs), retina, melanopsin, dopamine, D1 receptor, cyclic AMP (cAMP), Rattus norvegicus
Introduction
Recent work has described a third mammalian photoreceptor – the intrinsically photosensitive retinal ganglion cell (ipRGC) – that is responsible for signaling irradiance information for non-image-forming visual processes such as circadian photoentrainment and the pupillary light reflex (Berson et al., 2002; Hattar et al., 2002). The axons of ipRGCs comprise the retinohypothalamic tract and make synaptic contacts in non-image forming visual areas such as the suprachiasmatic nucleus (SCN), intergeniculate leaflet, and olivary pretectal nucleus (Hattar et al., 2006). ipRGCs express the photopigment melanopsin and, unlike rods and cones, depolarize in response to light following activation of a phototransduction cascade involving Gq/11 and phospholipase C, resembling that of the rhabdomeric photoreceptors in Drosophila (Warren et al., 2006; Hartwick et al., 2007; Sekaran et al., 2007; Graham et al., 2008).
Lighting history can shift the sensitivity of melanopsin-driven light responses in a manner consistent with cell-autonomous “photoreceptor adaptation” (Wong et al., 2005). However, adaptation in the retina is also mediated by actions of the neuromodulator dopamine (DA; Witkovsky, 2004). Retinal DA levels are elevated during the day by both light-driven and circadian mechanisms, and this allows the retina to anticipate and compensate for diurnal changes in luminance (Witkovsky, 2004). DA is produced by a population of dopaminergic amacrine/interplexiform cells (DACs) that express tyrosine hydroxylase, the rate-limiting enzyme in DA synthesis, and reside on the inner border of the inner nuclear layer (Witkovsky, 2004).
Convergent evidence suggests that ipRGCs may be subject to modulation by DA. The processes of DACs have been shown to tightly costratify with those of M1-type ipRGCs in the outermost sublamina of the inner plexiform layer. At points of close apposition between the two, DAC processes express a vesicular monoamine transporter that marks sites of DA release (Vugler et al., 2007; Østergaard et al., 2007). Retrograde transsynaptic viral labeling has also suggested the presence of direct synaptic inputs from DACs to ipRGCs (Viney et al., 2007). Finally, systemic administration of a DA receptor agonist evokes dose-dependent increases in retinal levels of melanopsin (opn4) mRNA, and melanopsin immunoreactive ganglion cells appear to contain mRNA for D2 DA receptors (Sakamoto et al., 2005).
In this study we asked whether DA can act directly on ipRGCs to modulate their intrinsic, melanopsin-driven photocurrent. Patch-clamp recordings of rat ipRGCs show that DA acts at D1 receptors to attenuate the ipRGC photocurrent and alter ipRGC electrical membrane properties. Additionally, using single-cell reverse-transcription polymerase chain reaction (RT-PCR) and immunohistochemistry we show that ipRGCs express D1-family DA receptors encoded by the drd1a gene. Thus, dopaminergic modulation of the ipRGC photocurrent may be a major contributor to circadian and/or light-adaptive modulation of non-image-forming visual networks.
Materials and Methods
Retrograde labeling and retinal dissociation
All animal procedures were conducted in accordance with National Institutes of Health guidelines and approved by Brown University’s Institutional Animal Care and Use Committee. Adult male Sprague-Dawley rats (240-300 g) were housed in a 12:12 hour light:dark cycle with food and water provided ad libitum. To selectively label ipRGCs, we injected rhodamine-labeled latex microspheres into the SCN. To do so, animals were anesthetized by intraperitoneal injection (ketamine: 60 mg/kg; medetomidine: 0.6 mg/kg) and unilateral injections made stereotaxically from a glass pipette tilted 10 degrees from vertical. Animals were allowed to recover for at least 48 hours following surgery before being used in an experiment.
Eyecup recording preparation
Recordings from intact retina were made as described previously (Wong et al. 2007). In brief, rats were sacrificed by CO2 asphyxiation or Beuthanasia (260 mg kg −1 ip; Schering-Plough Animal Health, Union, NJ, USA) and their eyes were removed and hemisected. The vitreous was removed and the flattened eyecup was mounted in a recording chamber, anchored with a weighted nylon mesh. Retrolabeled ipRGCs were identified by epifluorescence and their somata exposed by tearing a small hole in the inner limiting membrane with an empty patch pipette.
Dissociated retina preparation
Labeled retinas were digested in phosphate-buffered saline (PBS) with papain, following the methods of Meyer-Franke et al. (1995) and cultured overnight on 12-mm round coverslips as described previously (Graham et al., 2008; Van Hook & Berson, 2010). For recording, individual coverslips were mounted with vacuum grease onto a recording chamber (3-5 ml volume). By disrupting retinal synaptic networks, this preparation ensured that all recorded light responses were generated by melanopsin-based phototransduction and that all effects of dopamine receptor agonists resulted from direct actions on ipRGCs.
Electrophysiological recording
Dissociated cells or intact retinas were superfused constantly (2-4 ml/min, 33° C) with Ames’ medium (Sigma; supplemented with 10 mM D-glucose and 23 mM NaHCO3 and bubbled with 5% CO2 in O2). To ensure that components of the culture medium were thoroughly washed away during recording, all cells were superfused with Ames’ medium for >30 mins before whole-cell recording.
Pipettes were pulled from thick walled borosilicate tubing with a Flaming/Brown P-97 pipette puller (Sutter Instruments, Novato, CA, USA) and had tip resistances of 4-9 MΩ. The internal solution contained (in mM) 120 K-gluconate or Cs-methanesulfonate, 5 NaCl, 4 KCl or CsCl, 2 EGTA, 10 HEPES, 4 ATP-Mg, 7 phosphocreatine-Tris, and 0.3 GTP-Tris (260-280 mOsm). The pH was adjusted to 7.3-7.4 with KOH or CsOH. The potassium-based internal solution was used for dissociated cells, while the Cs-based internal solution was used for recordings in intact retina to improve space clamp. For the few experiments conducted in perforated patch configuration with isolated ipRGCs, the potassium-based pipette solution contained 200 μM amphotericin-B. Because we did not observe any differences between the perforated patch and whole-cell recordings, we pooled these data. For cell-attached recordings, the pipettes were filled with Ames’ medium.
Labeled cells were identified by epifluorescence using an upright microscope equipped with a 40x water immersion objective. After 15-30 mins of dark adaptation after epi-illumination, they were targeted under infrared transillumination for cell-attached, whole-cell or perforated patch voltage- or current-clamp recording. In perforated patch experiments, after establishing a giga-ohm seal we waited 15-45 mins for the series resistance to fall below 50 MΩ before beginning an experiment. Whole-cell experiments were discarded if the series resistance exceeded 30 MΩ. When recording in an intact retina, series resistance was partially compensated and the remaining series resistance was 10-25 MΩ. Holding potentials were corrected for liquid junction potentials (measured as 9 mV for K-gluconate internal solution and 7 mV for the Cs-methanesulfonate internal solution). In current-clamp recordings, dissociated ipRGCs were spontaneously active. Therefore, hyperpolarizing DC injections were used to suppress spontaneous spiking and maintain the membrane potential near the holding potential used in voltage-clamp experiments. Cell-attached recordings were conducted in voltage-clamp configuration with a holding potential of 0 mV and seal resistances >500 MΩ. Recordings were made with a Multiclamp 700A amplifier (Axon Instruments/Molecular Devices, Sunnyvale, CA, USA) and signals were low-pass filtered on-line at 4 kHz and sampled at 10-20 kHz. pClamp 9 (Axon Instruments/Molecular Devices) was used for data acquisition.
White light stimuli, generated by a 100 W tungsten-halogen lamp, were delivered from below. Unless noted otherwise, their irradiance measured at the chamber at 480 nm, was 2.8×10¹⁴ photons × s−1 × cm−2.
Pharmacology
Drug solutions were introduced into the chamber by substituting them for control Ames’ in the gravity-fed superfusion line. Stock solutions of these pharmacological agents were diluted to their working concentration in Ames’. These stock solutions were made up in deionized water for most drugs, including dopamine receptor agonists SKF38393 ((±)-1-phenyl-2,3,4,5-tetrahydro(1H)-3-benzazepine-7,8-diol HBr; Tocris, Ellisville, MO, USA), quinpirole ((4aR-trans)-4,4a,5,6,7,8,8a,9-octahydro-5-propyl-1H-pyr azolo[3,4-g]quinoline HCl; Tocris), and dopamine (3,4-dihydroxyphenethylamine HCl; Sigma).
DMSO (dimethyl sulfoxide) was included in the stocks of two bath-applied drugs, forskolin ([3R-(3a,4ab,5b,6b,6aa,10a,10ab,10ba)]-a-(acetyloxy)-3-e-thenyldodecahydro-6,10,10b-trihydroxy-3,4a,7,7,10a-pentamethyl-1H-naphtho[2,1-b]pyran-1-one; Tocris) and IBMX (isobutylmethylxanthine; Tocris). DMSO at the working concentration (0.1%) had no effect on the ipRGC photocurrent, but we nonetheless included an equal amount in the control superfusate when using these drugs.
KT5720 ((9R,10S,12S)-2,3,9,19,11,12-hexahydro-10-hydroxy-9-methyl-1-oxo-9,12-epoxy-1H-diindolo[1,2,3-fg:3′,2′,1′-kl]pyrrolo[3,4-i][1,6]benzodiazocine-10carboxylic acid, hexyl ester; Tocris) was dissolved in DMSO and was introduced by intracellular dialysis by inclusion in the patch pipette solution.
In intact retina recordings, we used a cocktail of drugs to block signal transmission by bipolar and amacrine cells, thereby isolating melanopsin-driven light responses and suppressing endogenous release of dopamine (Berson et al., 2002; Puopolo et al., 2001; Gustincich et al., 1997; Boelen et al., 1998). The cocktail contained 75 μM L-AP4 (L-(+)-2-amino-4-phosphonobutyric acid; Tocris), 40 μM DNQX (6,7-dinitroquinoxaline-2,3-dione; Tocris), 30 μM D-AP5 (D-(−)-2-amino-5-phosphonopentanoic acid; Tocris), and 0.5 μM TTX (tetrodotoxin; Tocris).
Data analysis
Traces were further low-pass filtered offline (cut-off = 50-300 Hz) for analysis and display by pClamp 10 (Axon), Microsoft Excel, and Origin 6 (OriginLab, Northampton, MA, USA).
Photocurrent amplitudes were measured from the baseline immediately before onset of a light stimulus to the peak of the current response. Input resistance (RN) was measured in recordings from intact retina with a voltage ramp from −70 to −60 mV and in dissociated cells from the slope of a linear fit of the peak voltage deflection evoked by a series of hyperpolarizing current injections. When measuring RN in this way, changes in membrane potential after application of pharmacological agents were corrected by direct current injection before subsequent measurements.
We used the Event Detection function in pClamp to count the number of action potentials or action currents evoked by a current injection or a light flash. All events were also inspected by eye. For measuring light-evoked spiking in cell-attached recordings, we counted the number of action currents during the duration of the 10-second light stimulus and subtracted the background firing rate measured during the five seconds immediately preceding the light flash.
Unless otherwise noted, data are expressed as mean ± SE and were considered significant for values of P < 0.05 as determined using a dependent two-tailed Students’ t-test.
Single-cell RT-PCR
Retinas were digested with papain and cultured as described above. Retroabeled cells that were isolated from other debris were aspirated into glass micropipettes containing 20 mM dithiothreitol (Invitrogen). Micropipettes for harvesting were manufactured with a PP-83 vertical pipette puller (Narishige, Tokyo, Japan). Cells were expelled into a PCR tube containing 20 units RNaseOUT (Invitrogen) in 20 mM dithiothreitol and immediately frozen on dry ice. Frozen cells were stored at −80° C until use (<2 weeks) and lysed upon thawing and incubation at 65° C during reverse transcription. Reverse transcription was performed using the SuperScriptIII First-Strand Synthesis System (Invitrogen). Incubation times were as follows: 65° C for 5 min, 4°C for 2 min, 50° C for 6 min, 70° C for 15 min. Each reverse transcription reaction yielded ~10 μl of product. Of this, 2 μl were used in PCR amplification to probe for expression of the melanopsin gene opn4, while the remaining 8 μl were used to probe for expression of candidate DA receptor genes. Cells not expressing opn4 were excluded from further analysis. PCR amplification was performed in 25 μl reactions with Platinum Supermix (Invitrogen). Amplification times were as follows: 95° C for 2 min, 40 cycles of 95° C for 30s, 55° C for 30s, 72° C for 50s, followed by 72° C for 5 min. Amplicons were run on 2% agarose gels stained with ethidium bromide and visualized under UV illumination. Bath solution from the retinal cultures was also aspirated and processed in parallel with single cell material using identical methods. None of the candidate genes were detected in this negative control.
Whole brain and whole retina cDNA were used as templates for positive controls. Total retina RNA was extracted from an adult rat retina using Rneasy Kit column (Qiagen, Valencia, CA, USA) while total brain RNA was extracted using Trizol Reagent (Invitrogen). 5 μg RNA were primed with oligo(dT)12-18 and reverse transcribed using SuperScript III reverse polymerase. Incubation times were as follows: 65° C for 5 min, 4° C for 2 min, 50° C for 60 min, 70° C for 15 min.
Primers were either designed using online PrimerQuest software from Integrated DNA Technologies (http://www.idtna.com/) or drawn from other publications. The drd1a and drd5 genes are intronless and several of other primers used did not span an intron. We therefore also ran PCR amplification reactions using intron-spanning primers for actb and discarded any cells in which we could detect the larger product indicative of genomic contamination. Such contamination was detected in only a single instance. The primer sequences used in this study are listed in Table 1.
Table 1.
Primer sequences for single-cell RT-PCR.
| Gene | NCBI Ref. Sequence |
Forward primer | Reverse primer | Reference |
|---|---|---|---|---|
| opn4 | NM_138860 | 5′-CCA GGA ATA CTT TGG CTC TAG CTC-3′ |
5′CTG GAA ACT TAG ACC ACT GAC-3′ |
N/A |
| actb | NM_031144 | 5′-TTG CTG ACA GGA TGC AGA AGG AGA-3′ |
5′-TAG AAG CAT TTG CGG TGC ACG ATG-3′ |
N/A |
| drd1a | NM_012546 | 5′-ATG CCA TAG AGA CGG TGA-3′ |
5′-CAT AGT CCA ATA TGA CCG A-3′ |
Li et al., 2004 |
| drd2 | NM_012547 | 5′-CAG CAG TCG AGC TTT CAG AG-3′ |
5′-CTG GTG CTT GAC AGC ATC TC-3′ |
Peiser et al., 2005 |
| drd3 | NM_017140 | 5′-GAT CCC AGC ATC TGC TCC ATC TC-3′ |
5′-ATC TTG AGG AAG GCT TTG CGG AA-3′ |
Davila et al., 2003 |
| drd4 | NM_012944 | 5′-CTA CTC AGG GTC CCC TCT TC-3′ |
5′-TGA TCT TGG CGC CTC TCT TTC-3′ |
Surmeier et al., 1996 |
| drd5 | NM_012768 | 5′-AAG GCT GGG ATT ACA GAG GCA ACT-3′ |
5′-AAC GGT CCA CGC TGA TGA TAC ACA-3′ |
N/A |
Gene: gene name. opn4, melanopsin; actb, beta-actin; drd1a, D1a dopamine receptor; drd2, D2 dopamine receptor; drd3, D3 dopamine receptor; drd4, D4 dopamine receptor; drd5, D5 dopamine receptor. “N/A” in the reference column, primer sequence was generated using PrimerQuest (see Materials and Methods).
Immunohistochemistry
To prepare vertical retinal sections, rats were sacrificed as described above and whole eyes were submerged in 4% paraformaldehyde in 0.1 M phosphate-buffered saline (PBS) for 1 hour. The eyes were washed with PBS, cryoprotected in 30% sucrose in PBS overnight at 4° C, embedded in OCT compound (Sakura Finetek, Torrance, CA, USA) or M-1 Embedding Matrix (Fisher Scientific, Pittsburgh, PA, USA) and frozen in liquid nitrogen. Sections were cut on a cryostat (20 μm), mounted on Superfrost Plus slides (Fisher) and stored at −80° C until use. For antibody staining, vertical sections were incubated in blocking solution (6% donkey serum and 0.5% Triton X-100 in PBS) for 1 hour followed by primary antibodies for 2-3 days at 4° C. Sections were washed with PBS, incubated again in blocking solution for 1 hour and then incubated in Alexa Fluor-coupled secondary antibodies for 2-3 hours. The sections were washed again, and coverslipped with ProLong Gold with DAPI (Invitrogen).
To prepare flat mounts, retinas were dissected in Hibernate-A culture medium (BrainBits, Springfield, IL, USA), mounted on a nitrocellulose membrane, and fixed in 4% paraformaldehyde in 0.1 M PBS for 1 hour at room temperature. The tissue was washed, cryoprotected in 30% sucrose in PBS for 2-3 hours at room temperature, and was repeatedly frozen on dry ice and thawed as described previously (Berson et al., 2010; two freeze-thaw cycles). The tissue was then incubated overnight at 4° C in PBS containing 2% Triton X-100 and 0.5% DMSO to enhance permeability. The next day, retinas were incubated in a “high-permeability” blocking solution containing 6% donkey serum, 0.5% DMSO and 2% Triton X-100 in PBS for 1 hour and then incubated in the same solution plus primary antibodies for 7 days at 4° C. The tissue was then washed repeatedly in PBS, incubated in the “high-permeability” blocking solution for 1 hour followed by secondary antibodies in the same blocking solution for 2-3 hours at room temperature. Retinas were finally washed with PBS, mounted on microscope slides, and coverslipped with ProLong Gold.
Antibodies
The D1a receptor was probed with a polyclonal rabbit antibody raised against a 13 amino acid peptide from an intracellular domain (residues 403-415) of the rat D1a dopamine receptor (Millipore AB1765P; Huang et al., 1992). As demonstrated previously, this antibody stains a single band of appropriate size (~54 kDa) on a Western blot of rat retina homogenate (Hayashida et al., 2009). In rat brain, this antibody labels areas previously characterized as expressing D1 receptors in ligand binding and in situ hybridization studies (Huang et al., 1992). Melanopsin was probed with a goat polyclonal antibody raised against the C-terminus of rat melanopsin (Santa Cruz SC-26962). This antibody stains a single band on a Western blot of rat brain extract (vendor information). It has been used previously to identify melanopsin-expressing cells (Graham et al., 2008). In rat whole-mount retinas and vertical sections (see Results) it stains a population of cells matching the morphology of M1 ipRGCs described previously (Berson et al., 2002; Warren et al., 2003; Schmidt & Kofuji, 2009; Berson et al., 2010). Both primary antibodies were used at a concentration of 1:50 in blocking solution. Alexa Fluor 488- or 594-coupled donkey anti-goat or donkey anti-rabbit secondary antibodies (Invitrogen A11055, A11058, A21206, A21207) were used at a concentration of 1:400 for vertical sections and 1:200 for flat-mounts.
Microscopy and image analysis
Images were obtained on a Zeiss LSM 510 Meta inverted confocal laser scanning microscope equipped with argon/2, DPSS 561-10, and diode 405-30 lasers. Images from vertical sections were acquired as single optical sections while some from flat mounts were acquired as z-stacks. The voxel size was 0.39 μm x 0.39 μm x 1.0 μm. Images were analyzed with Zeiss LSM software and Adobe Photoshop. Contrast and brightness were adjusted globally for each color channel and images were cropped for presentation. Some images were pseudocolored to maintain consistency in figures. All photomicrographs shown here were assembled in Adobe Photoshop and are from single optical sections.
Results
Dopamine attenuates the melanopsin photocurrent in intact retina
To determine whether DA might modulate the melanopsin-based intrinsic light responses of ipRGCs, we made whole-cell voltage-clamp recordings from ipRGCs in an intact retina. The intrinsic photocurrent was isolated from rod- and cone-driven synaptic input by bath-applying L-AP4, DNQX, D-AP5, and TTX, a cocktail that also served to suppress the endogenous release of dopamine (Berson et al., 2002; Puopolo et al., 2001; Gustincich et al., 1997; Boelen et al., 1998). Addition of dopamine (200 μM) consistently reduced the amplitude of the ipRGC photocurrent (Figure 1; 48 ± 8% reduction; N = 6; P = 0.0059). This was accompanied by a small, but non-significant increase in holding current (41 ± 6 pA increase; N = 6; P = 0.050) and a decrease in RN (27 ± 7% decrease; N = 6; P = 0.0099). Voltage clamping acts to minimize the effects of this reduction in RN on measured photocurrent. Although space clamp is doubtless imperfect in these intact cells, the reduction in RN appears too modest to account for the observed reduction in photocurrent, which thus presumably reflects suppression of the melanopsin phototransduction cascade. In this intact retinal preparation, dopamine could suppress ipRGC photocurrent by acting directly on ipRGCs, by modulating some other influence on ipRGCs, or both.
Figure 1. Dopamine modulates the melanopsin-based light response in intact retina.

Whole cell voltage-clamp recording from an ipRGC in an isolated rat retina under pharmacological blockade of retinal synapses. The cell was labeled by retrograde transport from the SCN. Photocurrents were evoked by a 5-second light flash (timing marked by the bar above the traces) in control conditions (left), after addition of 200 μM dopamine (center), and after wash-out (right). The cocktail for blocking synaptic transmission consisted of 75 μM L-AP4, 40 μM DNQX, 30 μM D-AP5, and 0.5 μM TTX. The light source was attenuated with a −1.5 log neutral density filter. Vhold = −67 mV.
D1-family receptors mediate direct actions of dopamine on ipRGC photocurrent
To assess whether these effects of dopamine were the result of direct action on ipRGCs, we made recordings from ipRGCs in a dissociated retina preparation. In these recordings, bath-application of the selective D1-family agonist SKF38393 (1-10 μM) attenuated the ipRGC photocurrent (Figure 2 A; 23 ± 7% reduction; N = 17; P = 0.022). Similar studies conducted with perforated patch gave comparable results (Figure 2B). Recovery of the light response following wash out was more reliable in perforated patch recordings, as these tended to remain stable for a longer period of time (>60 mins in many cases) than whole-cell recordings, the quality of which typically degraded ~20 mins after break-in. However, in several exceptionally stable whole-cell recordings, the light response completely recovered following wash-out (Fig 2A). This indicates that the observed reduction in amplitude was a pharmacological effect and not merely run-down of the light response (Berson et al., 2002; Warren et al., 2006). In contrast to the pronounced effects of the D1-family agonist, the selective D2-family dopamine receptor agonist quinpirole (10 μM) had no significant effect on photocurrent amplitude (Figure 2C; 2.9 ± 10 % increase in amplitude; N = 7; P = 0.68).
Figure 2. Effects of D1 receptor activation on the photocurrent in isolated ipRGCs recorded in voltage-clamp recordings.

A) Bath-application of the D1 agonist SKF38393 (1 μM) attenuated the ipRGC photocurrent. The trace on the left is a control recording in control Ames’ while the trace in the center was recorded 15 minutes after application of SKF38393. After switching back to control Ames’ for 15 minutes, the light response recovered, right. B) SKF38393 (100 μM) had comparable effects on the photocurrent in perforated patch recordings. The light source was attenuated with a −1 log neutral density filter. C) The D2 agonist, quinpirole (10 μM) had no effect on photocurrent. Vhold = −69 mV.
Activation of D1-family receptors alters ipRGC membrane properties
In voltage-clamp recordings, SKF38393 (1-10 μM) caused a modest increase in holding current (8.99 ± 1.8 pA increase; N = 17; P = 0.00013). In contrast, quinpirole (10 μM) had no effect on holding current (0.68 ± 6.5 pA decrease; N = 7; P = 0.92). The effect of SKF38393suggests that D1-receptor activation may gate an inward current in ipRGCs. In current-clamp recordings, SKF38393 (10 μM) caused a small decrease in RN (10 ± 3 % decrease; N = 5; P = 0.042; Figure 3 A & B) and a modest depolarization (7.7 ± 2.2 mV; N = 6; P = 0.0041; Figure 3 C & D). We observed a similar depolarization in the presence of TTX (1 μM; 7.0 ± 1.4 mV; N = 3; P = 0.04), suggesting that the depolarization occurred independently of voltage-gated Na+ channels. In the absence of TTX, the drug-induced depolarization triggered action potentials. However, in contrast with earlier studies of dopaminergic effects on rat RGCs (Chen & Yang, 2007; Hayashida et al., 2009), we found that SKF38393 did not significantly alter the number of spikes evoked by injection of depolarizing current (10-60 pA, 500 ms injections; N = 5-7; P > 0.05; Figure 3 E & F).
Figure 3. Effects of the D1 receptor agonist SKF38393 on membrane properties and spiking of isolated ipRGCs.

A & B) SKF38393 caused a reduction in ipRGC input resistance (RN). A) Effects of injected hyperpolarizing current (500 ms: −60, −40, −20, −10, 0 pA) before (control) and 10 minutes after application of SKF38393 (10 μM; SKF). Because the ipRGCs were spontaneously active and because SKF38393 depolarized the cells, hyperpolarizing DC injection was adjusted to hold the membrane potential at −70 mV. B) Assessment of RN in a representative ipRGC. Peak voltage response as a function of hyperpolarizing current strength for the cell in A (diamonds: control values; squares: in the presence of SKF38393). The slope of the linear fit to such data was used to calculate input resistance for each cell. C) SKF38393 (“SKF”; 10 μM) caused a modest depolarization that triggered action potentials. The trace on the left is in control Ames’ and the trace on the right is 10 minutes after application of SKF38393. D) Summary from all cells showing that SKF38393 caused a significant depolarization. Points connected by solid lines represent membrane potential measurements from single cells before and after additions of SKF38393. Triangles indicate recordings in the presence of 1 μM tetrodotoxin, while circles are in the absence of tetrodotoxin. Bars and error bars represent mean ± SEM for all cells. * P < 0.05. E) Failure of the D1 agonist SKF38393 to affect ipRGC spiking in response to a depolarizing current injection (500 ms, 20 pA). As in A, current pulses were superimposed on a steady hyperpolarizing current injection that held the resting membrane potential near −73 mV. F) Mean ± SEM of the total spike number plotted against current injection amplitude. Squares represent the control recordings while triangles are 6-10 minutes following SKF38393 application. Differences of the means are non-significant (P > 0.05) for all current injections.
Effects of dopamine on light-evoked and background spiking
To assess the effects of DA receptor activation without disrupting the intracellular milieu, we made several recordings from ipRGCs in a cell-attached voltage-clamp configuration (Figure 4). In these experiments, bath application of DA (100 μM) caused an increase in background spiking (control: 2.0 ± 0.8 Hz; DA: 7.7 ± 1.8 Hz; N = 7; P = 0.033; Figure 4 B), consistent with the depolarizing effects of D1-receptor activation noted in the whole-cell data. In some cells, this was accompanied by a reduction in action-current amplitude, presumably because of partial sodium-channel inactivation. Light-evoked spiking was dramatically reduced in the presence of DA (control: 15 ± 3.2 Hz; DA: 2.4 ± 1.6 Hz; Figure 4 C). The light response and background firing properties partially recovered 10 minutes after washout.
Figure 4. Effects of dopamine on background and light-driven spiking.

A) Action currents recorded from a dissociated ipRGC in control conditions (top trace) and after addition of DA (100 μM; lower trace). The horizontal bar indicates the timing of the 10-second light stimulus. B & C) Group data on the effect of dopamine on background firing rate (B) and light-evoked spiking (C). In both panels, data are shown in control Ames’ (left bar), 10 minutes after addition of dopamine (“DA”, center) and 10 minutes after returning to control Ames’ (right). B) Background firing was measured as the average spike rate during the 5 seconds preceding the light stimulus. This rate increased significantly after addition of dopamine and partially recovered upon washout of dopamine. C) For light-evoked responses, response represents the average spike rate during the 10-second light stimulus. * P < 0.05.
ipRGCs express the D1a dopamine receptor gene drd1a
Based on our pharmacological data, we suspected that at least one D1-family receptor would be expressed in ipRGCs. To test this hypothesis, we used single-cell RT-PCR to assess which of the four retinally-expressed dopamine receptor subtypes were expressed in ipRGCs. For these studies, ganglion cells were identified as ipRGCs on the basis of retrolabeling from the SCN and confirmed expression of melanopsin (opn4). The most commonly detected dopamine receptor gene among these cells was drd1a (10 of 14 cells; 71%), which encodes D1a, a D1-family receptor (Figure 5). We also detected expression of the D1-family gene drd5 in a minority of cells (3 of 26 cells; 12%). This confirms our hypothesis that ipRGCs express D1-family receptors. We also detected the expression of the D2-family dopamine receptor gene drd4 (3 of 13 cells; 23%) but failed to detect the D2-family gene drd2 (0 of 11 cells; 0%). Due to limitations in the amounts of RNA extracted, we generally did not probe single cells for expression of more than one or two DA receptor subtypes and are therefore unable to comment on the possibility that some cells may express multiple DA receptor subtypes, as is the case in other systems (Lee et al., 2004). We did not probe for drd3 expression at the single-cell level because, unlike the other DA receptor subtypes, it was not detectable among whole-retinal transcripts (Figure 5C), in agreement with earlier reports (Witkovsky, 2004). This was not attributable to ineffectiveness of our drd3 primers because they successfully amplified a product of appropriate size from whole brain extracts (Figure 5C).
Figure 5. Assessment of expression of dopamine receptors in ipRGCs by single-cell RT-PCR.

A) Representative single-cell RT-PCR data showing PCR products from cDNA derived from four individual ipRGCs (left four lanes). Top panel: amplicons from primers for the melanopsin gene, opn4, which is selectively expressed in ipRGCs; the presence of a band for all four cells confirms their identity as ipRGCs. Lower panel: the same four ipRGCs also expressed the gene for the D1a dopamine receptor drd1a. Controls run in parallel are shown in the rightmost two lanes; water (“H2O”) was run in parallel as a negative control for contamination, while whole retina cDNA (“retina”) was used as a positive control. B) Summary for all cells harvested showing that the majority of ipRGCs expressed the drd1a gene and a minority expressed drd4 and drd5, while none detectably expressed the drd2 gene. C) Expression of all dopamine receptor genes in whole retina and brain tissue extracts. Because drd3 was not expressed in retina, we did not probe for its presence in ipRGCs.
Immunofluorescence reveals coexpression of D1a and melanopsin proteins in ipRGCs
We probed ipRGCs for the presence of the D1a receptor, the protein product of the most abundant DA receptor transcript in the RT-PCR analysis. We carried out double immunofluoresence studies with antibodies against melanopsin and the D1a receptor in vertical sections (Figures 6 A-C) and retinal flat mounts (Figure 6 D-F). The pattern of anti-D1a staining matched that described by Hayashida et al. (2009), with prominent ring-like or crescent-shaped staining of somata mainly in the ganglion cell layer (GCL) but also sparsely in the inner nuclear layer (INL) as well as diffuse labeling in the inner plexiform layer (IPL). The anti-melanopsin antibody labeled a small population of cells clearly corresponding to the M1 type of melanopsin ganglion cells. Their somata were located predominantly in the GCL, but were occasionally displaced to the INL. Their terminal dendrites stratified exclusively at the IPL/INL border (Figure 6 B; Berson et al., 2002). These cells correspond quite closely to the cells examined in our electrophysiological and RT-PCR studies, because these were targeted on the basis of retrolabeling from the SCN, which receives the great majority of its retinal input from M1 cells (Baver et al., 2008). Somata of melanopsin immunopositive RGCs were also D1a immuopositive (Figure 6 C & F), confirming the presence of the D1a protein in M1 ipRGCs. A few melanopsin-immunopositive cells lacked detectable D1a labeling. This mirrors our single-cell RT-PCR findings in which some melanopsin-expressing cells lack appreciable D1a receptor transcripts.
Figure 6. Double immunofluoresence evidence for the expression of D1a receptors by melanopsin ganglion cells.
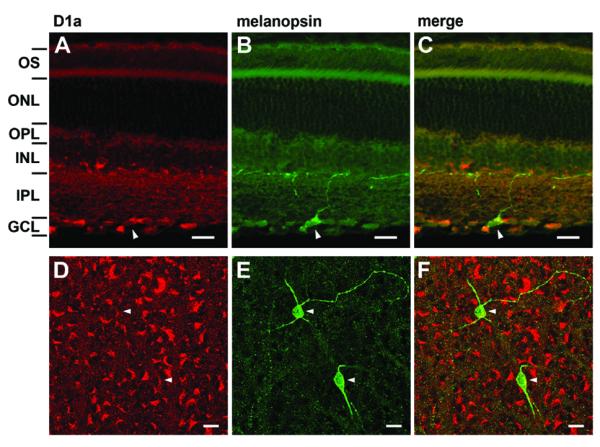
A-C) Confocal laser scanning photomicrograph from a single optical section of a 20 μm vertical section. A) D1a immunoreactivity (red) was prominent in somata in the ganglion cell layer. B) Melanopsin immunoreactivity (green) showing a single M1-type ipRGC with a dendrite extending toward the border of the inner plexiform and inner nuclear layers. C) Overlay of D1a and melanopsin panels showing that the melanopsin ganglion cell exhibits D1a-like immunoreactivity. Arrowhead marks the same cell in all three panels. OS, outer segments; ONL, outer nuclear layer; OPL, outer plexiform layer; INL, inner nuclear layer; IPL, inner plexiform layer; GCL, ganglion cell layer. Borders between retinal layers were determined with DAPI staining (not shown). D-F) Single confocal optical section through the ganglion cell layer from a retinal whole mount processed for D1a and melanopsin immunoreactivity; image has been pseudocolored for consistency with A-C. D) D1a immunopositive somata in the GCL displayed a crescent-shaped staining pattern. E) Two ganglion cells in this field were melanopsin immunopositive. F) Overlay of D and E, showing that both melanopsin ganglion cells were also D1a immunoreactive. Arrowheads mark the same cells in all three panels. Scale bars are 20 μm in all panels.
D1 effects on ipRGCs are mediated by cAMP and PKA
The evidence presented above shows that ipRGCs express D1a receptors and that D1-family agonists act directly on ipRGCs to suppress their intrinsic photocurrents and alter their membrane properties. We next explored the signaling pathway underlying these effects. Most D1-family DA receptors couple to a GS/olf G-protein that activates adenylate cyclase (AC), causing an increase in intracellular levels of cAMP (Neve et al., 2004). If the mechanism by which D1 receptor activation suppresses the ipRGC photocurrent involved an increase in intracellular cAMP, activation of AC should mimic the suppressive effects of the D1 agonist (SKF38393). To test this prediction, we applied forskolin (20 μM) to activate AC, and included the phosphodiesterase inhibitor IBMX (100 μM) to inhibit the hydrolysis of cAMP. In whole-cell and perforated patch voltage-clamp recordings, co-application of forskolin and IBMX dramatically attenuated the ipRGC photocurrent (58 ± 6 % reduction; N = 12; P = 0.000018; Figure 7), mimicking the effects of SKF38393. The light response partially recovered 10 minutes following wash-out of forskolin and IBMX (Figure 7). Like SKF38393, forskolin and IBMX caused an increase in holding current (12 ± 3 pA increase; N = 12; P = 0.0019). Also, the forskolin-IBMX cocktail further mimicked the actions of D1 agonists by reducing the RN of ipRGCs (16 ± 4% reduction; N = 8; P = 0.0059; Figure 8 A). The forskolin-IBMX treatment had no significant effect on evoked spiking (depolarizing current injections from 10-60 pA; N = 3-7; P > 0.05 for all current injections; Figure 8 B & C). Also like SKF38393, forskolin and IBMX caused a modest depolarization (7.8 ± 2 mV; N = 8; P = 0.028; Figure 8 D & E). Finally, inclusion of the selective PKA inhibitor KT5720 (1 μM) in the patch pipette blocked the effects of 100 μM SKF38393 on the photocurrent (0.15% reduction in photocurrent amplitude; N = 6; P = 0.65; Figure 9). In control experiments, we omitted KT5720 but included its vehicle in the pipette (0.01% DMSO); under these conditions, 100 μM SKF38393 still caused a reduction in photocurrent amplitude (31.5% reduction; N = 5; P = 0.033).
Figure 7. Elevating intracellular cAMP levels by application of forskolin and IBMX mimics the action of dopamine on the ipRGC photocurrent.

Perforated patch voltage-clamp recordings from a single ipRGC in control Ames’ (left) and 10 minutes after the bath-application of the adenylate cyclase-activator forskolin (20 μM) and the phosphodiesterase inhibitor IBMX (100 μM), center. The light response partially recovered 10 minutes after returning to control Ames’ (right trace). The black bars above the traces mark the 5-s light stimulus. Vhold = −69 mV.
Figure 8. Effects of elevating intracellular cAMP on ipRGC membrane properties and spiking as measured in whole cell current-clamp recordings.

A) Effects of injected hyperpolarizing current (500 ms: −40, −20, −10 and 0 pA) before (control) and 10 minutes after bath application of forskolin (20 μM) and IBMX (100 μM; forsk + IBMX). DC current was adjusted before and after addition of forskolin and IBMX to maintain the membrane potential near −74 mV. B) Action potentials evoked in response to depolarizing current injection (500 ms, 27 pA) before and after 10 minutes of continuous bath application of forskolin and IBMX. C) Mean ± SEM of number of evoked spikes plotted against current amplitude for all cells. Data from injections of 20-27 pA were grouped together. Squares represent the control recordings while triangles represent the recordings 6-10 minutes after application of forskolin and IBMX. Difference of the means was non-significant (P > 0.05) for all current strengths. D) Forskolin and IBMX caused a modest depolarization that triggered action potentials. The trace on the left is in control Ames’ and the trace on the right is 10 minutes after application of Forskolin and IBMX. E) Membrane potential before and after application of forskolin and IBMX. Points connected by solid lines represent data for individual cells, while the bars and error bars are mean ± SEM for all cells. Forskolin and IBMX significantly depolarized the ipRGCs (* P < 0.05).
Figure 9. Effects of D1 receptor activation on the photocurrent are mediated by PKA.

Whole cell voltage-clamp recordings from two isolated ipRGCs demonstrating that the suppressive effects of D1 agonists on the ipRGC photocurrent are blocked by a selective PKA inhibitor (KT5720). A) Control recordings in one ipRGC, confirming that the suppressive effect of the D1-receptor agonist (SKF38393; 100 μM) on the photocurrent is observable when the vehicle for the PKA antagonist (0.01% DMSO) is present in the patch pipette. B) Recordings from a second cell showing that the suppressive effect of SKF38393 on photocurrent is abolished when the PKA inhibitor KT5720 (1 μM) was included in the pipette. Vhold = −69 mV. Horizontal black bars indicate the light stimulus.
Discussion
In this study, we show that DA and DA agonists have two distinct effects on ipRGCs: they attenuate the ipRGC photocurrent and alter membrane properties, depolarizing the ipRGCs and reducing RN. These are direct effects of DA on ipRGCs because they occur in isolated ipRGCs. In particular, we find that DA exerts these actions through D1-family receptors, resulting in stimulation of adenylate cyclase and activation of PKA.
The various effects of DA on ipRGCs may be understood as follows. D1 activation reduces the melanopsin-driven light response. Therefore, in the presence of dopamine, light evokes a smaller current, causing a smaller depolarization and consequent reduction in light-evoked spiking, as shown in cell attached recordings (Fig 4). The reduction in light-evoked spiking is not the result of D1 actions on voltage-gated Na+ channels, as spiking evoked by depolarizing current injections in current clamp recordings is similar in both control conditions and in the presence of a D1 agonist (Fig 3). Moreover, the depolarization and enhancement of background spiking represents yet another effect of D1 activation, possibly from modulation of the hyperpolarization-activated cation current Ih, as we discuss below.
Effects on the ipRGC photocurrent and membrane properties are probably separate phenomena. Although the dopamine-receptor mediated reduction in RN could have slightly degraded the quality of the space clamp in intact retina recordings, the effects were too small to account for the observed attenuation of the photocurrent. Moreover, the bulk of our recordings were performed in isolated ipRGCs in which the quality of space clamp should be excellent so that any changes in RN would have been very unlikely to appreciably affect the measured photocurrent.
The cells used in electrophysiological studies were clearly melanopsin-expressing ipRGCs. Each cell responded to light either in the presence of a cocktail of synaptic blockers that pharmacologically isolated it from rod- and cone-driven inputs (as in recordings in intact retina) or in the dissociated preparation in which cells are physically isolated from rod- and cone-driven inputs (Berson et al., 2002; Graham et al., 2008). At present, there has been no demonstration of intrinsic photosensitivity in ganglion cells by any means other than melanopsin. Additionally, cells were identified by retrograde transport from the SCN, a structure that receives input largely or exclusively from melanopsin-expressing RGCs (Berson et al., 2002; Hannibal et al., 2002; Gooley et al., 2001; Baver et al., 2008). In mouse, the great majority of these cells are of the M1 subtype (Baver et al., 2008; Chen et al., 2011). Consistent with this, most RGCs labeled from the SCN in rats and possessing intrinsic light responses have M1 morphology (Berson et al., 2002). Thus, while the majority of cells recorded in this study were likely M1 cells, a minority may have been of the M2 subtype.
We also examined dopamine receptor expression by ipRGCs using single-cell RT-PCR and immunohistochemistry. The single-cell RT-PCR results support the expression of a D1-family receptor, with the D1a subtype being the most commonly detected. In immunohistochemical experiments, the D1a signal was present in melanopsin immunopositive RGCs, but only in the somata; we did not observe any appreciable D1a signal in melanopsin immunopositive dendrites. While this result supports the presence of D1a protein in ipRGCs, in strong agreement with the pharmacology and single-cell RT-PCR, it does not support its localization in ipRGC dendrites at sites of contact with DACs at the IPL/INL border. This may simply be a question of antibody sensitivity; the protein may be present in dendrites, but at levels below the detection threshold for conventional immunofluoresence. Future studies should examine this possibility with histochemical amplification techniques. Alternatively, it may be the case that D1a receptors in ipRGCs localize exclusively to the soma. Indeed, dopamine in the retina and elsewhere in the central nervous system is known to act in a paracrine fashion, not requiring conventional synaptic contacts (Bjelke et al., 1996; Garris et al., 1994; Cragg & Rice, 2004). This would imply that contacts between M1 ipRGCs and DACs serve a function other direct dopaminergic input to ipRGCs. Instead, they may be substrates for excitatory ipRGC to DAC glutamatergic synaptic transmission (Zhang et al., 2008) or GABAergic signaling from DACs to M1’s, as occurs with AII amacrine cells (Contini & Raviola, 2003).
Mechanism of dopamine effects
The effects of dopamine on the ipRGC photocurrent and membrane properties are mediated by D1-family receptors, most likely of the D1a subtype. In recordings from isolated ipRGCs, a D1 agonist attenuated the ipRGC photocurrent, caused a reduction in RN and a modest depolarization.
A D2-family agonist, on the other hand, was without effect. Moreover, our single-cell RT-PCR data indicate that the D1a receptor gene, drd1a, is expressed in a majority of ipRGCs. This finding was supported by immunohistochemical evidence in which melanopsin-expressing cells also possessed D1a-like immunoreactivity. Finally, D1-family receptors are known to signal via production of cAMP and activation of PKA (Neve et al., 2004). In keeping with this signaling pathway, we were able to mimic the effects of the D1 agonist on both the photocurrent and membrane properties when we increased intracellular levels of cAMP with forskolin and IBMX. Similar effects of cyclic nucleotides on the ipRGC light response and holding current have been described previously (Warren et al., 2006). Moreover, effects of the D1 agonist on the photocurrent were blocked when we dialyzed the cell with a PKA inhibitor.
In many respects, the observed effects of D1 receptor activation on ipRGCs are consistent with earlier work. Studies using a variety of approaches including autoradiographic ligand binding and immunohistochemistry suggest that D1-family receptors are predominantly expressed in the inner retina, while D2-family receptors are present in the outer retina (Tran & Dickman, 1992; Veruki & Wässle, 1996; Nguyen-Legros et al., 1997; Hayashida et al., 2009; but see Nguyen-Legros et al., 1996). Furthermore, several studies have demonstrated D1 agonist effects on RGCs in a variety of species including goldfish (Vaquero et al., 2001; Hayashida & Ishida, 2004), turtles (Liu & Lasater, 1994) and rats (Chen & Yang, 2007; Hayashida et al., 2009). Our findings of a D1 effect on ipRGCs fit comfortably within this pattern.
They do, however, diverge somewhat from the only other study to examine effects of DA receptor agonists on ipRGCs. Sakamoto et al. (2005) reported an increase in retinal levels of opn4 mRNA several hours after intraperitoneal injection of a D2-family agonist. Hinting at a direct effect on ipRGCs, they used combined immunohistochemistry and in situ hybridization to show that melanopsin immunopositive cells appeared to express the gene for the D2 receptor, drd2. While the majority of cells we harvested for single-cell RT-PCR express the drd1a gene, a few also expressed the other D1-family gene drd5 or the D2-family gene drd4. However, unlike Sakamoto and colleagues, we were unable to detect expression of drd2 in ipRGCs. The differences between their findings and ours remain to be resolved, although it may be that a subpopulation of ipRGCs other than the one we studied does express the D2 receptor. Alternatively, it is possible that ipRGCs do not express the D2 receptor and the effects of D2 agonists they reported are instead indirect.
In our study, the effects of D1 receptor activation and cAMP signaling on ipRGC membrane properties are consistent with known effects of DA on the hyperpolarization-activated cation current Ih in rat RGCs (Chen & Yang, 2007). Similar effects of D1 signaling on Ih have been described elsewhere (Govindaiah & Cox, 2005; Wu & Hablitz, 2005; Rosenkranz & Johnston, 2006; Ballo et al., 2010). We have recently shown that rat ipRGCs have Ih (Van Hook & Berson, 2010), suggesting that a similar mechanism may be in place in ipRGCs.
Cyclic-AMP activated protein kinase (PKA), a common effector in D1 signaling (Neve et al., 2004), appears to be responsible for D1 effects on the melanopsin phototransduction cascade. Although prior studies have made significant advances in understanding ipRGC phototransduction (Warren et al., 2006; Sekaran et al., 2007; Hartwick et al., 2007; Graham et al., 2008; Perez-Leighton et al., 2011), the identities of several key components, including the light-gated channel and its gating mechanism, are far from settled, making it difficult to identify a target for PKA.
However, some studies have described direct actions of PKA that might underlie effects on the melanopsin cascade. These possibilities include phosphorylation of beta isozymes of phospholipase C (Yue et al., 1998; Tawfeek et al., 2008) and TRP channels (Warr & Kelly, 1996), both of which have been implicated in the melanopsin signaling (Warren et al., 2006; Sekaran et al., 2007; Hartwick et al., 2007; Graham et al., 2008; Perez-Leighton et al., 2011). Furthermore, the intracellular domains of the melanopsin protein contain an abundance of putative phosphorylation sites (Provencio et al., 1998), some of which might be important contributors to the effects of D1 signaling.
PKA can also regulate phosphoinositide signaling by phosphorylation of GRKs (G-protein receptor kinases) and regulator of G-protein signaling (RGS) proteins, leading to accelerated shutoff of Gαq signaling (Huang et al., 2007). In rod and cone photoreceptors, GRK proteins involved in termination of phototransduction are also regulated by PKA phosphorylation (Horner et al., 2005; Osawa et al., 2008). Although the role of GRK signaling has not yet been identified in the melanopsin pathway, several GRK proteins appear to be expressed in ipRGCs (C. Frederick & D. Berson, unpublished observations), and phosphorylation of these GRK proteins may also regulate melanopsin signaling.
Additionally, in Drosophila photoreceptors, PKA appears to modulate single-photon responses by acting on NinaC (Chyb et al., 1999), a class III myosin involved in termination of the photoresponse (Porter et al., 1995) and light adaptation (Lee & Montell, 2004; Cronin et al., 2004). Vertebrate homologues of NinaC are expressed in retina (Dosé & Burnside, 2000; Dosé & Burnside, 2002), including in some ganglion cells (Katti et al., 2009) and may have functions in ipRGCs similar to those described in other photoreceptors in the rhabdomeric lineage.
The melanopsin signaling cascade is tightly associated with the plasma membrane and continues to respond to light even in excised patch recordings in which the intracellular side of the membrane is exposed to the bath solution (Graham et al., 2008). The persistence of D1 receptor signaling effects on the melanopsin cascade in whole-cell recordings, in which the cell has been dialyzed with the pipette solution, raises the possibility that modulation of the melanopsin cascade may be similarly membrane-associated and thereby occurs locally without requiring global changes in intracellular cAMP content and PKA activity.
Functional implications
Dopamine functions as an intraretinal circadian and light adaptive signal, modulating the cellular and synaptic physiology of the retina in anticipation of, and compensation for, transitions from scotopic to photopic lighting (Witkovsky, 2004). We have demonstrated that ipRGCs, like most retinal cells, are subject to dopaminergic modulation. What is the relevance of this modulation for the non-image-forming visual functions driven by ipRGCs?
The reduced photocurrent, compounded by the lower RN, might diminish the photocurrent’s ability to drive the cell above spike threshold, as suggested by our cell-attached recordings. However, D1 activation also depolarized ipRGCs, an effect that could partially offset the effects on photocurrent and RN.
Since DA release is highest during the day – as a result of both circadian and light-driven influences (Pozdeyev & Lavrikova, 2000) – DA-mediated effects on ipRGCs should be maximal during the daylight hours and thereby support a form of light adaptation. Indeed, light exposure has been shown to desensitize phototransduction in ipRGCs (Wong et al., 2005). Because that phenomenon was observed under synaptic blockade, it constitutes a form of cell-autonomous photoreceptor adaptation (Wong et al., 2005; Perlman & Normann, 1998). To the extent that DA contributes to light-driven desensitization in ipRGCs, it supplements the form of adaptation observed by Wong et al. (2005) rather than accounting for it.
Because retinal DA levels undergo circadian cycling that is independent of light exposure (Pozdeyev & Lavrikova, 2000), the effects of DA on melanopsin phototransduction imply some circadian variation in ipRGC sensitivity. Consistent with this, the gain of the ipRGC light response is slightly reduced during the circadian day compared to the early subjective night (Weng et al., 2009). Although DA could conceivably mediate such effects, this is not certain because those experiments were performed under synaptic blockade, which may have interfered with dopamine release (Puopolo et al., 2001; Gustincich et al., 1997; Boelen et al., 1998).
Furthermore, ipRGCs receive input from bipolar and amacrine cells (Belenky et al., 2003; Perez-Leon et al., 2006; Wong et al., 2007). Since D1 signaling pathways have been shown to modulate synaptic responses in other retinal neurons (Knapp & Dowling, 1987; Maguire & Werblin, 1994; Feigenspan & Bormann, 1994; Wellis & Werblin, 1995), D1 receptor-mediated effects on synaptic input to ipRGCs may represent another level of modulation of non-image-forming vision and would be an important avenue for future experiments.
Acknowledgements
This work was supported by National Institutes of Health grants R01 EY 12793 (D.M.B.) and R01 EY 17137 (D.M.B). M.J.V.H. was supported by a Jointly Sponsored Institutional Training Grant 1 T32 NS062443-01 (Brown University Neuroscience Graduate Program). K.Y.W. was supported by NIH grants F32 EY16678 and K99 EY18863. We thank D. Boghossian, D. Graham, P. Shapiro, and C. Frederick for technical assistance and A. Ishida, J. Kauer, and A. Zimmerman for helpful discussions. K.Y.W. is responsible for recordings in intact retina and their analysis. M.V.H. is responsible for recordings and analysis from isolated ipRGCs, the single-cell RT-PCR, and immunohistohemistry. M.V.H. and D.M.B. wrote the paper.
Abbreviations
- cAMP
cyclic adenosine monophosphate
- DA
dopamine
- DAC
dopaminergic amacrine cell
- GRK
G-protein receptor kinase
- ipRGC
intrinsically photosensitive retinal ganglion cell
- PBS
phosphate-buffered saline
- PKA
protein kinase A
- RT-PCR
reverse-transcription polymerase chain reaction
- SCN
suprachiasmatic nucleus
References
- Ballo AW, Keene JC, Troy PJ, Goeritz ML, Nadim F, Bucher D. Dopamine modulates Ih in a motor axon. J. Neurosci. 2010;30:8425–8434. doi: 10.1523/JNEUROSCI.0405-10.2010. [DOI] [PMC free article] [PubMed] [Google Scholar]
- Baver SB, Pickard GE, Sollars PJ, Pickard GE. Two types of melanopsin retinal ganglion cell differentially innervate the hypothalamic suprachiasmatic nucleus and the olivary pretectal nucleus. Eur. J. Neurosci. 2008;27:1763–1770. doi: 10.1111/j.1460-9568.2008.06149.x. [DOI] [PubMed] [Google Scholar]
- Belenky MA, Smeraski CA, Provencio I, Sollars PJ, Pickard GE. Melanopsin retinal ganglion cells receive bipolar and amacrine cell synapses. J. Comp. Neurol. 2003;460:380–93. doi: 10.1002/cne.10652. [DOI] [PubMed] [Google Scholar]
- Berson DM, Dunn FA, Takao M. Phototransduction by retinal ganglion cells that set the circadian clock. Science. 2002;295:1070–1073. doi: 10.1126/science.1067262. [DOI] [PubMed] [Google Scholar]
- Berson DM, Castrucci AM, Provencio I. Morphology and mosaics of melanopsin-expressing retinal ganglion cell types in mice. J. Comp. Neurol. 2010;518:2405–2422. doi: 10.1002/cne.22381. [DOI] [PMC free article] [PubMed] [Google Scholar]
- Bjelke B, Goldstein M, Tinner B, Andersson C, Sasack SR, Steinbusch HWM, Lew JY, He X, Watson S, Tengroth B, Fuxe K. Dopaminergic transmission in the rat retina: evidence for volume transmission. J. Chem. Neuroanat. 1996;12:37–50. doi: 10.1016/s0891-0618(96)00176-7. [DOI] [PubMed] [Google Scholar]
- Boelen MK, Mowlen MG, Marshak DW. Light-stimulated release of dopamine from the primate retina is blocked by l-2-amino-4-phosphonobutyric acid (APB) Vis. Neurosci. 1998;15:97–103. doi: 10.1017/s0952523898151040. [DOI] [PubMed] [Google Scholar]
- Chen L, Yang XL. Hyperpolarization-activated cation current is involved in modulation of the excitability of rat retinal ganglion cells by dopamine. Neuroscience. 2007;150:299–308. doi: 10.1016/j.neuroscience.2007.09.015. [DOI] [PubMed] [Google Scholar]
- Chen SK, Badea TC, Hattar S. Photoentrainment and pupillary light reflex are mediated by distinct populations of ipRGCs. Nature. 2011;476:92–95. doi: 10.1038/nature10206. [DOI] [PMC free article] [PubMed] [Google Scholar]
- Chyb S, Hevers W, Forte M, Wolfgang WJ, Selinger Z, Hardie RC. Modulation of the light response by cAMP in Drosophila photoreceptors. J. Neurosci. 1999;19:8799–8807. doi: 10.1523/JNEUROSCI.19-20-08799.1999. [DOI] [PMC free article] [PubMed] [Google Scholar]
- Contini M, Raviola E. GABAergic synapses made by a retinal dopaminergic neuron. Proc. Natl. Acad. Sci. U.S.A. 2003;100:1358–1363. doi: 10.1073/pnas.0337681100. [DOI] [PMC free article] [PubMed] [Google Scholar]
- Cronin MA, Diao F, Tsunoda S. Light-dependent subcellular translocation of Gqα in Drosophila photoreceptors is facilitated by the photoreceptor-specific myosin III NINAC. J. Cell Sci. 2004;117:4797–4806. doi: 10.1242/jcs.01371. [DOI] [PubMed] [Google Scholar]
- Cragg SJ, Rice ME. Dancing past the DAT at a DA synapse. TRENDS Neurosci. 2004;27:270–277. doi: 10.1016/j.tins.2004.03.011. [DOI] [PubMed] [Google Scholar]
- Davila V, Yan Z, Craciun LC, Logothetis D, Sulzer D. Dopamine autoreceptors do not activate G-protein gated inwardly rectifying potassium channel currents in substantia nigra dopamine neurons. J. Neurosci. 2003;23:5693–5697. doi: 10.1523/JNEUROSCI.23-13-05693.2003. [DOI] [PMC free article] [PubMed] [Google Scholar]
- Dosé AC, Burnside B. Cloning and chromosomal localization of a human class III myosin. Genomics. 2000;67:333–342. doi: 10.1006/geno.2000.6256. [DOI] [PubMed] [Google Scholar]
- Dosé AC, Burnside B. A class III myosin expressed in the retina is a potential candidate for Bardet-Biedl syndrome. Genomics. 2002;79:621–624. doi: 10.1006/geno.2002.6749. [DOI] [PubMed] [Google Scholar]
- Feigenspan A, Bormann J. Facilitation of GABAergic signaling in the retina by receptors stimulating adenylate cyclase. Proc. Natl. Acad. Sci. U.S.A. 1994;91:10893–10897. doi: 10.1073/pnas.91.23.10893. [DOI] [PMC free article] [PubMed] [Google Scholar]
- Garris PA, Ciolkowski EL, Pastore P, Wightman RM. Efflux of dopamine from the synaptic cleft in the nucleus accumbens of the rat brain. J. Neurosci. 1994;14:6084–6093. doi: 10.1523/JNEUROSCI.14-10-06084.1994. [DOI] [PMC free article] [PubMed] [Google Scholar]
- Gooley JJ, Lu J, Chou TC, Scammell TE, Saper CB. Melanopsin in cells of origin of the retinohypothalamic tract. Nat. Neurosci. 2001;4:1165. doi: 10.1038/nn768. [DOI] [PubMed] [Google Scholar]
- Govindaiah G, Cox CL. Excitatory actions of dopamine via D1-like receptors in the rat lateral geniculate nucleus. J. Neurophysiol. 2005;94:3708–3718. doi: 10.1152/jn.00583.2005. [DOI] [PubMed] [Google Scholar]
- Graham DM, Wong KY, Shapiro P, Frederick C, Pattabiraman K, Berson DM. Melanopsin ganglion cells use a membrane-associated rhabdomeric phototransduction cascade. J. Neurophysiol. 2008;99:2522–2532. doi: 10.1152/jn.01066.2007. [DOI] [PubMed] [Google Scholar]
- Gustincich S, Feigenspan A, Wu GK, Koopman LJ, Raviola E. Control of dopamine release in the retina: a transgenic approach to neural networks. Neuron. 1997;18:723–736. doi: 10.1016/s0896-6273(00)80313-x. [DOI] [PubMed] [Google Scholar]
- Hannibal J, Hindersson P, Knudsen SM, Georg B, Fahrengrug J. The photopigment melanopsin is exclusively present in pituitary adenylate cyclase-activating polypeptide-containing retinal ganglion cells of the retinohypothalamic tract. J Neurosci. 2002;22:RC191, 1–7. doi: 10.1523/JNEUROSCI.22-01-j0002.2002. [DOI] [PMC free article] [PubMed] [Google Scholar]
- Hartwick ATE, Bramley JR, Yu J, Stevens KT, Allen CN, Baldridge WH, Scollars PJ, Pickard GE. Light-evoked calcium responses of isolated melanopsin-expressing retinal ganglion cells. J. Neurosci. 2007;27:13468–13480. doi: 10.1523/JNEUROSCI.3626-07.2007. [DOI] [PMC free article] [PubMed] [Google Scholar]
- Hattar S, Liao HW, Takao M, Berson DM, Yau KW. Melanopsin-containing retinal ganglion cells: architecture, projections, and intrinsic photosensitivity. Science. 2002;295:1065–1070. doi: 10.1126/science.1069609. [DOI] [PMC free article] [PubMed] [Google Scholar]
- Hattar S, Kumar M, Park A, Tung J, Yau KW, Berson DM. Central projections of melanopsin-expressing retinal ganglion cells in the mouse. J. Comp. Neurol. 2006;497:326–349. doi: 10.1002/cne.20970. [DOI] [PMC free article] [PubMed] [Google Scholar]
- Hayashida Y, Ishida AT. Dopamine receptor activation can reduce voltage-gated Na+ current by modulating both entry into and recovery from inactivation. J. Nerophysiol. 2004;92:3134–3141. doi: 10.1152/jn.00526.2004. [DOI] [PMC free article] [PubMed] [Google Scholar]
- Hayashida Y, Rodriguez CV, Ogata G, Partida GJ, Oi H, Stradleigh TW, Lee SC, Colado AF, Ishida AT. Inhibition of adult rat retinal ganglion cells by D1-type dopamine receptor activation. J. Neurosci. 2009;29:15001–15016. doi: 10.1523/JNEUROSCI.3827-09.2009. [DOI] [PMC free article] [PubMed] [Google Scholar]
- Horner TJ, Osawa S, Schaller MD, Weiss ER. Phorphorylation of GRK1 and GRK7 by cAMP-dependent protein kinase attenuates their enzymatic activities. J. Biol. Chem. 2005;280:28241–28250. doi: 10.1074/jbc.M505117200. [DOI] [PubMed] [Google Scholar]
- Huang J, Zhou H, Mahavadi S, Sriwai W, Murthy KS. Inhibition of Gαq-dependent PLC-β1 activity by PKG and PKA is mediated by phosphorylation of RGS4 and GRK2. Am. J. Physiol. Cell. Physiol. 2007;292:C200–C208. doi: 10.1152/ajpcell.00103.2006. [DOI] [PubMed] [Google Scholar]
- Huang Q, Zhou D, Chase K, Gusella JF, Aronin N, DiFiglia M. Immunohistochemical localization of the D1 dopamine receptor in rat brain reveals its axonal transport, pre- and postsynaptic localization, and prevelance in the basal ganglia, limbic system, and thalamic reticular nucleus. Proc. Natl. Acad. Sci. USA. 1992;89:11988–11992. doi: 10.1073/pnas.89.24.11988. [DOI] [PMC free article] [PubMed] [Google Scholar]
- Katti C, Dalal JS, Dosé AC, Burnside BA. Cloning and distribution of myosin 3B in the mouse retina: differential distribution in cone outer segments. Exp. Eye. Res. 2009;89:224–237. doi: 10.1016/j.exer.2009.03.011. [DOI] [PMC free article] [PubMed] [Google Scholar]
- Knapp AG, Dowling JE. Dopamine enhances excitatory amino acid-gated conductances in cultured retinal horizontal cells. Nature. 1987;325:437–439. doi: 10.1038/325437a0. [DOI] [PubMed] [Google Scholar]
- Lee SJ, Montell C. Light-dependent translocation of visual arrestin regulated by the NINAC myosin III. Neuron. 2004;43:95–103. doi: 10.1016/j.neuron.2004.06.014. [DOI] [PubMed] [Google Scholar]
- Lee SP, So CH, Rashid AJ, Varghese G, Cheng R, Lanca AJ, O’Dowd BF, George SR. Dopamine D1 and D2 receptor co-activation generates a novel phospholipase C-mediated calcium signal. J. Biol. Chem. 2004;279:35671–35678. doi: 10.1074/jbc.M401923200. [DOI] [PubMed] [Google Scholar]
- Li H, Gaughwin P, Li N, He S. Localization of a dopamine D1-receptor to A-type horizontal cells in the rabbit retina by single cell RT-PCR. Neurosci. Lett. 2004;355:146–148. doi: 10.1016/j.neulet.2003.10.042. [DOI] [PubMed] [Google Scholar]
- Liu Y, Lasater EM. Calcium currents in turtle retinal ganglion cells II. Dopamine modulation via a cyclic AMP-dependent mechanism. J. Neurophysiol. 1994;71:743–752. doi: 10.1152/jn.1994.71.2.743. [DOI] [PubMed] [Google Scholar]
- Maguire G, Werblin F. Dopamine enhances a glutamate-gated ionic current in OFF bipolar cells of the tiger salamander retina. J. Neurosci. 1994;14:6094–6107. doi: 10.1523/JNEUROSCI.14-10-06094.1994. [DOI] [PMC free article] [PubMed] [Google Scholar]
- Meyer-Franke A, Kaplan MR, Pfrieger FW, Barres BA. Characterization of the signaling interactions that promote the survival and growth of developing retinal ganglion cells in culture. Neuron. 1995;15:805–819. doi: 10.1016/0896-6273(95)90172-8. [DOI] [PubMed] [Google Scholar]
- Nguyen-Legros J, Chanut E, Versaux-Botteri C, Simon A, Trouvin JH. Dopamine inhibits melatonin synthesis in photoreceptor cells through a D2-like receptor subtype in the rat retina: biochemical and histochemical evidence. J. Neurochem. 1996;67:2514–2520. doi: 10.1046/j.1471-4159.1996.67062514.x. [DOI] [PubMed] [Google Scholar]
- Nguyen-Legros J, Simon A, Caille I, Bloch B. Immunocytochemical localization of dopamine D1 receptors in the retina of mammals. Vis. Neurosci. 1997;14:545–551. doi: 10.1017/s0952523800012207. [DOI] [PubMed] [Google Scholar]
- Neve KA, Seamand JK, Trantham-Davidson H. Dopamine receptor signaling. J. Recept. Signal. Transduct. Res. 2004;24:165–205. doi: 10.1081/rrs-200029981. [DOI] [PubMed] [Google Scholar]
- Osawa S, Jo R, Weiss ER. Phosphorylation of GRK7 by PKA in cone photoreceptor cells is regulated by light. J. Neurochem. 2008;107:1314–1324. doi: 10.1111/j.1471-4159.2008.05691.x. [DOI] [PMC free article] [PubMed] [Google Scholar]
- Østergaard J, Hannibal J, Fahrenkrug J. Synaptic contact between melanopsin-containing retinal ganglion cells and rod bipolar cells. Invest. Ophthalmol. Vis. Sci. 2007;48:3812–3820. doi: 10.1167/iovs.06-1322. [DOI] [PubMed] [Google Scholar]
- Peiser C, Trevisani M, Groneberg DA, Dinh QT, Lencer D, Amadesi S, Maggiore B, Harrison S, Geppetti P, Fischer A. Dopamine type 2 receptor expression and function in rodent sensory systems projecting to the airways. Am. J. Physiol. Lung Cell. Mol. Physiol. 2005;289:L153–L158. doi: 10.1152/ajplung.00222.2004. [DOI] [PubMed] [Google Scholar]
- Perez-Leighton CE, Schmidt TM, Abramowitz J, Birnbaumer L, Kofuji P. Intrinsic phototransduction persists in melanopsin-expressing ganglion cells lacking diacylglycerol-sensitive TRPC subunits. Eur. J. Neurosci. 2011;33:856–867. doi: 10.1111/j.1460-9568.2010.07583.x. [DOI] [PMC free article] [PubMed] [Google Scholar]
- Perez-Leon A, Warren EJ, Allen CN, Robinson DW, Brown RL. Synaptic inputs to retinal ganglion cells that set the circadian clock. Eur. J. Neurosci. 2006;24:1117–1123. doi: 10.1111/j.1460-9568.2006.04999.x. [DOI] [PMC free article] [PubMed] [Google Scholar]
- Perlman I, Normann RA. Light adaptation and sensitivity controlling mechanisms in vertebrate photoreceptors. Prog. Retin. Eye Res. 1998;17:523–563. doi: 10.1016/s1350-9462(98)00005-6. [DOI] [PubMed] [Google Scholar]
- Porter JA, Minke B, Montell C. Calmodulin binding to Drosophila NinaC required for termination of phototransduction. EMBO J. 1995;14:4450–4459. doi: 10.1002/j.1460-2075.1995.tb00124.x. [DOI] [PMC free article] [PubMed] [Google Scholar]
- Pozdeyev NV, Lavrikova EV. Diurnal changes of tyrosine, dopamine, and dopamine metabolites content in the retina of rats maintained at different lighting conditions. J. Mol. Neurosci. 2000;15:1–9. doi: 10.1385/JMN:15:1:1. [DOI] [PubMed] [Google Scholar]
- Provencio I, Jiang G, De Grip WJ, Hayes WP, Rollag MD. Melanopsin: an opsin in melanophores, brain, and eye. Proc. Natl. Acad. Sci. USA. 1998;95:340–345. doi: 10.1073/pnas.95.1.340. [DOI] [PMC free article] [PubMed] [Google Scholar]
- Puopolo M, Hochstetler SE, Gustincich S, Wightman RM, Raviola E. Extrasynaptic release of dopamine in a retinal neuron: activity dependence and transmitter modulation. Neuron. 2001;30:211–225. doi: 10.1016/s0896-6273(01)00274-4. [DOI] [PubMed] [Google Scholar]
- Rosenkranz JA, Johnston D. Dopaminergic regulation of neuronal excitability through modulation of Ih in layer V entorhinal cortex. J. Neurosci. 2006;26:3229–3244. doi: 10.1523/JNEUROSCI.4333-05.2006. [DOI] [PMC free article] [PubMed] [Google Scholar]
- Sakamoto K, Liu C, Kasamatsu M, Pozdeyev NV, Iuvone MP, Tosini G. Dopamine regulates melanopsin mRNA expression in intrinsically photoreceptive retinal ganglion cells. Eur. J. Neurosci. 2005;22:3129–3136. doi: 10.1111/j.1460-9568.2005.04512.x. [DOI] [PubMed] [Google Scholar]
- Sekaran S, Lall GS, Ralphs KL, Wolstenholme AJ, Lucas RJ, Foster RG, Hankins MW. 2-Aminoethoxydiphenylborane is an acute inhibitor of directly photosensitive retinal ganglion cell activity in vitro and in vivo. J. Neurosci. 2007;27:3981–3986. doi: 10.1523/JNEUROSCI.4716-06.2007. [DOI] [PMC free article] [PubMed] [Google Scholar]
- Schmidt TM, Kofuji P. Functional and morphological differences among intrinsically photosensitive retinal ganglion cells. J. Neurosci. 2009;29:476–482. doi: 10.1523/JNEUROSCI.4117-08.2009. [DOI] [PMC free article] [PubMed] [Google Scholar]
- Surmeier J, Song WJ, Yan Z. Coordinated expression of dopamine receptors in neostriatal medium spiny neurons. J. Neurosci. 1996;16:6579–6591. doi: 10.1523/JNEUROSCI.16-20-06579.1996. [DOI] [PMC free article] [PubMed] [Google Scholar]
- Tawfeek HAW, Abou-Samra AB. Negative regulation of parathyroid hormone (PTH)-activated phospholipase C by PTH/PTH-related peptide receptor phosphorylation and protein kinase A. Endocrinology. 2008;149:4016–4023. doi: 10.1210/en.2007-1375. [DOI] [PMC free article] [PubMed] [Google Scholar]
- Tran VT, Dickman M. Differential localization of dopamine D1 and D2 receptors in the rat retina. Invest. Ophthalmol. Vis. Sci. 1992;33:1620–1626. [PubMed] [Google Scholar]
- Van Hook MJ, Berson DM. Hyperpolarization-activated current (Ih) in ganglion-cell photoreceptors. PLoS One. 2010;5:e15344. doi: 10.1371/journal.pone.0015344. [DOI] [PMC free article] [PubMed] [Google Scholar]
- Vaquero CF, Pignatelli A, Partida GJ, Ishida AT. A dopamine- and protein kinase A-dependent mechanism for network adaptation in retinal ganglion cells. J. Neurosci. 2001;21:8624–8635. doi: 10.1523/JNEUROSCI.21-21-08624.2001. [DOI] [PMC free article] [PubMed] [Google Scholar]
- Veruki ML, Wässle H. Immunohistochemical localization of dopamine D1 receptors in rat retina. Eur. J. Neurosci. 1996;8:2286–2297. doi: 10.1111/j.1460-9568.1996.tb01192.x. [DOI] [PubMed] [Google Scholar]
- Viney TJ, Balint K, Hillier D, Siegert S, Boldogkoi Z, Enquist LW, Meister M, Cepko CL, Roska B. Local retinal circuits of melanopsin-containing ganglion cells identified by transsynaptic viral tracing. Curr. Biol. 2007;17:981–988. doi: 10.1016/j.cub.2007.04.058. [DOI] [PubMed] [Google Scholar]
- Vugler AA, Redgrave P, Semo M, Lawrence J, Greenwood J, Coffey PJ. Dopamine neurons form a discrete plexus with melanopsin cells in normal and degenerating retina. Exp. Neurol. 2007;205:26–35. doi: 10.1016/j.expneurol.2007.01.032. [DOI] [PubMed] [Google Scholar]
- Warr CG, Kelly LE. Identification and characterization of two distinct calmodulin-binding sites in the Trpl ion-channel protein of Drosophila melanogaster. Biochem. J. 1996;314:497–503. doi: 10.1042/bj3140497. [DOI] [PMC free article] [PubMed] [Google Scholar]
- Warren EJ, Allen CN, Brown RL, Robinson DW. Intrinsic light responses of retinal ganglion cells projecting to the circadian system. Eur. J. Neurosci. 2003;17:1727–1725. doi: 10.1046/j.1460-9568.2003.02594.x. [DOI] [PMC free article] [PubMed] [Google Scholar]
- Warren EJ, Allen CN, Brown RL, Robinson DW. The light-activated signaling pathway in SCN-projecting rat retinal ganglion cells. Eur. J. Neurosci. 2006;23:2477–2487. doi: 10.1111/j.1460-9568.2006.04777.x. [DOI] [PMC free article] [PubMed] [Google Scholar]
- Wellis DP, Werblin FS. Dopamine modulates GABAc receptors mediating calcium entry into and transmitter release from bipolar cell terminals in tiger salamader retina. J. Neurosci. 1995;15:4748–4761. doi: 10.1523/JNEUROSCI.15-07-04748.1995. [DOI] [PMC free article] [PubMed] [Google Scholar]
- Weng S, Wong KY, Berson DM. Circadian modulation of melanopsin-driven light response in rat ganglion-cell photoreceptors. J. Biol. Rhythms. 2009;24:391–402. doi: 10.1177/0748730409343767. [DOI] [PMC free article] [PubMed] [Google Scholar]
- Witkovsky P. Dopamine and retinal function. Doc. Opthalmol. 2004;108:17–40. doi: 10.1023/b:doop.0000019487.88486.0a. [DOI] [PubMed] [Google Scholar]
- Wong KY, Dunn FA, Berson DM. Photoreceptor adaptation in intrinsically photosensitive retinal ganglion cells. Neuron. 2005;48:1001–1010. doi: 10.1016/j.neuron.2005.11.016. [DOI] [PubMed] [Google Scholar]
- Wong KY, Dunn FA, Graham DM, Berson DM. Synaptic influences on rat ganglion-cell photoreceptors. J. Physiol. 2007;582:279–296. doi: 10.1113/jphysiol.2007.133751. [DOI] [PMC free article] [PubMed] [Google Scholar]
- Wu J, Hablitz JJ. Cooperative activation of D1 and D2 dopamine receptors enhances a hyperpolarization-activared inward current in layer I interneurons. J. Neurosci. 2005;25:6322–6328. doi: 10.1523/JNEUROSCI.1405-05.2005. [DOI] [PMC free article] [PubMed] [Google Scholar]
- Yue C, Dodge KL, Weber G, Sanborn BM. Phosphorylation of serine 1105 by protein kinase A inhibits phospholipase Cβ3 stimulation by Gαq. J. Biol. Chem. 1998;273:18023–18027. doi: 10.1074/jbc.273.29.18023. [DOI] [PubMed] [Google Scholar]
- Zhang D-Q, Wong KY, Sollars PJ, Berson DM, Pickard GE, McMahon DG. Intraretinal signaling by ganglion cell photoreceptors to dopaminergic amacrine neurons. Proc. Natl. Acad. Sci. U.S.A. 2008;105:14181–14186. doi: 10.1073/pnas.0803893105. [DOI] [PMC free article] [PubMed] [Google Scholar]