

Abstract
The distribution of effects of beneficial mutations is key to our understanding of biological adaptation. Yet, empirical estimates of this distribution are scarce, and its functional form is largely unknown. Theoretical models of adaptation predict that the functional form of this distribution should depend on the distance to the optimum. Here, we estimate the rate and distribution of adaptive mutations that compensate for the effect of a single deleterious mutation, which causes antibiotic resistance. Using a system with multiple molecular markers, we estimate the distribution of fitness effects of mutations at two distances from the adaptive peak in 60 populations of Escherichia coli. We find that beneficial mutations, which can contribute to compensatory evolution, occur at very high rates, of the order of 10−5 per genome per generation and can be detected within a few tens of generations. They cause an average fitness increase of 2.5% and 3.6%, depending on the cost of resistance, which is expected under Fisher's geometrical model of adaptation. Moreover, we provide the first description of the distribution of beneficial mutations, segregating during the process of compensatory evolution, to antibiotic resistances bearing different costs. Hence, these results have important implications to understanding the spread and maintenance of antibiotic resistance in bacteria.
Keywords: selection coefficients, compensatory adaptation, antibiotic resistance, Fisher's geometrical model of adaptation, distribution of fitness effects, Escherichia coli
Introduction
Our understanding of biological adaptation relies heavily on knowledge of the distribution of effects of beneficial mutations. An important problem within adaptation is how much of it involves the accumulation of compensatory mutations (Burch and Chao 1999; Poon et al. 2005; Betancourt 2007), which contribute to fitness recovery after some deleterious mutations got fixed. This is important even for bacterial populations, that despite having large population sizes, also have a high frequency of slightly deleterious mutations (Hughes 2005) and can exhibit compensatory adaptation in a few hundreds of generations (Moore et al. 2000). Furthermore, it is critical in the context of antibiotic resistance. It is known that resistance mutations tend to be costly to bacteria in environments free of antibiotics (Trindade et al. 2009; Andersson and Hughes 2010); however, compensatory adaptation allows for the persistence of resistances alleles after antibiotics have been removed (Schrag et al. 1997). This is so because compensatory mutations for antibiotic resistances tend to be deleterious in the absence of the resistance mutations, which counter selects reversion to the sensitive genotype. Estimating the distribution of compensatory mutations for antibiotic resistances is thus necessary to predict the likelihood and rate of compensatory adaptation (MacLean et al. 2010). In fact, the distribution of fitness effects of compensatory mutations has been shown to be a determining factor to be able to make reasonable predictions on the evolution of drug resistance in different pathogenic bacteria (Handel et al. 2006). It is also very likely that compensatory mutations might have deleterious effects on different traits, a question that would require studying the full map of genotype–phenotype fitness. Here, we study the rate and effects of beneficial mutations that compensate for the cost of two different antibiotic resistance mutations in Escherichia coli. We then test if our findings are consistent with the recent theoretical predictions of models of adaptation.
Fisher (1930) proposed a geometrical model (FGM) to describe the process of adaptation, from which predictions for the distribution of fitness effects of mutations were derived (Orr 1998; Martin and Lenormand 2006, 2008). One of the strengths of FGM (Fisher 1930) is that it incorporates the occurrence of compensatory mutations. It is therefore a natural theoretical model to consider when addressing the distribution of effects of mutations that compensate for the cost of antibiotic resistance (MacLean et al. 2010). Support for FGM has been found in the context of fitness recovery of a bacteriophage evolved under different effective population sizes (Burch and Chao 1999).
More recently, other models of adaptive evolution, focusing on sequence space, have been proposed (Gillespie 1983; Orr 2005a). Both Fisher and Gillespie's models (Joyce et al. 2008) make the prediction that the mean effect of beneficial mutations should decrease as populations get close to the optimum (see Materials and Methods for a quantitative prediction of Fisher's model). A recently studied generalized version of FGM led to the prediction that, when populations are not too far from the fitness peak, arising beneficial mutations should follow a beta distribution with unit shape parameter (α = 1) and contending mutations should follow a beta with α = 2 (Martin and Lenormand 2008).
Beneficial mutations are far less common than deleterious ones, which make empirical observations on the distribution of advantageous mutations extremely difficult. Hence, theoretical expectations of classical fitness landscape models have been difficult to test (Orr 2005a, 2010). However, recent technical advances (Imhof and Schlotterer 2001), renewed interest (Orr 2005a), and the power of microbial experimental evolution (Elena and Lenski 2003) have fostered the possibility to develop new and more powerful tests (Gerrish and Lenski 1998; Rozen et al. 2002; Perfeito et al. 2007; Schoustra et al. 2009). The distribution of arising mutations is the most difficult to estimate (Kassen and Bataillon 2006), whereas the distribution of mutations that fix or reach detectable frequencies is more accessible (Barrett et al. 2006; Perfeito et al. 2007; Schoustra et al. 2009). Although the data are not abundant, the distribution of newly arising mutations has been studied in some bacterial species and in different environments. It has been shown that this distribution follows an exponential law in cases where the starting genotype is reasonably well adapted to the environment but not when the distance to the optimum increases (Kassen and Bataillon 2006; MacLean and Buckling 2009; McDonald et al. 2011). In contrast, the distribution of mutations upon which selection has acted (which includes both contending and fixed mutations) has been the object of several experimental attempts (Imhof and Schlotterer 2001; Rozen et al. 2002; Barrett et al. 2006; Hegreness et al. 2006; Perfeito et al. 2007; Rokyta et al. 2008; Schoustra et al. 2009). A bell-shaped distribution has been estimated as the one that best describes the first fixation event, whether it is the result of one (Barrett et al. 2006; Rokyta et al. 2008) or perhaps several mutations (Rozen et al. 2002; Hegreness et al. 2006; Schoustra et al. 2009).
In a number of the above-mentioned studies, adaptation was studied in organisms that carried resistance mutations (Schoustra et al. 2009; Barrick et al. 2010; Hall et al. 2010). The mutations detected, however, may not be exclusively compensatory to the antibiotic resistance. To our knowledge, we present the first study that directly addresses the rate and effects of compensatory mutations because we study populations that were adapted to the environment prior to the introduction of resistance (which was not done in previous studies). We followed the adaptation of two isogenic clones of E. coli, differing by a single point mutation, and used a system that contains many more neutral markers than previous studies, to infer the effects of compensatory mutations to streptomycin resistance. Streptomycin is an aminoglycoside that binds to the ribosome, interferes with polypeptide synthesis during translation, and induces misreading of the genetic code (Ruusala et al. 1984; Kohanski et al. 2010). Resistance to this antibiotic typically results from mutations in the gene rpsL, encoding the ribosomal protein S12, which prevents the drug from binding to the ribosome. A multitude of different alleles at this locus conferring resistance is known to occur in natural bacterial populations (Brzostek et al. 2004). The cost of each of the two mutations studied here was measured in competition against a reference strain, in rich medium, and was found to be about 18% for the K43N mutation and about 27% for the K88E mutation, similar to what was measured before (Trindade et al. 2009). Such mutations are not only costly but also likely to be highly pleiotropic. Therefore, we interpret adaptation toward a new fitness peak in the light of FGM. For instance, Maisnier-Patin et al. (2002) studied compensatory adaptation to the presence of the mutation K43N (rpsL) in Salmonella typhimurium, homologous to the one reported here. They found at least 35 different compensatory mutations in four genes, which point to rpsL being a highly pleiotropic gene where deleterious mutations can be compensated by many different mechanisms. Here, we use information on these mutations conferring resistance to create two sets of populations that differ exclusively in a mutation that places these populations at different distances from the optimum. Subsequently, we use an extremely powerful experimental approach to detect beneficial mutations, based on a system of several neutral markers, first developed by (Imhof and Schlotterer 2001) and (Perfeito et al. 2007) but improved for sensitivity. This setup allows us to access the distribution of contending beneficial mutations with a resolution that has never been achieved previously. After estimating the distribution of contending mutations, we estimate the rate of occurrence of compensatory mutations from the mean number of mutations observed in each set of replicated populations undergoing compensatory adaptation. We find that compensatory mutations are pervasive and very rapidly allow partial compensation of the effects of single strongly deleterious mutations. We further show that FGM provides a reasonable theoretical framework on which to interpret the dynamics of compensatory evolution of antibiotic resistance.
Materials and Methods
Bacterial Strains and Plasmids
The strains used were E. coli K12 MG1655 wild type (ara+) and Δara. The latter was used as the reference strain for the competition fitness assays. These two strains are easy to distinguish in tetrazolium arabinose indicator agar since Δara gives rise to red colonies (due to a deletion in the arabinose operon) (Lenski et al. 1991) and ara+ originates white colonies.
The plasmid pBR322 carrying a microsatellite fragment cloned between the HindIII and BamHI sites with 32 GA repeats, previously constructed by Perfeito et al. (2007), was further modified in the number of GA repeats to obtain nine different markers. These plasmids were then used to transform nine subpopulations derived from the ancestor E. coli clone. These subpopulations were subsequently modified by P1 transduction (Silhavy 1984) to incorporate one point mutation conferring streptomycin resistance (either K43N; AAA to AAC or K88E; AAA to GAA).
Preadaptation Experiment
In order to guarantee that the distance to the adaptive peak was due to the mutation conferring antibiotic resistance only, we performed experimental evolution of the wild-type strain during 2,400 generations prior to introducing these mutations. The environment for this preadaptation was the same as that used in the subsequent experiment (see below). During the first 1,400 generations, a 3% increase in fitness was observed, after which the fitness of the population reached a plateau (fig. 2). A single clone from the 1,400 generations evolved population was selected as the ancestor for the compensatory evolution experiment, assuring that the genetic background before the transference of the antibiotic resistance mutations was the same.
FIG. 2.

Adaptation to a fitness peak. Fitness increased (relative to the ancestral strain) about 3% in the first 1,400 generations and reached a plateau thereafter. The clone used for the compensatory evolution was picked at generation 1,400. The error bars denote two times the SE. The mean at generation 184 is not significantly different from that at generation 0.
Evolution Experiment
Each of the initial populations was composed of nine subpopulations bearing a plasmid with a microsatellite with different numbers of the repeat unit (GA), at approximately the same frequency (∼1/9). In this bacterial strain, the microsatellites mutate at much smaller rates than in other strains (Schlotterer et al. 2006; Perfeito et al. 2007), such that during the time course of the experiment, no novel microsatellite alleles were detected. To access the neutrality of the marker system, we measured the growth rate of the ancestral bacteria with and without the plasmid (pBR322). No significant difference was found so this plasmid has a negligible cost to the bacteria. Furthermore, we inferred adaptive events in all the nine microsatellites, supporting their neutrality. Each population carried either a K43N or a K88E mutation. There were 30 independent populations per mutation. The evolution experiment was initiated by inoculating 10 ml of Luria Bertani medium (LB) with approximately 1,000 cells, which were allowed to grow for 24 h at 37 °C with aeration, reaching approximately a concentration of 109 CFU/ml in each population. Every day, these cultures were propagated with a constant dilution factor of 10−6, corresponding to transference of a sample of about 1,000 cells to seed another flask with 10 ml of fresh medium. In this way, the number of generations per day corresponds to 23. The experiment was carried out during 69 generations, which was sufficient time to be able to detect at least one compensatory mutation in every population. The effective population size in the experiment minimizes the effects of clonal interference and accumulation of deleterious mutations.
Microsatellite Frequency Measurement
In all populations, the frequency of each subpopulation tagged with a different microsatellite marker was daily quantified, that is, approximately every 23 generations. The quantification procedure involved the extraction of plasmid DNA using the High Pure Plasmid Isolation Kit (Roche), according to the manufacturer's instructions and the subsequent double digestion with EcoRV and SgrAI for 2 h at 37 °C. The two enzymes' recognition sequences are located next to each end of the microsatellite, so a double digestion isolates this fragment from the rest of the plasmid. Subsequently, the restriction reaction was purified using the NucleoSpin Extract II Kit (Macherey-Nagel). The purified restriction products were then fluorescently labeled with ABI PRISM SNaPshot Multiplex Kit (Applied Biosystems). This kit consists of a mixture of four dideoxynucleotides labeled with different fluorochromes, DNA polymerase, and the corresponding buffer. One of the ends of the microsatellite contains a fragment with a 3′OH recessed end, which was used by the polymerase to add the appropriate fluorescently labeled dideoxynucleotide. The resulting labeled fragments were then separated using the 3130xl Genetic Analyzer (Applied Biosystems), and the area under the peaks was used to calculate the relative frequency of each microsatellite in the population. This new method introduces much less error in the estimation of frequency than previous methods involving hybridization with a radioactive labeled probe.
Microsatellite Analysis
We considered that an adaptive event occurred when a significant change in frequency (ΔF) of a microsatellite allele was observed as in previous studies (Schlotterer et al. 2006; Perfeito et al. 2007). Specifically, ΔF was considered to be significant when ΔF > 2 (SD Pi + SD Pf), where SD Pi and SD Pf are the standard deviations (SDs) associated with the initial (Pi) and final (Pf) frequencies of the microsatellite in the observed interval. To estimate the SD associated with the microsatellite frequency, we made nine independent mixtures of two microsatellites at different frequencies, extracted plasmid DNA and quantified it as previously described. The error associated with the experimental procedure corresponds to a SD = 0.01, such that only increases in frequency above 4% were considered significant. This implies that we are not able to detect mutations of very small effect on one hand, and on the other hand, the selection coefficient of the mutations detected has a small error.
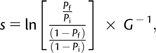
The selective coefficient (s) of each mutation was then calculated (following Crow and Kimura 1970; Schlotterer et al. 2006; Perfeito et al. 2007):
 |
(1) |
where G is the number of generations (23, 46, or 69) for which a significant increase in frequency was observed.
There are two potential biases in this estimation of selection coefficients, which arise from two different causes. The equation assumes that no clonal interference occurs and that a single selective sweep is happening in the course of our experiment. Since we have evidence for the existence of multiple mutations segregating in our populations, the estimates of s will be biased by that fact. However, we can minimize such a bias if we measure the values of s while the mutations are at low frequency since the effect of clonal interference will only lead to large biases when more than one mutation is at high frequency. In order to minimize this effect, we estimated the selection coefficient from the first significant change in frequency detected. In this analysis, we assume that a significant change in frequency of the neutral marker reflects a corresponding change in frequency of the linked beneficial mutation. This assumption is only strictly met when the beneficial mutation is fixed within the subpopulation that carries the particular neutral marker. This is likely for mutations of large effect but may not to be accomplished for mutations of small fitness effect. To assess the importance of this, we have performed Monte Carlo simulations of asexual populations carrying nine different neutral markers where we followed the fate of a beneficial mutation and the linked neutral allele. As in our experiments, in the discrete time stochastic simulations, we also assume that the population undergoes periodic bottlenecks every 23 generations to a size of a 1,000 individuals. Every generation the population size doubles, the expected frequency of the different classes present in the population (carrying the different microsatellite markers) is calculated according to its deterministic expectation. Genetic drift is modeled by multinomial sampling. Twenty replicate simulations of populations were done in which a beneficial mutation with a given selection coefficient was followed. In these simulations, we observe that beneficial mutations of very small effect (less than 1%) can only cause detectable changes in frequency of the linked marker if they are at very high frequency in the marker subpopulation. This means that we may miss very small effect mutations with this detection method. Furthermore, the simulations indicate that the estimated s values of mutations with s < 1% may be slightly underestimated, if they are at a very low, albeit detectable frequency, within the time frame of this study. The vast majority of the mutations observed in this study resulted in s values larger than 1%, so, except for a few mutations (9% in the case of K43N and 3% in the case of K88E), we do not expect their effects to be underestimated.
Fitness Assays
The fitness cost of the two mutations conferring antibiotic resistance as well as the fitness of the evolved population (for ∼1,400 generations) in the preadaptation experiment was measured by competitive growth against the reference strain E. coli K12 MG1655 Δara. The competitor and the reference strains were grown separately and then mixed in a proportion of 1:1 in the competition tube containing 10 ml of LB. They were then allowed to compete for approximately 24 h. The initial and final ratio of the strains was determined by plating appropriate dilutions of the cultures in tetrazolium arabinose indicator agar. The fitness cost of each resistance mutation, that is, the selection coefficient, was estimated as the difference per generation in Malthusian parameters for the resistant strain and the marker strain (Lenski et al. 1991), discounted by the cost of the Δara marker. The fitness cost of each mutation was determined as the average of six independent measurements for the K43N mutation and eight independent measurements for the K88E mutation. The fitness increase of the preadaptation experiment was based on five independent measurements.
Reversion Assays
The reversion of the antibiotic resistance phenotype to the sensitive state was tested for all the evolved populations after 69 generations. This was done by plating each of the 60 populations in LB agar and replica plating more than 50 colonies per population into LB agar plus 100 μg/ml of streptomycin. Bacteria that grew on LB agar but failed to form colonies in LB agar plus streptomycin were scored as revertants (these were only detected in three populations initially carrying K88E mutation). The rpsL gene was sequenced for a sample of these clones in order to confirm that this phenotype was the result of a back mutation (E88K; GAA to AAA).
Statistical Analysis
All statistical analyses were performed using R 2.3.1 (http://cran.r-project.org/ [date last accessed June 2011]) and Mathematica 6.0 (Wolfram Research 2007).
We tested if the distribution of fitness effects of the mutations compensating for each of the resistances were compatible with the predictions from FGM of adaptation. Fisher (1930) considered that an organism is described by a number of phenotypic traits (n), each having an optimum value in a given environment and a population located away from that optimum. This displacement could be caused either by an environmental change or by the fixation of a deleterious allele. New mutations, considered as random vectors in the geometric space of trait values, can then move the population closer to the optimum. Those that do so are beneficial and can contribute to adaptation to that environment. In the process of adaptation, three types of distributions of beneficial mutations can be distinguished (Rozen et al. 2002): the distribution of arising mutations (the focus of Fisher when he proposed his geometrical model), the distribution of mutations that escape stochastic loss—also called contending mutations (which are those detected in this study)—and the distribution of mutations that fix as the population adapts. In sexual populations or in asexual populations with low mutational input (NeU << 1), the distribution of contending mutations is expected to be the same as that of fixed mutations. This is so because clonal interference—the process of competition between clones carrying distinct adaptive alleles—is reduced under low NeU and every mutation that escapes initial loss will fix before any other mutation arises (Gerrish and Lenski 1998; Perfeito et al. 2007).
Predictions under FGM
To predict the distribution of compensatory mutations under FGM, we started with a phenotype at a given distance from the optimum w0, which corresponds to a fitness difference to the most fit phenotype (which has fitness 1) of 1 − w0, as shown in figure 1. We then simulated 200,000 mutants, whose new position in the geometrical space of n dimensions is taken from a multivariate normal distribution of mean 0 and variance σ2. We then calculated their fitness by assuming a gaussian relation of fitness with the distance to the optimum: wmut = Exp(−d2), where the optimum is located at the center of the geometrical space (opt = [0, 0, … ,0]) (Martin and Lenormand 2006; Gros et al. 2009). The selection coefficient of a mutation is given by s = wmut − w0. At the optimum, all mutations are deleterious, and their mean effect is E(sd) = −nσ2. Figure 1 shows a quantitative prediction of the mean effect of arising beneficial mutations under FGM. In table 1, we show the mean s of contending beneficial mutations (which are the mutations we are measuring in this study). To calculate the mean effect of compensatory mutations that escape drift and can therefore be detected, we assumed a probability of fixation of 1 − e−2s.
FIG. 1.

Mean selection coefficient of arising compensatory mutations relative to the distance to the optimum obtained by simulation (for details, see Materials and Methods). The mean effect of mutations at the optimum is E(sd) = −0.012 (filled symbols) or E (sd) = −0.03 (open symbols), as suggested for Escherichia coli (Kibota and Lynch 1996; Trindade et al. 2010, respectively). The mean effect of arising beneficial mutations is shown, assuming different values of the number of phenotypic traits, n, in FGM. Triangles n = 15 and squares n = 25.
Table 1.
Mean Effect of Compensatory Mutations E(s) under FGM Considering Different Levels of Phenotypic Complexity (n) and Distance to the Optimum (cost of resistance).
|
E(sd)a = −0.0125 |
E(sd)a = −0.03 |
||||
| Cost of Resistance |
Cost of Resistance |
||||
| 0.18b | 0.27b | 0.18b | 0.27b | ||
| nc |
E(s) |
nc |
E(s) |
||
| 4 | 0.053 | 0.069 | 4 | 0.074 | 0.100 |
| 5 | 0.047 | 0.062 | 6 | 0.060 | 0.081 |
| 6 | 0.043 | 0.056 | 14 | 0.038 | 0.051 |
| 7 | 0.039 | 0.053 | 15 | 0.037 | 0.049 |
| 10 | 0.032 | 0.043 | 20 | 0.030 | 0.041 |
| 13 | 0.029 | 0.037 | 22 | 0.027 | 0.038 |
| 14 | 0.027d | 0.036d | 25 | 0.026d | 0.036d |
| 15 | 0.025 | 0.034 | 26 | 0.026 | 0.036 |
At the optimum, all mutations are deleterious and are assumed to cause an average fitness decline (E[sd]) of 1.2% or of 3%, as estimated in two different mutation accumulation experiments in Escherichia coli (Kibota and Lynch 1996; Trindade et al. 2010).
Two different distances from the optimum are assumed compatible with the costs of resistance of each mutation studied (0.18 and 0.27).
Levels of phenotypic complexity.
Mean effects of beneficial mutations compatible to those observed in our study.
Estimation of the Distribution of Contending Compensatory Mutations
The fit of alternative probability density functions to the observed distribution of selective coefficients was quantified by maximum likelihood. We then used the Akaike's information criterion (AIC) to compare the log likelihood of non-nested models. As commonly done (Barrett et al. 2006; Kassen and Bataillon 2006; McDonald et al. 2011), several continuous distributions were chosen as models for the effects of beneficial mutations. We note that because of the discrete nature of mutation, the choice of a continuous distribution is an approximation. This approximation should not be very drastic in this system since many different mutations that compensate for the costs of antibiotic resistance are known to occur (Maisnier-Patin et al. 2002). Because of the limits of detection of beneficial mutations in our experimental system, we also considered truncated distributions. The truncation generally improved the fit to the data. Although the error associated with the estimation of s is small because we only consider mutations for which a significant change in frequency is observed (see above), considering error in the values of s does not lead to different values of the parameters estimated by maximum likelihood (see supplementary material, Supplementary Material online).
Test of Domain of Attraction of the Distributions
Because we preadapted our bacterial clone before introducing the resistance mutation, our expectation for the maximum effect of a compensatory mutation corresponds to the cost of the resistance introduced (indeed, we did not detect any mutation with a magnitude bigger than the cost). This means that a priori we expect that a bounded distribution will provide a good fit to the data. To test for this, we applied the likelihood framework developed by Beisel et al. (2007), where the properties of the tails of the distributions are tested. Following this procedure, we found no support for a Gumbel domain of attraction for neither K43N nor K88E populations. However, like suggested in Beisel et al. (2007), we may fail to detect small selection coefficients, so we shifted the distribution of selection coefficients relative to the smallest s detected. Following this procedure, we found no support for a Gumbel domain of attraction in the case of the K88E but did not reject the Gumbel domain for the K43N populations. Considering error in the estimates of s, in this analysis, resulted in a rejection of the Gumbel domain for the K88E but not for K43N populations.
Estimation of Mutation Rates
The rate of mutation to new compensatory alleles can be estimated from the mean number of compensatory mutations segregating during a given time of evolution, Tobs. For a beneficial mutation with selection coefficient s to be observed, it has to survive stochastic loss and not be outcompeted by any other beneficial mutations that can arise with an effect bigger than s, during the time Tobs. Following Gerrish and Lenski (1998) and assuming that the distribution of fitness effects of arising beneficial mutations follows a beta distribution with parameters α and β, leading to a beta distribution with parameters α + 1 (p1) and β (p2) for contending beneficial mutations, as supported by our data (cf. Results and table 2), the expected number of beneficial mutations, Nmut, that are able to reach a detectable frequency during a time Tobs is given by:
| (2) |
where  and γ is the Euler constant (Gerrish and Lenski 1998; Gerrish 2001).
Table 2.
Maximum Likelihood Estimates of the Parameters for the Different Distributions.
|
K43N |
K88E |
|||||||
| Distribution | p1a | p2a | Log Likelihoodb | AICc | p1a | p2a | Log Likelihoodb | AICc |
| Betad | 2.8 ± 0.4 | 106 ± 15.8 | 238.0 | −472 | 4.5 ± 0.6 | 120 ± 17 | 277.6 | −551 |
| Beta Te | 1.8 ± 0.5 | 78 ± 18 | 243.2 | −482 | 4.3 ± 0.6 | 117 ± 18 | 277.9 | −552 |
| Lognormd | −3.86 ± 0.07 | 0.59 ± 0.05 | 238.4 | −473 | −3.44 ± 0.05 | 0.49 ± 0.03 | 275.4 | −547 |
| Lognorm Te | −3.89 ± 0.08 | 0.65 ± 0.06 | 244.8 | −486 | −3.44 ± 0.05 | 0.49 ± 0.03 | 275.5 | −547 |
| Gammad | 2.9 ± 0.4 | 112 ± 16.83 | 238.4 | −473 | 4.6 ± 0.6 | 129 ± 18 | 277.6 | −551 |
| Gamma Te | 1.9 ± 0.6 | 83 ± 18.38 | 243.3 | −483 | 4.5 0.5687 | 125.6 + 16.6 | 277.9 | −552 |
| Weibulld | 1.6 ± 0.13 | 0.03 ± 0.002 | 233.7 | −463 | 2.2 ± 0.2 | 0.04 ± 0.002 | 274.6 | −545 |
| Weibull Te | 1.27 ± 0.216 | 0.02 ± 0.004 | 242.7 | −481 | 2.14 ± 0.14 | 0.04 ± 0.002 | 276.2 | −548 |
| 2sHalfnormd | 41 ± 2 | 226.3 | −451 | 45 ± 2 | 273.5 | −545 | ||
| 2sHalfnorm Te | 44.86 ± 2.02 | 240.9 | −480 | 45.17 ± 2.07 | 275.8 | −548 | ||
| Exponentiald | 39 ± 4 | 219.3 | −437 | 28 ± 3 | 234.9 | −468 | ||
| Exponential Te | 52 ± 6 | 241.4 | −481 | 33 ± 6 | 253.4 | −503 | ||
| Normald | 0.03 ± 0.002 | 0.02 ± 0.001 | 216.9 | −430 | 0.036 ± 0.002 | 0.017 ± 0.001 | 268.9 | −534 |
| Normal Te | −0.07 ± 0.2 | 0.05 ± 0.04 | 242.1 | −480 | 0.002 ± 0.03 | 0.04 ± 0.01 | 264.5 | −525 |
Maximum likelihood estimates of the parameters of the different distributions corresponding to the effects of beneficial mutations in the populations carrying the K43N resistance mutation and carrying the K88E resistance mutation.
Maximum log likelihood estimate of each distribution to the respective data set (mutations in the populations carrying the K43N or the K88E resistance mutation).
Akaike's information criterion (AIC = 2k − 2logL, where k is the number of parameters) allows the comparison of the goodness of fit between the different models assumed. The CIs next to each parameter represent the SE.
The relevant parameters (p1 and p2) of each distribution are as follows: Half normal:  ; Lognormal:
  ; Weibull:
 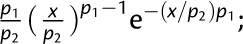 ; Beta:
  ; Exponential: ; Gamma:
  ; and Normal:
Distribution truncated for s < 0.006.
We then found the value of the mutation rate for which Nmut matches the mean number of detected beneficial mutations for each resistance (2.7, 95% confidence interval (CI) [2.4–3.1] for the K43N resistance and 3.4, 95% CI [3.0–3.7] for the K88E resistance). Figure 6 shows the results of this analysis taking in consideration the uncertainty in the estimate of the β parameter for the beta distribution.
FIG. 6.

Estimation of the mutation rate to compensatory mutations. (a) Refers to K43N resistance background and (b) to K88E resistance background. The figure shows the range of Ua compatible with the mean number of observed mutations and the variation of the scale parameter of the beta distribution obtained by maximum likelihood estimates (see table 2). The gray shading is proportional to the number of mutations calculated using Equation (2) in the Materials and Methods (the darker the shading the lower the number of mutations), ranging from 2.4 to 3.1 for the K43N mutation (which corresponds mean ± SE in fig. 5) and from 3.2 to 3.5 for K88E mutation (which corresponds mean ± SE in fig. 5). See Materials and Methods and Gerrish and Lenski (1998) and Gerrish (2001) for the details of the estimation procedure.
Results
Adaptation to a Fitness Peak and Displacement of Fitness Optimum
We first adapted a population to a constant laboratory environment and followed its fitness increase for more than 2,000 generations. We observed a modest fitness increase of about 3% and after 1,400 generations, no significant fitness increments were detected (fig. 2). This fact ensured us that by generation 1,400, the bacterial population had either reached a fitness peak or it was so close to the peak that no further changes on mean population fitness could be detected. Any newly arising mutation on a clone from this highly adapted population will then likely lead to a fitness decline. Subsequently, we produced a clonal population that was displaced from the optimum by introducing one of two antibiotic resistance mutations. These mutations pose different fitness costs, hence displacing the adapted population to different positions in the fitness landscape. Any novel adaptive mutation that would occur after this displacement would thus most likely compensate for the effect of the deleterious mutation introduced. Specifically, the resistance mutations that we introduced into the adapted clone, K43N and K88E, pose a fitness reduction of 18% and of 27%. Given these fitness costs and assuming that they reflect a fitness distance to the optimum, FGM makes the qualitative prediction that compensatory mutations to the K43N resistance mutation should be of smaller effect than those compensating for the K88E mutation. Moreover, it specifically predicts the values of the mean effects of such mutations (fig. 1) that we test below.
The Distribution of Compensatory Mutations in Populations at Different Distances from the Optimum
To estimate the distribution of compensatory mutations, we followed the dynamics of replicate populations in the initial stage of the adaptive walk (e.g., see fig. 3). Note that these mutations are those that were able to escape initial stochastic loss and can therefore be detected at sufficiently high frequencies such that drift will no longer influence their fate, that is, we estimate the distribution of contending compensatory mutations. We did this for two sets of 30 populations, each carrying either the K43N or the K88E mutation. All populations carried a plasmid bearing different microsatellite neutral markers, from which we could detect the occurrence of adaptive events, through significant increases in the marker frequency (see Materials and Methods; Imhof and Schlotterer 2001; Perfeito et al. 2007). Surprisingly, within only a short period of 69 generations (3 days of passages), compensatory mutations were detected in all evolving populations. This shows that compensation to the cost of each of these resistances occurs at very high rate. Furthermore, when testing for the reversion of the antibiotic resistance, we found that the reversion E88K was present in three populations at generation 69, but the reversion N43K was not detected in any of the 30 populations.
FIG. 3.

Dynamics of adaptation for compensation to the costs of antibiotic resistance. The changes in frequency across generations of the different microsatellite markers (number of GA repeats from 20 to 35). (a) Example of a population carrying resistance allele K43N where a strongly beneficial mutation is inferred; (b) Example of a population carrying resistance allele K43N where two beneficial mutations occurring in different genetic backgrounds are detected; (c) Example of a population carrying resistance allele K88E where the occurrence of at least two beneficial mutations in the same clone can be inferred (note that the two distinct frequency increases can be seen in the first 23 generations and then between generation 46 and 69).
We observed three different types of dynamics (fig. 3) in the adapting populations during the short period studied, each compatible with a different scenario: 1) one adaptive mutation dominating the population—periodic selection regime, 2) coexistence of beneficial mutations in different backgrounds—classical clonal interference regime, and 3) multiple mutations in the same background—clonal interference in the multiple mutations regime (for a review of this theoretically predicted regimes, see Sniegowski and Gerrish 2010). The situations described in 1) and 3) were the least frequent. From these dynamics and the significant changes in allele frequencies of the microsatellite markers, we estimated the selective coefficients corresponding to each detectable adaptive event. The distributions of effects of compensatory mutations, based on the adaptation of 30 populations for each of the resistance mutations, are represented in figure 4. The distributions for K43N and K88E resistances were significantly different (Kolmogorov–Smirnov: P < 0.001), and, as expected, the mean effect was higher for the more costly resistance mutation (E[s] = 0.036, for the K88E resistance mutation) than for the less costly mutation (E[s] = 0.025, for the K43N resistance mutation).
FIG. 4.

The distribution of compensatory contending mutations, f(s). (a) Close to the optimum, starting genotype carrying resistance allele K43N; (b) far from the optimum, starting genotype carrying resistance allele K88E. The distributions are significantly different Kolmogorov–Smirnov test P < 0.001.
Next, we compared the observed mean effects of compensatory mutations with those predicted by FGM. As explained previously, we assumed that resistance mutations displace the population from the optimum by an amount given by the resistance cost. Furthermore, we assumed that, at the optimum, where the sensitive bacteria (before the resistance was introduced) are placed, the mean effect of deleterious mutations is about −1.2% (Kibota and Lynch 1996) or −3% (Trindade et al. 2010) as estimated from mutation accumulation studies. Given these assumptions, we can test if the mean effects of compensatory mutations observed are in agreement with the predictions of FGM. Since the compensatory mutations that we can observe are those that escape drift, we consider only contending mutations (see Materials and Methods). In table 1, we show the predicted values of the mean effect of beneficial mutations that escape initial stochastic loss, and are therefore detectable, under FGM for different values of phenotypic complexity n. The mean effect of compensatory mutations measured for each of the resistance backgrounds is consistent with that predicted by FGM for a level of complexity of around 15, if the mean effect of deleterious mutations at the optimum is E(sd) = −0.0125, or around 25 if E(sd) = −0.03. We note, however, that this is not a statistical test of FGM predictions.
We fitted the data of the estimated selection coefficients of compensatory mutations of each resistance mutation using maximum likelihood and assuming different types of distributions. Although we can be guided by theoretical results when considering certain distributions, the particular study system can always present deviations from the models assumptions (Miller et al. 2011). We therefore considered several types of distributions for the selection coefficients of compensatory mutations, beyond those expected a priori. In table 2, we show the maximum likelihood estimates of the parameters as well as the AIC. Theory (Martin and Lenormand 2008) predicts that the distribution of contending mutations, corrected by the distance to the fitness peak, when a population is close to the optimum, should be beta with shape 2. We therefore also include this distribution in our maximum likelihood analysis and tested if the data support this prediction. We should note, however, that the cost of the resistances, especially that of K88E, is substantial and so the assumption of proximity to the optimum may be critical in our system. On the other hand, under FGM, when populations are very far from the optimum, the distribution of mutation effects (both deleterious and beneficial) is expected to be normal. For this reason, we also include a half normal distribution because we only measure beneficial mutations in our analysis.
In our experimental setup, as in many other experiments, there is a limit to the ability of detecting small effect mutations. The minimum value of s estimated was 0.006, so we can expect that mutations with selection coefficients below 0.006 will not be detected in our system. Consistent with this expectation, when we perform simulations of the spread of beneficial mutations under selection and drift in asexual populations undergoing periodic bottlenecks, as in our experiments, we can observe that mutations with s < 0.006 are very unlikely to increase sufficiently in frequency, over a short time, to be detectable given the experimental error in our setup (see Materials and Methods). To accommodate for that bias, we performed a maximum likelihood analysis assuming a truncated distribution as a model for the distribution of detectable mutations. Table 2 shows that the distributions truncated for very low-effect mutations (s < 0.006) provide higher likelihoods for the data of both resistances. Truncation of the beta distribution increased significantly the fit of the distribution to the data for the K43N mutation (Kolmogorov–Smirnov test: P = 0.3) and also for K88E (Kolmogorov–Smirnov test: P = 0.74), although not as much in this later case probably because the distribution of compensatory mutations for this resistance was already much less skewed than the distribution relative to K43N (see histograms on fig. 4). On the basis of the distributions tested, we observe that the truncated lognormal is the distribution with the lowest AIC for the resistance mutation K43N. The truncated distribution beta and gamma also have very high log likelihoods for this data set, and all of these distributions are supported by the data based on Kolmogorov–Smirnov test. For the resistance mutation K88E, the truncated beta and gamma produce the minimum AIC and both are supported based on Kolmogorov–Smirnov tests.
In contrast to the lognormal and the gamma distributions, the beta distribution has finite support, which is probably more reasonable biologically. Indeed, if populations are acquiring beneficial mutations toward reaching a single peak, we would expect that the maximum value of s observed would be given by the selection coefficient of the back mutation, which totally compensates the cost of resistance. Consistent with this, the truncated beta distribution describes reasonably well the data for both mutations: Kolmogorov–Smirnov test P = 0.3 for K43N mutation and P = 0.74 for K88E mutation.
We further analyzed the properties of the tails of the best-fit distributions to determine if the data provide evidence for a bounded distribution. It is commonly assumed that beneficial mutations are drawn from the extreme right tail of the fitness distribution, which makes the results of extreme value theory (EVT) useful to make predictions about their effects. EVT describes three types of limiting tail distributions: distributions in the Gumbel domain of attraction, which lead to the widespread assumption that arising beneficial mutations are exponential distributed; in the Fréchet domain, which includes distributions with a heavier tail than exponential; and in the Weibull domain, which contains distributions with lighter tails than exponential and which possesses a finite upper bound. We have applied the likelihood ratio framework developed by Beisel et al. (2007) to analyze the properties of the tails of the distributions of fitness effects of beneficial mutations that we have measured (see Materials and Methods). For the data corresponding to the K88E mutation, table 2 indicates that the beta and the gamma distributions have similar log likelihood values and similar AIC. In the case of K43N, the lognormal shows the highest likelihood. To test if the tail of the distribution of the data belongs to the Gumbel domain (a domain which includes the gamma and lognormal distributions), we performed a likelihood ratio test against a generalized Pareto distribution as implemented in Beisel et al. (2007). In fact, the data of beneficial mutations for each of the resistance backgrounds reject the Gumbel domain (P << 0.001), which provides additional support for the beta. However, Beisel et al. (2007) also present a method for taking into account that small effect mutations may be missed. With this method, our data on compensatory mutations for K43N resistance allele do not reject the Gumbel domain of attraction, though this domain is rejected for the K88E mutation. Therefore, we conclude that the beta distribution provides a better description of the data for the K88E resistance, but we cannot discard the lognormal for the K43N mutation. In sum, our data are compatible with this distribution and indicate that its shape increases with increasing cost of resistance.
Martin and Lenormand (2008) made the prediction than under FGM, when populations are not too far from the peak, the distribution of s/s0 ∼ Beta (2, m/2), where s0 is the fitness distance to the peak, m is the dimensionality of the phenotype-fitness landscape (the number of traits under selection), and s is the selection coefficient of beneficial mutations that escape drift (contending mutations). We determined the maximum likelihood estimate of m/2 for each of the data sets K43N and K88E, assuming s0 = 0.18 and s0 = 0.27, respectively, and truncating the distributions for s < 0.006. We found and . We then found that the data corresponding to the K43N resistance did not reject the prediction of a beta distribution with shape parameter 2 (Kolmogorov–Smirnov test: P = 0.2; Log likelihood = 243.2 and AIC = −484). Therefore, the estimated distribution of contending compensatory mutations for the K43N resistance supports the predictions of Martin and Lenormand (2008). On the other hand, the data corresponding to the K88E resistance rejected the hypothesis of a beta with shape = 2 (Kolmogorov–Smirnov test: P < 0.01). This is not surprising since the K88E populations are expected to be much more distant from the peak, where the theoretical approximation is less likely to hold.
The Rate of Newly Arising Compensatory Mutations
The rate of newly arising compensatory mutations can be estimated from the number of mutations observed in each population and their effects on fitness. All populations of each resistance mutation acquired at least one compensatory mutation, which caused a detectable increase in frequency of the linked marker over 69 generations. In several populations, more than one beneficial mutation was detected. Figure 5 shows the distribution of the number of contending mutations in each set of populations. The mean number of compensatory mutations segregating in the populations carrying resistance K43N was smaller (2.7) than for the populations carrying resistance K88E (3.4).
FIG. 5.

Distribution of numbers of contending mutations. Frequency of populations, out of 30, where a given number of mutations (1–6) were detected. Dark gray bars stand for the K43N mutation, whereas light gray bars represent the K88E mutation.
Following the theoretical framework developed by Gerrish and Lenski (1998) and Rozen et al. (2002), we can estimate the expected number of beneficial mutations that are able to segregate to detectable frequencies in our system, where mutations are detectable if they reach a frequency of around 10%. We have calculated this mean number of segregating mutations for a given value of the beneficial mutation rate and assuming that fitness effects of arising beneficial mutations are beta distributed. If arising beneficial mutations follow a beta distribution (with shape α), then contending mutations will follow a beta (with shape α + 1). The beta distribution provides a good fit to the data on contending compensatory mutations of each resistance so we assumed a beta distribution for arising mutations. Under this assumption, and for a given U, the expected number of segregating beneficial mutations was then compared with that observed in the populations corresponding to each resistance mutation (mean of the distributions shown in fig. 5). Figure 6 shows the range of U compatible with the observations taking into account the variation of scale parameter of the beta distribution obtained by maximum likelihood (K43N p2 = 78, standard error [SE] = 18; K88E p2 = 117, SE = 15). For the K43N background, we assumed that the distribution of the selective effects of arising mutations is beta with shape parameter 1, which leads to an observed distribution of beneficial mutations with shape parameter 2; and for the K88E, we assumed a beta distribution with shape parameter 3 for arising beneficial mutations, compatible with an observed beta distribution of contending mutations with shape 4 (see table 2). Figure 6a shows that the values of U compatible with the data of the K43N populations are in the interval (5 × 10⁻⁵, 2 × 10⁻⁴), and figure 6b shows that U lies in the interval (4 × 10⁻⁵, 1 × 10⁻⁴) for the K88E populations. These estimates therefore do not support any significant differences in the rate of occurrence of compensatory mutations in the two different genetic backgrounds.
Discussion
Due to their paucity, beneficial mutations are difficult to study empirically. In particular, data on the distribution of fitness effects of compensatory mutations are lacking. To gain an insight into the fitness effects of compensatory mutations, we have used a powerful marker system, where the increase in frequency of different beneficial mutations can be followed through the dynamics of neutral markers (Imhof and Schlotterer 2001; Perfeito et al. 2007). We focused on compensation to the costs of antibiotic resistance, which is a major determinant of persistence of resistance in bacterial populations.
Here, we have studied beneficial mutations, which compensate for the cost of resistance to streptomycin, in two different genetic backgrounds. Maisnier-Patin et al. (2002) previously studied the occurrence of spontaneous compensatory mutations in “Salmonella” cells carrying the resistance mutation K43N, one of the genetic backgrounds we have studied, and showed that several mutations can compensate for the deleterious effect of resistance. Consistent with their results, we found not only that compensatory evolution can proceed through many different routes but also that it is extremely rapid. A mean number of adaptive events per population of 2.7 (fig. 5) for the K43N resistance was observed in a period of only 69 generations. This number was smaller than the one observed for the K88E background (3.4, see fig. 5). This result meets the theoretical expectation of a landscape model with a single fitness peak, in which the less adapted a population is, the more opportunities there are to adapt. Our results are also in agreement with those of Moore et al. (2000), who found higher increases in fitness for mutations incurring bigger costs.
The number of compensatory mutations expected to increase in frequency in asexual populations depends on both the mutation rate and their fitness effects. We have found no significant difference in mutation rates. However, we found that the mean effect of beneficial mutations is larger for the K88E resistance background than for the K43N background. This finding is consistent with FGM as well as with the mutational landscape model. The maximum value of the mutations for the compensation of K43N resistance detected was 0.08, whereas this value was of 0.12 in the K88E background. Given the fitness costs of each resistance, the maximum expected values, corresponding to a reversion N43K and E88K, would be 0.18 and 0.27, respectively. Being able to observe mutations of these magnitudes imply that these were the first to arise in each of the two backgrounds, that is, no other compensatory mutations were present by that time. Moreover, if a revertant emerged in the first generations, then after ∼34 generations, we would expect it to be fixed. Indeed, we detected the presence of revertants in three of the populations of the K88E background at the 69th generation, but these were not fixed in any of the populations, which point to a later appearance of the back mutation. We must emphasize that the corresponding frequency increase seen in the microsatellite linked to the revertant clone was not scored as an adaptive event since it was not the first event detected. In fact, a previous compensatory mutation of smaller effect had already been scored for this marker. By measuring solely beneficial mutations while they are at low frequencies (the first events), we reduce the effect of clonal interference but underestimate the number of adaptive events.
Our results are consistent with the idea that the vast majority of adaptation to the costs of resistance occurs through massive amounts of mutations causing partial compensation (Andersson and Hughes 2010). In the cases reported here, adaptive mutations compensated 13–14% of the fitness cost of the resistant mutation on average and at most 44% of the cost. If we assume that the beneficial mutation with maximal effect was the one that became fixed in the population, then this implies that the first step in the adaptive walk corresponds to approaching 50% of the fitness of sensitive bacteria. Such a large increase in fitness in the first step of the adaptive walk is theoretically expected (Orr 2005b). Interestingly, our results are also consistent with the recent findings of Gifford et al. (2011), who showed that the mean walk length is the same regardless of the starting position, since the first mutations fixed tend to be larger in lines that start farther from the optimum.
In a study that followed compensatory adaptation to the K43N resistance in Salmonella with decreased mismatch repair, Maisnier-Patin et al. (2002) found large effects for compensatory mutations (s values above 0.10). Their system of detection of compensatory mutations (appearance of larger colonies) is likely to detect only mutations of strong effect (or several mutations of small effect). That is probably why only in 2 of 10 populations was adaptation detectable in 500 generations. In addition, this longer period of evolution may have led to the isolation of clones with more than one compensatory mutation. It is therefore difficult to compare the fitness effects estimated with those estimated here. Besides all the differences in the methods between these studies, we should also point out that differences between species in the distribution of compensatory mutations are to be expected. This is so because of the epistatic nature of mutations involved in antibiotic resistance (Trindade et al. 2009; Ward et al. 2009). It remains to be elucidated whether it is the specific mutation conferring resistance to a given antibiotic or its fitness cost in a strain or species that contribute the most for the distribution of compensatory mutations. Interestingly, a recent study of adaptation of populations of E. coli resistant to rifampicin found that the increase in mean population fitness during the first stages of adaptation depends on the cost of resistance (Barrick et al. 2010). Although a distribution of compensatory mutations was not determined, the study suggests that the difference in fitness increase is not attributable to differences in mutation rate toward adaptive alleles. We note, though, that the mutation rate inferred in this study is not the per genome per generation mutation rate, but an effective mutation rate toward beneficial mutations with a constant selective effect (Hegreness et al. 2006), which gives rise to similar dynamics of the two neutral markers that were used to detect adaptive events. In our study, the power to detect such events is substantially increased due to the use of many more neutral markers, which permits the estimation of the mutation rate to new compensatory alleles. Despite the difference in the methods between studies, no significant differences in mutation rate between populations resistant to streptomycin were found here, and no significant differences in the effective mutation rate were found in the populations resistant to rifampicin (Barrick et al. 2010).
We have found support for a beta distribution describing the effects of compensatory mutations to the costs of antibiotic resistance, although a gamma and a lognormal were also supported. The beta distribution is expected under a model of adaptation toward a single fitness optimum, such as FGM. The predictions made by this model hold reasonably well for the distribution of fitness effects of deleterious mutations caused by transposable elements and the distribution of epistasis in E. coli (Martin et al. 2007). Here, we find a good agreement between FGM predictions and our data, although the data can also be consistent with other models of adaptation. In particular, under FGM, the mean effect of deleterious mutations at the optimum is E(sd) = −nσ2, and as the population moves away from the optimum, the mean effect of deleterious and beneficial mutations will increase in a predictable manner. If we take into account that the average fitness effect of a deleterious mutation that has been estimated in E. coli is about −1.2% (Kibota and Lynch 1996) and we take our estimate of the mean effect of beneficial mutations that compensate for the K43N resistance mutation (2.5%), then FGM predicts that the mean effect of compensatory mutations for K88E should be around 3.4% (see supplementary material, Supplementary Material online), a remarkably close value to the one observed (3.6%). Our results therefore indicate that FGM can be an appropriate framework to help making predictions regarding the evolution and epidemiology of antibiotic resistance.
Supplementary Material
Supplementary material is available at Molecular Biology and Evolution online (http://www.mbe.oxfordjournals.org/).
Acknowledgments
We thank G. Martin, L. Perfeito, S. Trindade, and P. Gerrish for helpful discussions and L. Fernandes for help in developing the microsatellite quantification system. This research was supported by Fundação para a Ciência e Tecnologia: Fellowship SFRH/BPD/29601/2006 to A.S., fellowship SFRH/BI/15997/2006 to S.M., and the project grant PTDC/BIA-EVF/114622/2009 to I.G.
References
- Andersson DI, Hughes D. Antibiotic resistance and its cost: is it possible to reverse resistance? Nat Rev Microbiol. 2010;8:260–271. doi: 10.1038/nrmicro2319. [DOI] [PubMed] [Google Scholar]
- Barrett RD, MacLean RC, Bell G. Mutations of intermediate effect are responsible for adaptation in evolving Pseudomonas fluorescens populations. Biol Lett. 2006;2:236–238. doi: 10.1098/rsbl.2006.0439. [DOI] [PMC free article] [PubMed] [Google Scholar]
- Barrick JE, Kauth MR, Strelioff CC, Lenski RE. Escherichia coli rpoB mutants have increased evolvability in proportion to their fitness defects. Mol Biol Evol. 2010;27:1338–1347. doi: 10.1093/molbev/msq024. [DOI] [PMC free article] [PubMed] [Google Scholar]
- Beisel CJ, Rokyta DR, Wichman HA, Joyce P. Testing the extreme value domain of attraction for distributions of beneficial fitness effects. Genetics. 2007;176:2441–2449. doi: 10.1534/genetics.106.068585. [DOI] [PMC free article] [PubMed] [Google Scholar]
- Betancourt A. Mutation rates: when the going gets tough, beneficial mutations get going. Heredity. 2007;99:359–360. doi: 10.1038/sj.hdy.6801042. [DOI] [PubMed] [Google Scholar]
- Brzostek A, Sajduda A, Sliwinski T, Augustynowicz-Kopec E, Jaworski A, Zwolska Z, Dziadek J. Molecular characterisation of streptomycin-resistant Mycobacterium tuberculosis strains isolated in Poland. Int J Tuberc Lung Dis. 2004;8:1032–1035. [PubMed] [Google Scholar]
- Burch CL, Chao L. Evolution by small steps and rugged landscapes in the RNA virus phi6. Genetics. 1999;151:921–927. doi: 10.1093/genetics/151.3.921. [DOI] [PMC free article] [PubMed] [Google Scholar]
- Crow JF, Kimura M. An introduction to population genetic theory. New York: Harper and Row; 1970. [Google Scholar]
- Elena SF, Lenski RE. Evolution experiments with microorganisms: the dynamics and genetic bases of adaptation. Nat Rev Genet. 2003;4:457–469. doi: 10.1038/nrg1088. [DOI] [PubMed] [Google Scholar]
- Fisher RA. The genetical theory of natural selection. Oxford: Clarendon Press; 1930. [Google Scholar]
- Gerrish P. The rhythm of microbial adaptation. Nature. 2001;413:299–302. doi: 10.1038/35095046. [DOI] [PubMed] [Google Scholar]
- Gerrish PJ, Lenski RE. The fate of competing beneficial mutations in an asexual population. Genetica. 1998;102–103:127–144. [PubMed] [Google Scholar]
- Gifford DR, Schoustra SE, Kassen R. The length of adaptive walks is insensitive to starting fitness in Aspergillus nidulans. Evolution. 2011;65:3070–3078. doi: 10.1111/j.1558-5646.2011.01380.x. [DOI] [PubMed] [Google Scholar]
- Gillespie JH. A simple stochastic gene substitution model. Theor Popul Biol. 1983;23:202–215. doi: 10.1016/0040-5809(83)90014-x. [DOI] [PubMed] [Google Scholar]
- Gros PA, Le Nagard H, Tenaillon O. The evolution of epistasis and its links with genetic robustness, complexity and drift in a phenotypic model of adaptation. Genetics. 2009;182:277–293. doi: 10.1534/genetics.108.099127. [DOI] [PMC free article] [PubMed] [Google Scholar]
- Hall AR, Griffiths VF, MacLean RC, Colegrave N. Mutational neighbourhood and mutation supply rate constrain adaptation in Pseudomonas aeruginosa. Proc Biol Sci. 2010;277:643–650. doi: 10.1098/rspb.2009.1630. [DOI] [PMC free article] [PubMed] [Google Scholar]
- Handel A, Regoes RR, Antia R. The role of compensatory mutations in the emergence of drug resistance. PLoS Comput Biol. 2006;2:e137. doi: 10.1371/journal.pcbi.0020137. [DOI] [PMC free article] [PubMed] [Google Scholar]
- Hegreness M, Shoresh N, Hartl D, Kishony R. An equivalence principle for the incorporation of favorable mutations in asexual populations. Science. 2006;311:1615–1617. doi: 10.1126/science.1122469. [DOI] [PubMed] [Google Scholar]
- Hughes AL. Evidence for abundant slightly deleterious polymorphisms in bacterial populations. Genetics. 2005;169:533–538. doi: 10.1534/genetics.104.036939. [DOI] [PMC free article] [PubMed] [Google Scholar]
- Imhof M, Schlotterer C. Fitness effects of advantageous mutations in evolving Escherichia coli populations. Proc Natl Acad Sci U S A. 2001;98:1113–1117. doi: 10.1073/pnas.98.3.1113. [DOI] [PMC free article] [PubMed] [Google Scholar]
- Joyce P, Rokyta DR, Beisel CJ, Orr HA. A general extreme value theory model for the adaptation of DNA sequences under strong selection and weak mutation. Genetics. 2008;180:1627–1643. doi: 10.1534/genetics.108.088716. [DOI] [PMC free article] [PubMed] [Google Scholar]
- Kassen R, Bataillon T. Distribution of fitness effects among beneficial mutations before selection in experimental populations of bacteria. Nat Genet. 2006;38:484–488. doi: 10.1038/ng1751. [DOI] [PubMed] [Google Scholar]
- Kibota TT, Lynch M. Estimate of the genomic mutation rate deleterious to overall fitness in Escherichia coli. Nature. 1996;381:694–696. doi: 10.1038/381694a0. [DOI] [PubMed] [Google Scholar]
- Kohanski MA, Dwyer DJ, Collins JJ. How antibiotics kill bacteria: from targets to networks. Nat Rev Microbiol. 2010;8:423–435. doi: 10.1038/nrmicro2333. [DOI] [PMC free article] [PubMed] [Google Scholar]
- Lenski RE, Rose MR, Simpson SC, Tadler SC. Long-term experimental evolution in Escherichia coli 1. Adaptation and divergence during 2000 generations. Am Nat. 1991;138:1315–1341. [Google Scholar]
- MacLean RC, Buckling A. The distribution of fitness effects of beneficial mutations in Pseudomonas aeruginosa. PLoS Genet. 2009;5:e1000406. doi: 10.1371/journal.pgen.1000406. [DOI] [PMC free article] [PubMed] [Google Scholar]
- MacLean RC, Hall AR, Perron GG, Buckling A. The population genetics of antibiotic resistance: integrating molecular mechanisms and treatment contexts. Nat Rev Genet. 2010;11:405–414. doi: 10.1038/nrg2778. [DOI] [PubMed] [Google Scholar]
- Maisnier-Patin S, Berg OG, Liljas L, Andersson DI. Compensatory adaptation to the deleterious effect of antibiotic resistance in Salmonella typhimurium. Mol Microbiol. 2002;46:355–366. doi: 10.1046/j.1365-2958.2002.03173.x. [DOI] [PubMed] [Google Scholar]
- Martin G, Elena SF, Lenormand T. Distributions of epistasis in microbes fit predictions from a fitness landscape model. Nat Genet. 2007;39:555–560. doi: 10.1038/ng1998. [DOI] [PubMed] [Google Scholar]
- Martin G, Lenormand T. The fitness effect of mutations across environments: a survey in light of fitness landscape models. Evolution. 2006;60:2413–2427. [PubMed] [Google Scholar]
- Martin G, Lenormand T. The distribution of beneficial and fixed mutation fitness effects close to an optimum. Genetics. 2008;179:907–916. doi: 10.1534/genetics.108.087122. [DOI] [PMC free article] [PubMed] [Google Scholar]
- McDonald MJ, Cooper TF, Beaumont HJ, Rainey PB. The distribution of fitness effects of new beneficial mutations in Pseudomonas fluorescens. Biol Lett. 2011;7:98–100. doi: 10.1098/rsbl.2010.0547. [DOI] [PMC free article] [PubMed] [Google Scholar]
- Miller CR, Joyce P, Wichman HA. Mutational effects and population dynamics during viral adaptation challenge current models. Genetics. 2011;187:185–202. doi: 10.1534/genetics.110.121400. [DOI] [PMC free article] [PubMed] [Google Scholar]
- Moore FB, Rozen DE, Lenski RE. Pervasive compensatory adaptation in Escherichia coli. Proc Biol Sci. 2000;267:515–522. doi: 10.1098/rspb.2000.1030. [DOI] [PMC free article] [PubMed] [Google Scholar]
- Orr HA. The population genetics of adaptation: the distribution of factors fixed during adaptive evolution. Evolution. 1998;52:935–949. doi: 10.1111/j.1558-5646.1998.tb01823.x. [DOI] [PubMed] [Google Scholar]
- Orr HA. The genetic theory of adaptation: a brief history. Nat Rev Genet. 2005a;6:119–127. doi: 10.1038/nrg1523. [DOI] [PubMed] [Google Scholar]
- Orr HA. Theories of adaptation: what they do and don't say. Genetica. 2005b;123:3–13. doi: 10.1007/s10709-004-2702-3. [DOI] [PubMed] [Google Scholar]
- Orr HA. The population genetics of beneficial mutations. Philos Trans R Soc Lond B Biol Sci. 2010;365:1195–1201. doi: 10.1098/rstb.2009.0282. [DOI] [PMC free article] [PubMed] [Google Scholar]
- Perfeito L, Fernandes L, Mota C, Gordo I. Adaptive mutations in bacteria: high rate and small effects. Science. 2007;317:813–815. doi: 10.1126/science.1142284. [DOI] [PubMed] [Google Scholar]
- Poon A, Davis BH, Chao L. The coupon collector and the suppressor mutation: estimating the number of compensatory mutations by maximum likelihood. Genetics. 2005;170:1323–1332. doi: 10.1534/genetics.104.037259. [DOI] [PMC free article] [PubMed] [Google Scholar]
- Rokyta DR, Beisel CJ, Joyce P, Ferris MT, Burch CL, Wichman HA. Beneficial fitness effects are not exponential for two viruses. J Mol Evol. 2008;67:368–376. doi: 10.1007/s00239-008-9153-x. [DOI] [PMC free article] [PubMed] [Google Scholar]
- Rozen DE, de Visser JA, Gerrish PJ. Fitness effects of fixed beneficial mutations in microbial populations. Curr Biol. 2002;12:1040–1045. doi: 10.1016/s0960-9822(02)00896-5. [DOI] [PubMed] [Google Scholar]
- Ruusala T, Andersson D, Ehrenberg M, Kurland CG. Hyper-accurate ribosomes inhibit growth. EMBO J. 1984;3:2575–2580. doi: 10.1002/j.1460-2075.1984.tb02176.x. [DOI] [PMC free article] [PubMed] [Google Scholar]
- Schlotterer C, Imhof M, Wang H, Nolte V, Harr B. Low abundance of Escherichia coli microsatellites is associated with an extremely low mutation rate. J Evol Biol. 2006;19:1671–1676. doi: 10.1111/j.1420-9101.2006.01108.x. [DOI] [PubMed] [Google Scholar]
- Schoustra SE, Bataillon T, Gifford DR, Kassen R. The properties of adaptive walks in evolving populations of fungus. PLoS Biol. 2009;7:e1000250. doi: 10.1371/journal.pbio.1000250. [DOI] [PMC free article] [PubMed] [Google Scholar]
- Schrag SJ, Perrot V, Levin BR. Adaptation to the fitness costs of antibiotic resistance in Escherichia coli. Proc Biol Sci. 1997;264:1287–1291. doi: 10.1098/rspb.1997.0178. [DOI] [PMC free article] [PubMed] [Google Scholar]
- Silhavy T, Berman T, Enquist L. Experiments with gene fusion. Cold Spring Harbor (NY): Cold Spring Harbor Laboratory; 1984. [Google Scholar]
- Sniegowski PD, Gerrish PJ. Beneficial mutations and the dynamics of adaptation in asexual populations. Philos Trans R Soc Lond B Biol Sci. 2010;365:1255–1263. doi: 10.1098/rstb.2009.0290. [DOI] [PMC free article] [PubMed] [Google Scholar]
- Trindade S, Perfeito L, Gordo I. Rate and effects of spontaneous mutations that affect fitness in mutator Escherichia coli. Philos Trans R Soc Lond B Biol Sci. 2010;365:1177–1186. doi: 10.1098/rstb.2009.0287. [DOI] [PMC free article] [PubMed] [Google Scholar]
- Trindade S, Sousa A, Xavier KB, Dionisio F, Ferreira MG, Gordo I. Positive epistasis drives the acquisition of multidrug resistance. PLoS Genet. 2009;5:e1000578. doi: 10.1371/journal.pgen.1000578. [DOI] [PMC free article] [PubMed] [Google Scholar]
- Ward H, Perron GG, MaClean RC. The cost of multiple drug resistance in Pseudomonas aeruginosa. J Evol Biol. 2009;22:997–1003. doi: 10.1111/j.1420-9101.2009.01712.x. [DOI] [PubMed] [Google Scholar]
- Wolfram Research. Mathematica, Version 6.0. Champaign (IL): Wolfram Research, Inc; 2007. [Google Scholar]
Associated Data
This section collects any data citations, data availability statements, or supplementary materials included in this article.