

Abstract
Temperatures were measured in vivo in four pigs (mean animal weight = 110.75 kg and standard deviation = 6.13 kg) due to a continuous wave radiofrequency (RF) power irradiation with a 31.75 cm internal diameter and a 15.24 cm long, 7 T (296 MHz), eight channel, transverse electromagnetic head coil. The temperatures were measured in the subcutaneous layer of the scalp, 5, 10, 15, and 20 mm deep in the brain, and rectum using fluoroptic temperature probes. The RF power was delivered to the pig’s head for ~3 h (mean deposition time = 3.14 h and standard deviation = 0.06 h) at the whole head average specific absorption rate of = 3 W kg−1 (mean average specific absorption rate = 3.08 W kg−1 and standard deviation = 0.09 W kg−1). Next, simple bioheat transfer models were used to simulate the RF power induced temperature changes. Results show that the RF power produced uniform temperature changes in the pigs’ heads (mean temperature change = 1.68°C and standard deviation = 0.13°C) with no plateau achieved during the heating. No thermoregulatory alterations were detected due to the heating because the temperature responses of the pre-RF and post- RF epochs were not statistically significantly different. Simple, validated bioheat models may provide accurate temperature changes.
Keywords: safety, radiofrequency, MRI, 7 T, bioheat
Radiofrequency (RF) heating of an imaged tissue is a safety concern at ultra-high fields (i.e., static magnetic field strength ≥3 tesla [T]) (1). This is so because more RF power is transferred to an imaged tissue with an increase in the static field strength for a given pulse sequence (2). Additionally, higher conductivity of biological tissues and frequency dependent dielectric losses at higher field strengths cause more RF absorption (3–5). RF power at ultra-high fields is deposited nonuniformly because of the high gyromagnetic ratio of water proton and nonuniform distribution of tissue electrical properties (6,7). Nonuniform RF power together with a nonuniform geometry, tissue distribution, and blood flow may cause nonuniform RF heating with the potential of local hot spots.
RF safety guidelines of the International Commission on Non-Ionizing Radiation Protection Committee limit the maximum rise of core body temperature to 0.5 and 1.0°C in normal and controlled operating modes, respectively. The maximum temperature in the head is restricted to 38°C for the two operating modes (i.e., maximum temperature change in the head to 1°C assuming core body temperature of 37°C). The maximum RF power per unit head weight (i.e., the whole head average specific absorption rate, SARavg) is restricted to 3 W kg−1 (averaged over any 6 min), and the maximum local specific absorption rate (SAR) in the head is restricted to 10 W kg−1 (averaged over a 10-g of tissue over any 6 min) for the two operating modes. The SARavg limit over any 10 sec is restricted to three times the SARavg limit of 6 min. No limit exists on the maximum duration of an RF power deposition if the temperature guideline is not exceeded (8,9).
MR systems monitor the total RF power transferred from an RF coil alone to assure safety because of the lack of reliable and validated means to predict and monitor subject specific RF heating and local SAR. In principle, RF power, when deposited for a “long” time, may cause in vivo temperature changes greater than 1°C. Thermogenic cellular and systemic hazards are directly related to temperatures and temperature–time history and not to the SARavg and local SAR. The effects of nonuniform brain temperature change in the range of 1–3°C on local and systemic body functions that are not well understood and may cause altered thermophysiologic effects (6,10). Therefore, along with measuring net RF power delivered from an RF coil, it is prudent to study RF heating and associated thermophysiological changes in live, thermophysiologically conservative animal models to humans to better understand human safety at the highest fields.
For biomedical human and animal research, 7 T MR systems are used routinely worldwide (11–13). However, only limited 7 T RF heating data are available, which is obtained in a rat with a 7 cm inner diameter quadrature birdcage coil (14). This article presents the first RF heating study because of the RF power deposition with a 7 T human head coil in porcine models of body weight comparable to humans.
MATERIALS AND METHODS
The animal experiment protocol was approved by the Institutional Animal Care and Usage Committee of the university.
Animal Model
A pig is a thermophysiologically similar and conservative animal model of a human. A pig has human-comparable thermal mass, surface area, water loss through skin below its critical, hot environmental temperature, metabolic energy per unit surface area, cardiac output, electromagnetic and thermal properties, and thermoregulatory mechanisms—making it thermophysiologically similar to a human (5,10,15–17). The critical hot environmental temperature limit for a pig (36°C for a newborn and 30°C for a mature) is comparable to and lower than that of a human (37°C for a newborn and 43°C for a mature)—making it a thermophysiologically conservative animal as a human. A detailed comparison between the thermoregulatory physiology of a pig and a human is presented in Ref. 6.
7 T RF Volume Head Coil
A 31.75 cm internal diameter and a 15.24 cm long transverse electromagnetic volume head coil with eight microstrip elements was used to deposit RF power to the pigs’ heads. Each of the eight microstrips was 1.27 cm wide. The corresponding ground plate was 5.04 cm wide. The coil was built on a 1.27 cm thick cylindrical teflon block. The eight-channel transverse electromagnetic array was tuned and matched to −24 dB or below with an average −14 dB decoupling between the nearest channels as measured by a network analyzer. The eight channels of the transverse electromagnetic array were driven independently with phases corresponding to their azimuthal angles and with equal RF power for each channel from a 1-to-8 way power divider (Werlatone, Brewster, NY).
Experiment Design
In vivo temperatures were measured as a function of time in four anesthetized swine using fluoroptic probes (Luxtron Corporation, model m3300 and 3000) because of the RF power deposition with a “large” 7 T (Larmor frequency of 296 MHz) head coil. The fluoroptic probes were placed in the subcutaneous layer of the scalp, 5, 10, 15, and 20 mm deep in the brain, and 10 cm deep in the rectum. The temperatures were recorded for approximately 2.5–4 h before the RF power deposition started (pre-RF epoch), for ~3 h during the RF power deposition (RF epoch), and for ~3 h after the RF power deposition stopped (post-RF epoch). Pre-RF epoch temperatures were recorded to characterize the approximate linear drop of in vivo temperatures in the anesthetized animals. A “worst case” scenario of RF heating was simulated by exposing the animals for ~3 h in the RF epoch. Post-RF epoch temperatures were recorded to compare the thermal responses in the post-RF epoch with the thermal responses in the pre-RF epoch. Thermal responses are mediated by the pigs’ thermoregulatory physiology. Thus, a difference in the thermal response in the post-RF epoch from that of the pre-RF epoch will indicate the RF heating induced changes in the animals’ thermoregulatory physiology—a possible safety concern (6).
Continuous wave (CW) RF power was delivered to the pig’s head for ~3 h (3.14 ± 0.06 h) using an eight channel, 31.75 cm internal diameter and 15.24 cm long, transverse electromagnetic volume head coil tuned and matched to 296 MHz (Larmor frequency of water proton at 7 T). The whole head average RF power deposition (SARavg) was maintained close to 3 W kg−1 (3.08 ± 0.09 W kg−1). The SARavg was calculated based on the net (forward–reverse) RF power, cable loss, coil efficiency, and the mass of the pig’s head. The net RF power delivered was measured at the head coil before the eight channel power divider using a power meter (Giga-tronics Incorporated, Universal Power Meter, model 8650A). The cable loss in each of the eight 1.83 m long cable connecting power divider to the RF coil was ~0.33 db per meter as per manufacturing specifications. The efficiency of the RF coil in delivering the RF power to the pig’s head was estimated by measuring quality factor Q of the unloaded and head-loaded coil in two pigs (33.5 and 36.6%). The efficiency was assumed to be comparable (~33.5%) in all pigs, because head dimensions were comparable. The mass of the animal’s head was used to calculate the SARavg, as it provided a conservative estimate for the SAR. The head mass in all animals was measured after the experiment by severing the head at vertebra C1 level. The mass of the animal’s ears was not included in the SARavg calculation, because the ears stayed outside the RF coil.
The number of animals was chosen as N = 4, because according to the statistical power analysis, a minimum number of N = 3.16 animals was required to have >90% power with P < 0.05 (two-sided). The room temperature and humidity, the animal’s heart rate, end tidal CO2, and the percentage inspired/expired anesthetic agent isoflurane were monitored continuously to keep the animals stable and recorded manually every 30 min.
Each animal was rested for at least 6 days after its arrival to the animal facility of the Center for Magnetic Resonance Research to avoid anxiety and was fasted for 12 h before the induction of anesthesia to avoid complications (18). Water was provided ad libitum during the fasting. For the experiment, first the animal was immobilized and sedated using 5–10 mg kg−1 Telazol (Tiletamine HCl + Zolzepam HCl). This was followed by tracheotomy. The animal was kept anesthetized during the experiment (~9 h) using 2–3% isoflurane in 50–50% air–O2. Respiratory rate was set to 12–13 cycles min−1 using a ventilator (Ohmeda 7000). Minute volume was set between 7 and 8 L min−1. Saline (0.9% NaCl) was provided through an ear vein at the rate of ~0.4–0.6 L h−1 to keep the animal hydrated during the experiment. Afterward, an approximately 14-gauge hole was drilled into the skull perpendicular to the RF coil plane closest to the skull. The hole was located ~45 mm from the back of the skull and ~5 mm lateral to the midline between the ears. The dura was punctured using an 18 gauge catheter. Four fluoroptic probes were slipped through the hole such that they were placed at the predetermined depths away from the dura in the brain (Fig. 1). A piece of cotton gauge was put in the hole to keep the fluoroptic probes stationary and stop cerebrospinal fluid from leaking. One fluoroptic probe was placed in the subcutaneous layer of the scalp using an 18-gauge catheter. Another fluoroptic probe was placed 10 cm deep in the rectum. At the end of the experiment, the animal was euthanized using a saturated KCl solution and the head was severed and weighed.
FIG. 1.
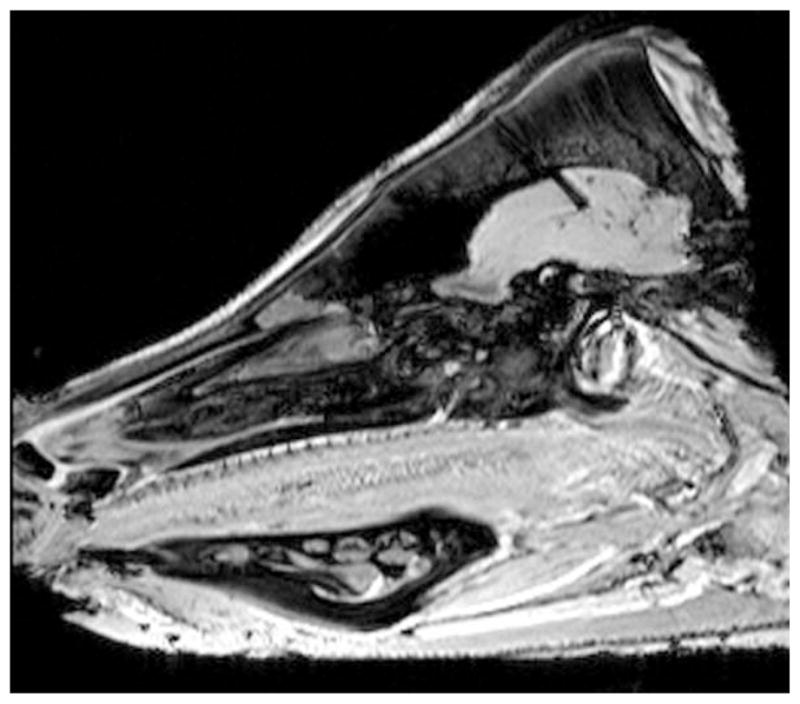
A typical location of the fluoroptic probes in the porcine head. The probes were placed at the scalp and 5, 10, 15, and 20 mm in the porcine brain after the dura.
Statistical Analyses
RF power induced temperature changes were compared against one another and among pigs using univariate analysis of variance tests followed by Tukey’s method for multiple comparisons with an overall family error rate of 5%. In addition, the difference in the slope of a pre-RF and post-RF temperatures for a given location was compared with zero for all locations and pigs using a standard one-way analysis of variance. The slopes were compared to detect any RF heating induced thermoregulatory alterations with the thermal response in the post-RF epoch as compared to the thermal response of the pre-RF epoch (6).
The RF power induced temperature changes were obtained by subtracting the anesthesia induced linear temperature decay in the pre-RF epoch extrapolated to the RF epoch from the absolute temperature measurements in the RF epoch. Extrapolating the linear temperature decay of the pre-RF epoch to the RF epoch was valid, as isoflurane anesthesia caused linear temperature decay for ~9 h in our previous control studies (6,7). Necessary pre-RF temperature slopes were obtained from the 1–2 h of linear temperature decay data before the RF power deposition started (RF epoch). Post-RF slopes were obtained from the 2 h of linear temperature decay data 45 min after the RF power deposition stopped. The post-RF slopes were obtained 45 min after the RF epoch, because it took ~45 min for the temperatures to settle down from the initial fast cooling period right after the heating.
The RF power induced temperature changes were fit to the following parametric model before applying the univariate analysis and the Tukey’s method for multiple comparisons.
| [1] |
where, dTT was an RF power induced tissue temperature change, Pi(i = 1, 2, 3) were estimated parameters, and t was the RF power deposition time (h) varying from 0 to ~3 h. The fits were obtained using maximum likelihood yielding estimates with negligible variability in SAS PROC NLMIXED. The parametric curves were chosen as above, because the form was the general solution for an RF power induced temperature change according to the Shrivastava’s Generic Bioheat Transfer Model (GBHTM) (19) and the Pennes’ Bioheat Transfer Equation (BHTE) (20) for constant thermal diffusion, blood perfusion, and blood-tissue heat transfer coefficient.
Bioheat Thermal Modeling
The RF power induced temperature changes in the head and rectum were numerically simulated using the Shrivastava’s GBHTM (19) and the Pennes’ BHTE (20). The GBHTM was simulated, as it was the newly derived bioheat transfer model using first principles to appropriately predict in vivo temperatures because of a heat source in a perfused tissue. For simplicity, the GBHTM was implemented by neglecting the spatial variation of the blood temperature, dTBl (i.e., sink approach; Eq. 2).
| [2] |
where,
| [3] |
The empirical Pennes’ BHTE was simulated for comparison because the equation is the current “gold standard” for simulating in vivo temperatures (Eq. 4).
| [4] |
The pigs were modeled as a two-cylinder system (one cylinder for the head and another for the trunk) with uniform thermal properties and RF power deposition for simplicity. The dimensions of the cylinders (radius and length) were calculated such that the weight and the surface area of the cylinders matched the weight and the surface area of the head and trunk of the average pig. The following geometrical and thermal parameters were used: radius of the head cylinder = 8.5 cm, length of the head cylinder = 31 cm, radius of the trunk cylinder = 18 cm, length of the trunk cylinder = 101 cm, density, ρ = 1000 kg m−3, thermal conductivity, k = 0.5 W kg−1 K−1, specific heat, CP = 3600 J kg−1 K−1, blood-tissue heat transfer rate, UA = 9000 W m−3 K−1, blood volume fraction in the body, ε = 8%, Pennes’ perfusion parameter, W = UA/(1 − ε) = 9782.6 W m−3 K−1, convective heat transfer coefficient = 2 W m−2 K−1, RF power to the head, QRF = (74.3 W) (head volume)−1 (net RF power deposition efficiency) W m−3, and net RF power deposition efficiency = 40% (16,17,21,22). Net RF power deposition efficiency (including the coil efficiency, cable efficiency, and power divider efficiency) was adjusted to 40% to match the measured and simulated temperature changes. Adjusting the net RF power deposition efficiency was necessary because quality-factor-based coil efficiency value is only an approximate value.
The effect of the forced cooling on the RF power induced temperature changes was estimated by increasing the value of the convective heat transfer coefficient to 25 W m−2 K−1 simulating the air flow of ~1 m sec−1 in a scanner (21). RF power induced temperature changes because of a CW were compared with the RF power induced temperature changes because of worst case 30-sec pulsed wave (SARavg = 9 W kg−1 for 10 sec followed by SARavg = 0 W kg−1 for 20 sec) for the total simulated MR scanning time of 45 min and the 6 min SARavg of 3 W kg−1. As mentioned before, 3 W kg−1 is the maximum allowable SARavg averaged over any 6 min and 9 W kg−1 is the maximum allowable SARavg averaged over any 10 sec for head imaging by the International Commission on Non-Ionizing Radiation Protection Committee (8,9).
RESULTS
Figure 2 presents a typical temporal temperature response in an RF heated pig. Temperatures dropped linearly in the pre-RF epoch (6,7) because of anesthesia. Temperatures increased over the dropping pre-RF temperatures in the RF epoch because of the RF power deposition from the head coil. Temperatures dropped in the post-RF epoch after the RF power was stopped. Temperature in the RF epoch was the superposition of the anesthesia induced linearly decreasing temperature and the RF power induced increasing temperature. Thus, the RF induced temperature change at a location in the RF epoch was obtained by subtracting from the measured absolute temperature, the linearly decreasing pre-RF temperature extrapolated to the RF epoch (7).
FIG. 2.
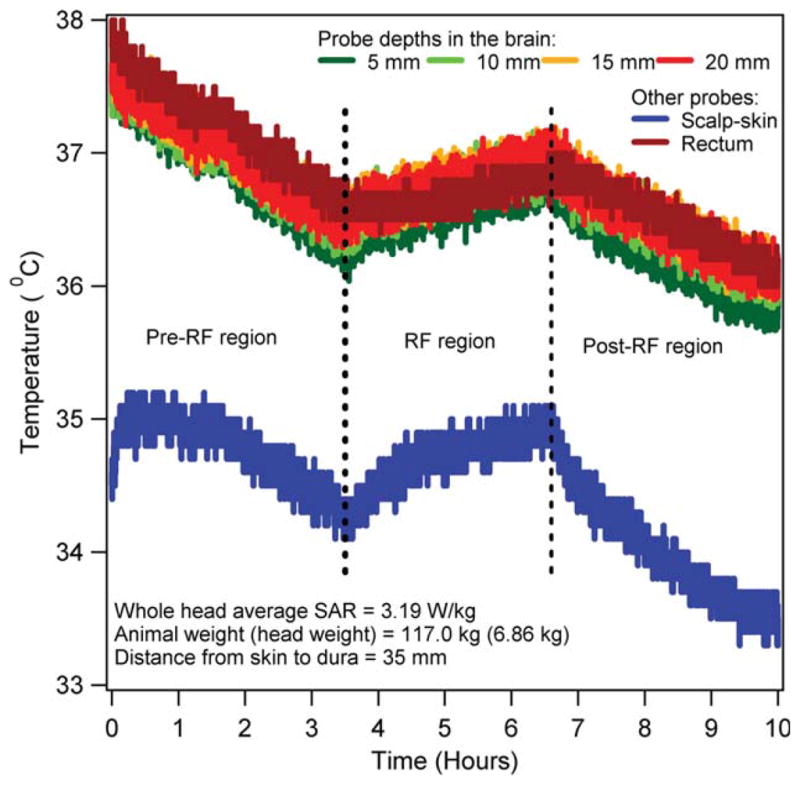
Absolute temperatures in the scalp, brain, and rectum of an anesthetized, heated animal. [Color figure can be viewed in the online issue, which is available at wileyonlinelibrary.com.]
Figures 3–6 present the RF power induced temperature changes vs. time in the subcutaneous layer of the scalp, 5 and 15 mm deep in the brain, and 10 cm deep in the rectum, respectively. The mean parametric curve, 95% confidence interval curves, simulated GBHTM curve, and simulated Pennes’ BHTE curve are also presented. The RF power induced temperature change was found to be unique for a given location among pigs. The RF power induced temperature change did not achieve plateau during 3 h of the RF power deposition for any location. The simple GBHTM accurately simulated the measured temperature changes and the mean parametric curve. The Pennes’ BHTE accurately predicted the measured scalp and brain temperature changes for approximately first 10 min. The BHTE could not simulate time varying rectal temperature change.
FIG. 3.

RF power induced temperature changes in the scalp of swine. [Color figure can be viewed in the online issue, which is available at wileyonlinelibrary.com.]
FIG. 6.

RF power induced temperature changes 10 cm deep in the rectum of swine. [Color figure can be viewed in the online issue, which is available at wileyonlinelibrary.com.]
Table 1 presents the estimated parameters (i.e., P1, P2, and P3) of the parametric model for the RF power induced temperature changes among all locations and pigs. There was no statistically significant difference among the RF power induced temperature changes in the head (skin and four brain locations). The RF power induced rectal temperature change was statistically significantly different from the temperature changes of the five locations in the head. Comparing the estimated parameters using univariate analysis of variance tests followed by Tukey’s method for multiple comparisons with an overall family error rate of 5% showed that P1 was significantly different for the rectum compared with the other 5 locations for all swine. However, P1 was not significantly different within other 5 locations. P2 was significantly different for the rectum vs. the skin among all swine. P3 was not significantly different among all locations and animals.
Table 1.
Estimated Value of the Parameters of the Parametric Model for all Locations and Pigs
| Location | Pig 1
|
Pig 2
|
Pig 3
|
Pig 4
|
||||||||
|---|---|---|---|---|---|---|---|---|---|---|---|---|
| P1 | P2 | P3 | P1 | P2 | P3 | P1 | P2 | P3 | P1 | P2 | P3 | |
| Scalp | 0.47 | 0.45 | 0.91 | 0.17 | 0.47 | 2.52 | 0.38 | 0.43 | 0.81 | 0.65 | 0.30 | −0.21 |
| Brain, 5 mm | 0.41 | 0.44 | 2.04 | 0.16 | 0.50 | 1.46 | 0.14 | 0.47 | 2.91 | 0.09 | 0.55 | 2.95 |
| Brain, 10 mm | 0.59 | 0.43 | 2.02 | 0.15 | 0.53 | 1.69 | 0.13 | 0.44 | 2.90 | 0.08 | 0.55 | 8.56 |
| Brain, 15 mm | 0.32 | 0.45 | 2.25 | 0.06 | 0.56 | 1.02 | 0.11 | 0.45 | 10.34 | 0.08 | 0.54 | 3.19 |
| Brain, 20 mm | 0.59 | 0.42 | 2.01 | 0.22 | 0.48 | 1.60 | 0.12 | 0.47 | 7.36 | 0.08 | 0.54 | 2.99 |
| Rectum | −0.03 | 0.48 | 1.08 | −0.71 | 0.73 | −0.80 | −2.18 | 0.68 | −1.99 | −0.35 | 0.54 | 0.01 |
Table 2 presents the body weight, head weight, net measured RF power near the RF coil and before the eight way power divider, whole head average SAR (SARavg), heating duration, and the RF power induced average maximum temperature change (dTmax,3h) in the head and rectum at the end of 3 h of the CW heating for all animals. The maximum average head temperature change of 1.68°C (standard deviation = 0.13°C) was measured in 3 h among all animals and head locations due to the power deposition with the large 7 T head coil.
Table 2.
The Body Weight, Head Weight, Net CW RF Power, Whole Head SARavg, Heating Duration, and RF Power Induced Maximum Rectal Temperature Change Due to 3 h of Power Deposition and the RF Power Induced Maximum Average Head Temperature Change Due to 3 h of Power Deposition are Presented for Swine
| Pig experiment no. | Body weight (kg) | Head weight (kg) | Net RF power (W) | SARavg (W kg−1) | Heating duration (h) | Rectal dTmax,3 h (°C) | Mean head dTmax,3 h (°C) |
|---|---|---|---|---|---|---|---|
| Pig 1 | 106 | 6.87 | 73.68 | 3.13 | 3.03 | 1.36 | 1.78 |
| Pig 2 | 105 | 7.12 | 75.04 | 3.08 | 3.07 | 1.65 | 1.73 |
| Pig 3 | 117 | 6.86 | 74.00 | 3.15 | 3.10 | 1.27 | 1.53 |
| Pig 4 | 115 | 7.38 | 74.64 | 2.95 | 3.15 | 1.22 | 1.68 |
Table 3 presents the difference in the pre-RF slope and the post-RF slope for the scalp-skin, 5, 10, 15, and 20 mm deep in the brain postdura, and rectum. No statistically significant difference was observed on the thermal response of pigs because of the RF heating in the post-RF epoch from that of the pre-RF epoch. From a standard one-way analysis of variance, the mean of the difference for a location was not significantly different from zero.
Table 3.
The Difference in the Pre-RF Slope and the Post-RF Slope (dS, °C h−1) is Presented for the Scalp-Skin, 5, 10, 15, and 20 mm deep in the brain postdura, and Rectum in Swine
| Location | dSPig 1 (°C h−1) | dSPig 2 (°C h−1) | dSPig 3 (°C h−1) | dSPig 4 (°C h−1) |
|---|---|---|---|---|
| Scalp | 0.02 | 0.04 | −0.03 | −0.17 |
| Brain, 5 mm | −0.08 | 0.10 | 0.08 | 0.02 |
| Brain, 10 mm | −0.10 | 0.13 | 0.06 | 0.03 |
| Brain, 15 mm | −0.09 | 0.14 | 0.08 | 0.01 |
| Brain, 20 mm | −0.10 | 0.06 | 0.10 | 0.01 |
| Rectum | 0.00 | 0.10 | −0.03 | 0.04 |
Figure 7 presents the temperature change distribution after 3 h of the CW RF irradiation in the cross section of the head, where the scalp and brain temperature probes were placed as predicted by the GBHTM. More RF heating was predicted in the brain compared with the scalp for a homogeneous, cylindrical head with uniform RF power deposition.
FIG. 7.

RF power induced temperature changes after 3 h in the pig-head cross-section where the scalp and brain temperature probes were placed.
Figure 8 presents the effect of natural cooling and forced cooling on the RF power induced temperature changes in the scalp, 15 mm deep in the brain, and 10 cm deep in the rectum due to the CW, 3 W kg−1 SARavg RF power deposition from the head coil. The temperatures were simulated using the simple GBHTM. The forced cooling decreased the temperature changes, increased the difference between the scalp temperature change and the brain temperature change, and minimally altered the brain and rectal temperature changes relative to the natural cooling for the RF deposition duration of ≤45 min.
FIG. 8.

Effect of cooling on the RF power induced temperature changes in swine. [Color figure can be viewed in the online issue, which is available at wileyonlinelibrary.com.]
Figure 9 presents the RF power induced temperature changes in the scalp, 15 mm deep in the brain, and 10 cm deep in the rectum because of a CW and a pulse wave (30 sec pulse with 9 W kg−1 of SARavg for 10 sec followed by 0 W kg−1 SARavg for 20 sec) RF power deposition of 45 min at the 6 min average SARavg of 3 W kg−1. The temperatures were simulated using the simple GBHTM. The temperature changes produced by the CW were closely mimicked by the temperature changes produced by the pulse wave.
FIG. 9.

Comparisons between the temperature changes produced by a CW and a pulse wave RF power deposition for the whole head average SAR of 3 W kg−1 and forced cooling. [Color figure can be viewed in the online issue, which is available at wileyonlinelibrary.com.]
DISCUSSION
Several important observations were made relevant to improving RF safety at ultra-high fields. First, the RF power induced temperature changes were insignificantly different from one another for a location among the animals studied with the 7 T head coil. This was explained as in vivo temperature depended on the thermal capacity, thermal diffusivity, blood-tissue heat transfer coefficient, blood flow, animal surface area, room temperature and humidity, and RF power (19). The thermal capacity, thermal diffusivity, blood-tissue heat transfer coefficient, and blood flow were expected to be spatially comparable in healthy swine of comparable weight and geometrical dimensions. Room temperature and humidity among experiments were comparable. The RF power distribution in the head was expected to be comparable because the head dimensions were comparable. Comparable heat loss capability from the skin resulted in unique rectal temperature change among swine. The observation suggested that in swine of comparable weights and dimensions, the effects of interanimal variability and variability in head-loading of the coil on the RF power induced temperature change were negligible. The observation was important because it further suggested that the RF power induced temperature change at a location may be negligibly different in thermophysiologically similar human subjects of comparable weights and dimensions.
Second, the RF power deposition with the large 7 T head coil produced temperature changes that were statistically insignificantly different from one another in the five head locations among the animals studied. The uniform head temperature change was attributed to the distance of >5 cm between the closest coil microstrip element and the measuring locations (including the scalp probe location) and highly perfused head. The observation suggested that a uniform RF induced temperature change might be produced in a healthy, perfused human head that is located “sufficiently” far away from the coil elements. The observation suggested the design of bigger RF coils with wider bores to produce uniform RF heating in the imaged tissue and avoid focal heating. Numerical modeling and experimental measurements in cadavers and humans may be performed to determine minimum coil dimensions to produce uniform RF heating during ultra-high field imaging.
Third, the RF power induced rectal temperature change was statistically significantly smaller than the RF power induced head temperature change. This was explained as the blood carried RF energy away from the head and distributed the energy all over the body including the surface from where it was lost to the ambient. It is important to note that not all of the RF energy deposited in the animal was lost to the environment. The difference between the deposited RF energy and the RF energy lost to the surrounding environment caused rectal temperature to rise over time. The observation suggested that the rectal temperature change may not be a true measure of the RF power induced in vivo temperature change of the imaged tissue. Validated and accurate bioheat transfer models are needed to predict and understand RF heating in humans to improve safety. Validated and accurate MR thermometry methods are needed to image RF heating in humans to comply with safety guidelines.
Fourth, the RF power induced temperature change did not achieve plateau with in 3 h of the RF power deposition. This was so because the pigs were unable to loose all of the RF energy deposited within them from their surface. The observation underscored the need to minimize RF power and scanning time to minimize RF heating and improve safety. Alternatively, the maximum scanning time duration should be determined to avoid violating safe thermal thresholds. No steady state plateau may be achieved for the RF power induced temperature change in humans at ultra-high fields.
Fifth, the animals studied tolerated the uniform head temperature change of ~1.68°C in 3 h with no change in the thermal response in the post-RF epoch from that in the pre-RF epoch. The pig is a thermophysiologically conservative model of humans. Therefore, the observation suggested that uniform temperature changes in the head up to 1.68°C in 3 h may be safely tolerated in healthy humans. The observation is further corroborated because a uniform body temperature change up to 2°C is routinely tolerated by humans during mild to high grade fever with no/minimal adverse, long term health hazards. However, it should be noted that the effect of nonuniform brain temperature changes of 1–3°C on local and systemic physiology of mammals is not well understood (10). Temperature changes on the order of 1°C produced altered thermophysiological thermal response in the post-RF epoch in swine at 9.4 T (6).
Sixth, the porcine brain temperature change resulting from the absorbed RF power exceeded 1°C within 1.5 h when the whole head average SAR in healthy animals was 3 W kg−1. The observation underscored the need to monitor in vivo temperatures to adhere to temperature safety guidelines at ultra-high fields in healthy and thermophysiologically challenged human subjects. At the minimum, an upper time limit may be specified for the RF power exposure to ensure that temperature safety guidelines are not exceeded.
Seventh, comparatively more RF heating was predicted in the brain than the scalp by the GBHTM for a uniform head cylinder with uniform RF power deposition (Fig. 7). Temperature changes in a perfused tissue because of RF irradiation from a coil is a combined effect of the electrodynamics of the coil (a function of the coil design, magnitude, frequency, and phase of the RF wave, and excitation scheme) and the tissue (a function of the geometry and distribution of electromagnetic properties), and the thermodynamics of the tissue (a function of the geometry, distribution of thermal properties, and blood flow). The significant effect of the electrodynamics of a coil and tissue on the nonuniform RF power deposition in the tissue has been demonstrated before (1,23). The effect of the nonuniform RF power on producing nonuniform measurable RF heating needs to be further studied using thermal models of the vascularized, perfused tissues because nonuniform temperatures, and not SAR, present the safety concern.
Eighth, the forced cooling minimally altered the deep brain and rectal temperature changes for the RF power deposition duration of ≤45 min at the whole head average SAR of 3 W kg−1 (Fig. 8) in comparison with the temperature changes produced during the natural cooling. The observation suggested reducing RF power and scanning duration to reduce RF heating. The forced cooling reduced the scalp, brain, and rectal temperature changes for the RF power deposition duration of >45 min (Fig. 8) in comparison with the temperature changes produced during the natural cooling. This observation suggested employing forced cooling to keep subjects cool during long SAR intensive imaging sessions.
Ninth, temperature changes produced by a CW with the SARavg of 3 W kg−1 were closely mimicked by the temperature changes produced by the worst case 30 sec pulse wave with the SARavg of 9 W kg−1 for the first 10 sec followed by the SARavg of 0 W kg−1 for the next 20 sec making a 30-sec pulse with SARavg of 3 W kg−1 (Fig. 9) (8,9). Therefore, there is minimal difference between the temperature changes produced by a CW and an International Commission on Non-Ionizing Radiation Protection Committee compliant RF pulse wave. Thermal equivalency of a CW and a “quick” pulse wave with the same SARavg has been shown before for other applications (24–26).
Tenth, simple validated bioheat models may accurately predict in vivo temperature changes produced with RF power deposition from large coils. The simple GBHTM accurately simulated the temperature changes for the entire RF power deposition duration of ~3 h. The implementation of the full, validated GBHTM for a standard and subject-specific head is expected to predict accurate in vivo temperature changes produced with RF power deposition from large and small coils. Thus, online and offline implementations of the simplified GBHTM and the full GBHTM may help in the design and execution of safe MR pulses and imaging sessions. The Pennes’ BHTE accurately simulated the temperature changes in the scalp and brain for the RF power deposition duration of approximately <10 min. The inherent lack of modeling of the spatial and temporal variation of the blood temperature prevents the Pennes’ BHTE to simulate accurate in vivo temperatures in situations where the blood temperature may change in space and time.
When comparing this study with previous studies, Barber et al. (27) measured the RF power induced maximum temperature change in the head-skin and jugular vein of 0.2 and 0.1°C (W kg−1)−1 h−1, respectively at 1.5 T (64 MHz). Kangarlu et al. (28,29) measured the brain temperature change of 0–1.05°C (W kg−1)−1 h−1 in the nonperfused head phantoms filled with the ground turkey at 8 T (340 MHz). Shrivastava et al. (6,7) measured the RF power induced maximum temperature change of 0.05–0.15°C (W kg−1)−1 h−1 and 0.06–0.12°C (W kg−1)−1 h−1 in the brain and rectum of anesthetized swine at 9.4 T (400 MHz), respectively. Adair et al. (30) measured the maximum skin temperature change of 0.12°C (W kg−1)−1 h−1 at 450 MHz. These previous results were in reasonable agreement with the RF power induced average temperature change obtained in this study of 0.19°C (W kg−1)−1 h−1 and 0.15°C (W kg−1)−1 h−1 in the porcine head and rectum, respectively. A comparison with the RF power induced temperature changes presented in Shellock and Crues (31) could not be made because the heating duration corresponding to the maximum temperature change was unavailable.
Regarding the limitations of the study, the RF power distribution from a coil depended on the geometry and electrical properties of an imaged tissue. In vivo temperature distribution depended on the geometry, thermal properties, blood-tissue heat transfer coefficient, and blood flow. The differences in the geometry, spatial distribution of electrical and thermal properties, and spatial distribution of the blood flow of the human and porcine head prohibited directly extrapolating our results to humans. Further, anesthesia changes thermoregulatory thresholds and blood flow distribution in mammals (15). This would affect in vivo temperature response induced by an RF power distribution. Nevertheless, thermophysiologically conservative animal models (e.g., porcine) with human comparable thermal mass are useful in studying approximate RF heating and its unknown thermophysiologic effects. Fresh perfused cadaver models and humans are required to study accurate spatial and temporal distribution of RF heating.
CONCLUSIONS
Uniform RF power induced temperature changes were produced in the pigs’ heads due to exposure to a CW RF power from a large, eight channel, 7 T head coil. A uniform change in head temperature up to 1.68°C in 3 h was tolerated by all pigs studied with no statistically significant change in the thermal response during the post-RF epoch from that during the pre-RF epoch. The GBHTM may accurately predict in vivo temperature changes produced with RF power deposition from large coils.
FIG. 4.

RF power induced temperature changes 5 mm deep in the brain of swine. [Color figure can be viewed in the online issue, which is available at wileyonlinelibrary.com.]
FIG. 5.

RF power induced temperature changes 15 mm deep in the brain of swine. [Color figure can be viewed in the online issue, which is available at wileyonlinelibrary.com.]
Acknowledgments
Grant sponsor: National Institute of Health (NIH); Grant numbers: R01 EB007327, R01 EB000895, R01 EB006835, BTRR–P41 RR08079; Grant sponsor: Keck Foundation
References
- 1.Vaughan JT, Garwood M, Collins CM, Liu W, DelaBarre L, Adriany G, Andersen P, Merkle H, Goebel R, Smith MB, Ugurbil K. 7T vs. 4T: RF power, homogeneity, and signal-to-noise comparison in head images. Magn Reson Med. 2001;46:24–30. doi: 10.1002/mrm.1156. [DOI] [PubMed] [Google Scholar]
- 2.Abragam A. Principles of Nuclear Magnetism. Oxford University Press; Cary, NC: 1983. [Google Scholar]
- 3.Gabriel S, Lau RW, Gabriel C. The dielectric properties of biological tissues: III. Parametric models for the dielectric spectrum of tissues. Phys Med Biol. 1996;41:2271–2293. doi: 10.1088/0031-9155/41/11/003. [DOI] [PubMed] [Google Scholar]
- 4.Gabriel S, Lau RW, Gabriel C. The dielectric properties of biological tissues: II. Measurements in the frequency range 10 Hz to 20 GHz. Phys Med Biol. 1996;41:2251–2269. doi: 10.1088/0031-9155/41/11/002. [DOI] [PubMed] [Google Scholar]
- 5.Gabriel C, Gabriel S, Corthout E. The dielectric properties of biological tissues: I. Literature survey. Phys Med Biol. 1996;41:2231–2249. doi: 10.1088/0031-9155/41/11/001. [DOI] [PubMed] [Google Scholar]
- 6.Shrivastava D, Hanson T, Kulesa J, DelaBarre L, Snyder C, Vaughan JT. Radio-frequency heating at 9. 4T—in vivo thermoregulatory temperature response in swine. Magn Reson Med. 2009;62:888–895. doi: 10.1002/mrm.22072. [DOI] [PMC free article] [PubMed] [Google Scholar]
- 7.Shrivastava D, Hanson T, Schlentz R, Gallaghar W, Snyder C, Delabarre L, Prakash S, Iaizzo P, Vaughan JT. Radiofrequency heating at 9. 4T: in vivo temperature measurement results in swine. Magn Reson Med. 2008;59:73–78. doi: 10.1002/mrm.21425. [DOI] [PMC free article] [PubMed] [Google Scholar]
- 8.ICNIRP. Medical magnetic resonance (MR) procedures: protection of patients. Health Physics. 2004;87:197–216. doi: 10.1097/00004032-200408000-00008. [DOI] [PubMed] [Google Scholar]
- 9.ICNIRP. Amendment to the ICNIRP “Statement on medical magnetic resonance (MR) procedures: protection of patients. Health Physics. 2009;97:259–261. doi: 10.1097/HP.0b013e3181aff9eb. [DOI] [PubMed] [Google Scholar]
- 10.Dewhirst MW, Viglianti BL, Lora-Michiels M, Hanson M, Hoopes PJ. Basic principles of thermal dosimetry and thermal thresholds for tissue damage from hyperthermia. Int J Hyperthermia. 2003;19:267–294. doi: 10.1080/0265673031000119006. [DOI] [PubMed] [Google Scholar]
- 11.Yacoub E, Shmuel A, Pfeuffer J, Van De Moortele PF, Adriany G, Andersen P, Vaughan JT, Merkle H, Ugurbil K, Hu X. Imaging brain function in humans at 7 Tesla. Magn Reson Med. 2001;45:588–594. doi: 10.1002/mrm.1080. [DOI] [PubMed] [Google Scholar]
- 12.Pfeuffer J, Adriany G, Shmuel A, Yacoub E, Van De Moortele PF, Hu X, Ugurbil K. Perfusion-based high-resolution functional imaging in the human brain at 7 Tesla. Magn Reson Med. 2002;47:903–911. doi: 10.1002/mrm.10154. [DOI] [PubMed] [Google Scholar]
- 13.Scheenen TW, Heerschap A, Klomp DW. Towards 1H-MRSI of the human brain at 7T with slice-selective adiabatic refocusing pulses. MAGMA. 2008;21:95–101. doi: 10.1007/s10334-007-0094-y. [DOI] [PMC free article] [PubMed] [Google Scholar]
- 14.Oh S, Webb AG, Neuberger T, Park B, Collins CM. Experimental and numerical assessment of MRI-induced temperature change and SAR distributions in phantoms and in vivo. Magn Reson Med. 2010;63:218–223. doi: 10.1002/mrm.22174. [DOI] [PMC free article] [PubMed] [Google Scholar]
- 15.Mount LE. In: Adaptation to Thermal Environment—Man and his Productive Animals. Barrington EJW, Willis AJ, Sleigh MA, editors. Baltimore: University Park Press; 1979. p. 333. [Google Scholar]
- 16.Duck F. Physical Properties of Tissue. London: Academic Press; 1990. [Google Scholar]
- 17.Holmes KR. Thermal conductivity of selected tissues. In: Diller KR, editor. Biotransport—Heat and Mass Transfer in Living Systems. Annals of the New York Academy of Sciences. Vol. 858. New York: The New York Academy of Sciences; 1998. pp. 18–19. [Google Scholar]
- 18.Becker BA, Niwano Y, Johnson HD. Physiologic and immune responses associated with 48-hour fast of pigs. Lab Anim Sci. 1992;42:51–53. [PubMed] [Google Scholar]
- 19.Shrivastava D, Vaugahn JT. A generic bioheat transfer thermal model for a perfused tissue. ASME J Biomech Eng. 2009;131:074506. doi: 10.1115/1.3127260. [DOI] [PMC free article] [PubMed] [Google Scholar]
- 20.Pennes HH. Analysis of tissue and arterial blood temperatures in the resting human forearm. 1948. J Appl Physiol. 1998;85:5–34. doi: 10.1152/jappl.1998.85.1.5. [DOI] [PubMed] [Google Scholar]
- 21.Ishigaki H, Horikoshi T, Uematsu T, Sahashi M, Tsuchikawa T, Mochida T, Hieda T, Isoda N, HK Experimental study on convective heat transfer coefficient of the human body. J Therm Biol. 1993;18:455–458. [Google Scholar]
- 22.Guyton AC, Hall JE. Textbook of Medical Physiology. Philadelphia: Elsevier; 2006. [Google Scholar]
- 23.Collins CM, Liu W, Wang J, Gruetter R, Vaughan JT, Ugurbil K, Smith MB. Temperature and SAR calculations for a human head within volume and surface coils at 64 and 300 MHz. J Magn Reson Imaging. 2004;19:650–656. doi: 10.1002/jmri.20041. [DOI] [PubMed] [Google Scholar]
- 24.Frei MR, Jauchem JR, Padilla JM. Thermal and physiological changes in rats exposed to CW and pulsed 2. 8 GHz radiofrequency radiation in E and H orientations. Int J Radiat Biol. 1989;56:1033–1044. doi: 10.1080/09553008914552481. [DOI] [PubMed] [Google Scholar]
- 25.Adair ER, Mylacraine KS, Cobb BL. Partial-body exposure of human volunteers to 2450 MHz pulsed or CW fields provokes similar thermoregulatory responses. Bioelectromagnetics. 2001;22:246–259. doi: 10.1002/bem.47. [DOI] [PubMed] [Google Scholar]
- 26.Frei MR, Jauchem JR, Heinmets F. Thermoregulatory responses of rats exposed to 9. 3-GHz radiofrequency radiation. Radiat Environ Biophys. 1989;28:67–77. doi: 10.1007/BF01209724. [DOI] [PubMed] [Google Scholar]
- 27.Barber BJ, Schaefer DJ, Gordon CJ, Zawieja DC, Hecker J. Thermal effects of MR imaging: worst-case studies on sheep. AJR Am J Roentgenol. 1990;155:1105–1110. doi: 10.2214/ajr.155.5.2120944. [DOI] [PubMed] [Google Scholar]
- 28.Kangarlu A, Ibrahim TS, Shellock FG. Effects of coil dimensions and field polarization on RF heating inside a head phantom. Magn Reson Imaging. 2005;23:53–60. doi: 10.1016/j.mri.2004.11.007. [DOI] [PubMed] [Google Scholar]
- 29.Kangarlu A, Shellock FG, Chakeres DW. 8. 0-Tesla human MR system: temperature changes associated with radiofrequencyinduced heating of a head phantom. J Magn Reson Imaging. 2003;17:220–226. doi: 10.1002/jmri.10236. [DOI] [PubMed] [Google Scholar]
- 30.Adair ER, Kelleher SA, Mack GW, Morocco TS. Thermophysiological responses of human volunteers during controlled whole-body radio frequency exposure at 450 MHz. Bioelectromagnetics. 1998;19:232–245. doi: 10.1002/(sici)1521-186x(1998)19:4<232::aid-bem5>3.0.co;2-2. [DOI] [PubMed] [Google Scholar]
- 31.Shellock FG, Crues JV. Temperature changes caused by MR imaging of the brain with a head coil. AJNR Am J Neuroradiol. 1988;9:287–291. [PMC free article] [PubMed] [Google Scholar]