Abstract
Optical techniques for in vivo measurement of blood flow velocity are not quite applicable for determination of velocity of individual cells or nanoparticles. Here, we describe a photoacoustic time-of-flight method to measure the velocity of individual absorbing objects by using single and multiple laser beams. Its capability was demonstrated in vitro on blood vessel phantom and in vivo on an animal (mouse) model for estimating velocity of gold nanorods, melanin nanoparticles, erythrocytes, leukocytes, and circulating tumor cells in the broad range of flow velocity from 0.1 mm/s to 14 cm/s. Object velocity can be used to identify single cells circulating at different velocities or cell aggregates and to determine a cell’s location in a vessel cross-section.
Several optical techniques have been developed to measure blood flow velocity, including various modifications of Doppler flowmetry [1,2] and time-of-flight detection of moving local flow volume heated electrically or by laser [3–5]. Doppler-based methods require the presence of small scattering and absorbing particles (e.g., erythrocytes as endogenous tracers) whose movement provides spectral shifting (i.e., Doppler effects) of optical or acoustic signals. In time-of-flight photothermal techniques, a laser-pump pulse produces a small locally heated zone whose movement with the blood flow is detected, with defocusing or deflection of a second probe beam, due to temperature-dependent changes in the refractive index of the medium [5]. However, these and similar methods are not quite applicable to measuring the velocity of individual objects, as is required in many areas of basic and applied sciences [3]. To overcome this problem, we proposed photoacoustic (PA) flow cytometry (PAFC) with time-of-flight velocity measurement mode [6,7]; however, the capability of this mode was not explored in necessary details. Here, we demonstrate that PAFC with high-pulse-repetition-rate lasers and multiple laser beams allows measurement of the velocity of individual cells and nano- and microparticles in vivo, which can be used for their identification.
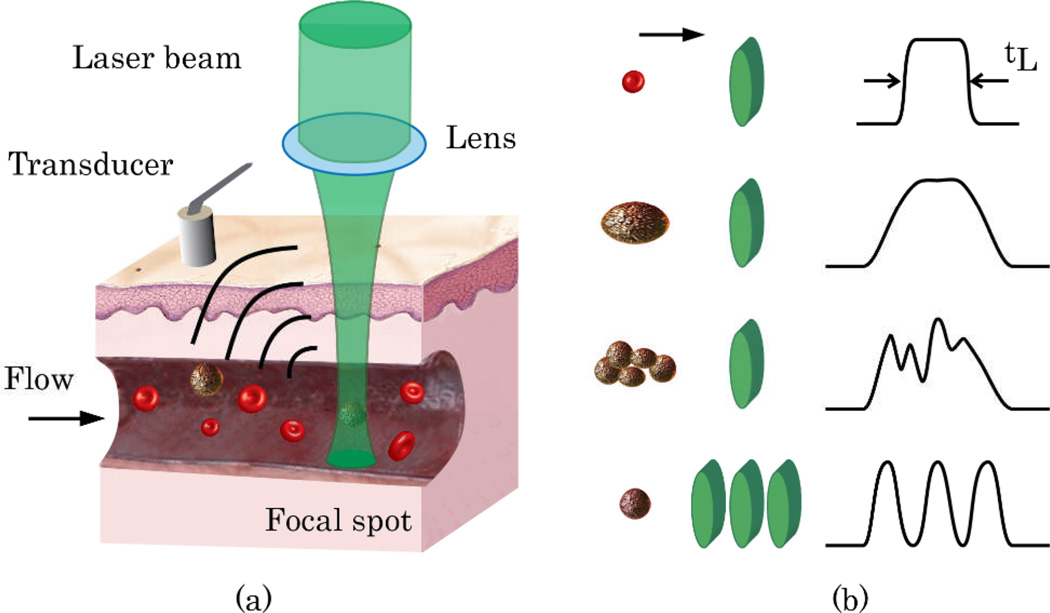
The principles of PAFC time-of-flight technique with one- and three-beam configurations are illustrated in Figure 1. In the one-beam scheme, an object (e.g., cell or particle) passing a laser beam is irradiated by multiple laser pulses. The number of PA signals generated from the same object is defined as N=tLf, where f is the laser pulse rate, and tL is the lifetime of the cell in the irradiated volume. An increase in PA signal amplitude due to the presence of an absorbing object in flow creates a peak of a certain width (tL), above the background (first two diagrams of Fig. 1b for single cells, and the third diagram for an aggregate of cells). The time-of-flight of this object in the irradiated volume can be estimated from the full width at half maximum (FWHM) of the PA peak. The linear velocity of the object (VC), is obtained from the equation VC≈(D+d)/tL, where D is the diameter of the object and d is the width of the laser beam. Thus, Vc can be measured for an object and laser beam of known sizes.
Fig. 1.
(Color online) (a) PA time-of-flight velocity measurement with cylindrical laser beam. (b) Shapes of PA peaks for different sized objects (illustrated on the left as red or brown circles) and various beam geometries (one- or three-beam; illustrated as green ovals).
In the three-beam scheme, linear velocity of an object is determined by the time it takes for the object to travel between multiple laser beams (Fig. 1b, bottom diagram). In this case, an object in flow produces multiple consequent trains of PA signals. Object velocity can be estimated by using the time intervals between the trains and the distances between the beams; the measurement is independent of the object size.
To verify these approaches, we used high-speed PAFC, which was described in detail elsewhere [6,7]. Briefly, the PAFC system was built on the platform of an upright Olympus BX51 microscope (Olympus America, Inc.) and high-pulse-repetition-rate nanosecond lasers with the following parameters: 1) 671-nm wavelength, 35-µJ pulse energy, 24-ns pulse width, 10-kHz pulse rate (model QL671-500, CrystaLaser); 2) 820-nm wavelength, 75-µJ pulse energy, 8-ns pulse width, 10-kHz pulse rate (LUCE 820, Bright Solutions); 3) 1064-nm wavelength, 35-µJ pulse energy, 10-ns pulse width, 10-kHz pulse rate (MOPA-M-10, Multiwave Photonics, Porto, Portugal); and 4) 905-nm wavelength, 7-µJ pulse energy, 100-ns pulse width, 3-kHz pulse rate (diode laser 905-FD1S3J08S, Power Technology, Inc.). Laser radiation was delivered to the samples through a condenser (U-AAC, Olympus) that was modified by replacing its top lens with a cylindrical one (diameter, 25.4 mm; focal length, 250 mm; Thorlabs, Inc.). As a result, the laser beam could be focused in a linear-shaped spot with dimensions ranging from 10×50 to 30×150 µm. Laser radiation was collected by the objective (4× magnification, 0.13 NA, SPlan 4PL, Olympus, Inc.) and imaged by a color CCD camera (PC243, SuperCircuits, Inc.) to monitor location, shape, and size of the laser spot. PA signals were acquired by an ultrasound transducer (6528101, Imasonic Inc., Besancon, France). Signals from the transducer were amplified (pre-amplifier 5662B, Panametrics), digitized (AD484 high-speed digitizer, 4DSP, Inc.), recorded, and analyzed by custom-written software. A diode laser (905-nm wavelength) had three emitting elements that formed three parallel linear beams after light focusing (Fig. 2c,d). PA signals in the three-beam scheme were acquired by a boxcar system (SR250/SR280, Stanford Research Systems, Inc.). The temporal-signal shapes were controlled by an oscilloscope (TDS 3032B, Tektronix). In vitro velocity of objects was also calculated from a set of images obtained by a high-speed (up to 10,000 frames/s) CMOS camera (MV-D1024-160-CL-8, PhotonFocus, Switzerland).
Fig. 2.
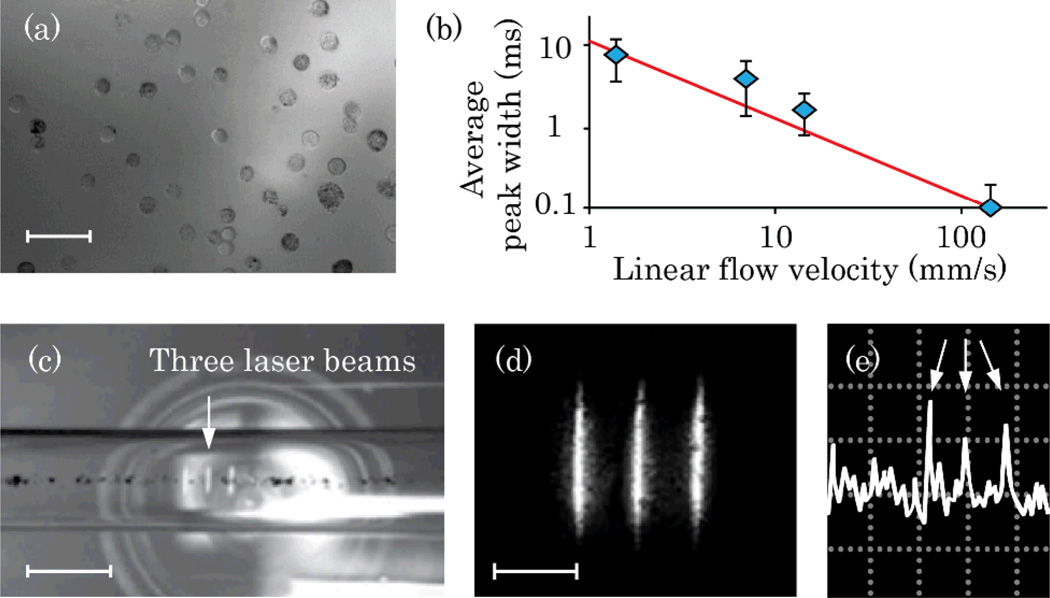
(Color online) In vitro time-of-flight PAFC. (a) Suspension of B16F10 cells; scale bar, 50 µm. (b) Calculated (line) and experimentally obtained (diamonds) peak widths for one-beam PAFC (1064-nm laser). (c) Melanin suspension in 300-µm capillary tube with three-diode laser beam PAFC (905 nm); scale bar, 250 µm. (d) High-resolution image of three beams in local plane; scale bar, 100 µm. (e) Typical PA signal pattern for three-beam detection scheme (triple peak marked with arrows); amplitude/time scale, 200 mV/div/100 ms/div.
B16F10 mouse melanoma cells, and MDA-MB-231 human breast cancer cells (ATCC, Rockville, MD) were cultured according to standard procedures. Gold nanorods (GNRs) with maximum absorption at 660 and 820 nm (GNR-660 and GNR-820; Nanopartz, Inc. Loveland, CO) were conjugated with folate and antibody against CD-45, respectively. In vitro experiments were performed in glass capillary tubes (300-µm inner diameter) in a glycerol bath. Flow was created with a syringe pump (KDS200, KD Scientific Inc.). In vivo experiments were performed in ear and abdominal skin blood vessels in nude mice (Harlan Sprague–Dawley), in accordance with protocols approved by University of Arkansas for Medical Sciences Institutional Animal Care and Use Committee. After intraperitoneal anesthesia with ketamine/xylazine (50/10 mg/kg), mice were put on a heated microscope stage. The transducer was gently placed on the skin, close to the monitored blood vessels.
The feasibility of collecting PA time-of-flight velocity measurements with a single-beam approach was tested in vitro for B16F10 cells flowing at velocities ranging from 0.2 to 140 mm/s (Fig. 2a). Widths of the peaks (Fig. 2b) decreased in faster flows, as cells were leaving the detection volume faster than in slower flow. Experimental data correlated well with the peak widths estimated for a 13-µm diameter cell crossing a 30-µm–wide laser spot (Fig. 2b, line); this was confirmed by high-speed imaging.
The three-beam scheme was tested in vitro for melanin particle suspension (2 µg/ml) in phosphate buffered saline; particle sizes ranged from 100-nm to micrometer-sized clusters (Fig. 2c,d). Flow velocity was varied from 7 to 70 mm/s. A regular three-peak pattern was observed for individual and clustered melanin particles (Fig. 2e). The average particle velocities calculated from PA data ranged from 0.4 to 1.9, 0.8 to 3.5, and 1.2 to 6.7 mm/s for flow velocities of 7, 23, and 70 mm/s. High-speed imaging of moving particles showed flow velocities that ranged from 0.9 to 1.8, 2 to 5.6, and 4.6 to 14 mm/s, correspondingly. The slightly lower velocity measured by PAFC can be associated with detection of mainly large melanin clusters, which moved more slowly in the flow.
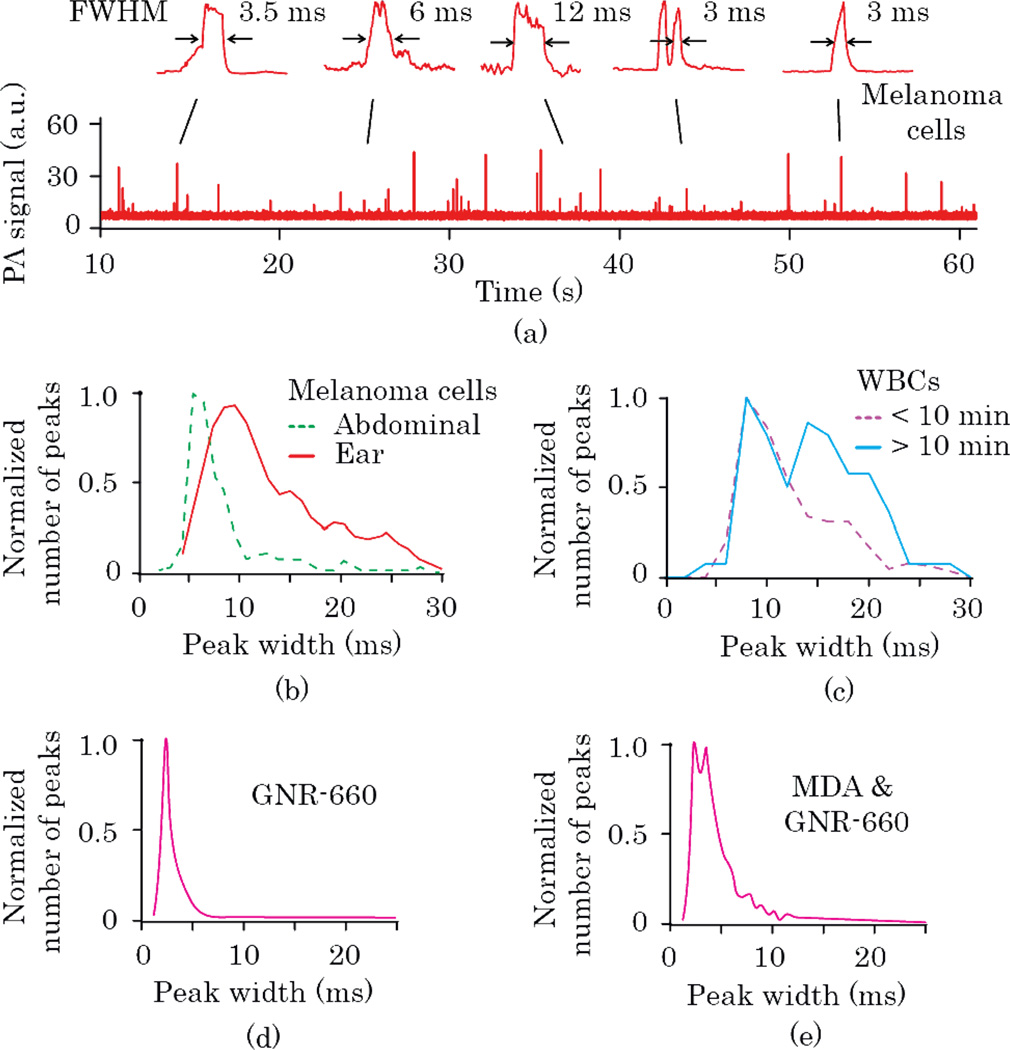
In vivo velocity measurements were made with the one-beam scheme for circulating cells and nanoparticles injected into tail veins of nude mice. B16F10 melanoma cells were injected for analysis by PA time-of-flight velocity (Fig. 3a,b). According to the peak-width distributions (Fig. 3b), peaks observed in smaller 50-µm ear vessels were wider than those in relatively large 200-µm abdominal skin vessels, indicating slower blood flow in smaller vessels, as expected. Based on statistics of peak-width distributions, we estimated average levels of linear cell velocities. The obtained 5 and 10-ms maxima of peak-width histograms for abdominal and ear vessels corresponded to velocities of 12 and 6 mm/s (D≈13 µm), which were in agreement with the literature [8].
Fig. 3.
(Color online) In vivo time-of-flight PAFC. (a) Typical PA signal trace and peak shapes for B16F10 cells, in mouse ear vessel (1064-nm laser). Peak width distributions for (b) B16F10 cells in abdominal wall and ear blood vessels (1064 nm), (c) different time frames after i.v. injection of GNR-820-CD-45 for targeting WBCs in mouse circulation (820 nm), (d) i.v. injection of GNR-660-folate (671 nm), and (e) i.v. injection of MDA-MB-231 breast cancer cells labeled in vitro by GNR-660-folate (671 nm).
We also monitored in real time the changes in peak widths that resulted from in vivo labeling of white blood cells (WBCs) by GNR-820 conjugated with antibody against WBC receptor CD-45. Three distinct phases were observed post injection: frequent PA peaks in the first 5–10 minutes, an interval of 10–20 min with no or few peaks, and a gradual increase in peak number during next 3 hours of monitoring. Peak-width histograms revealed the presence of wider peaks in the second and third phases, featuring double maxima associated with slowly rolling WBCs (Fig 3c). Width-distribution maxima at 8 and 14 ms corresponded to 3 and 1.7 mm/s linear flow velocities, respectively (for D≈9 µm).
Next, we compared histograms of peak widths for GNR-660 alone (Fig. 3d) and MDA-MB-231 breast cancer cells labeled in vitro with GNR-660 (Fig. 3e). For individual GNRs, a narrow peak-width distribution was observed (maximum at ~2.4 ms) associated with the small size of GNRs. The calculated velocity of individual GNR-660 was 6.3 mm/s. This relatively high velocity could be related to preferential moving of small nanoparticles in the center of the vessel, which is the fastest portion of the flow. For MDA-MB-231 breast cancer cells labeled with GNR-660, a wider peak distribution was observed. Peaks wider than 10 ms may be associated with tumor cells rolling slowly along the vessel walls, in analogy to WBCs.
In general, the peak-width analysis in the time-of-flight mode revealed important information on objects’ velocities in blood flow, on possible cell aggregation manifested by the appearance of wider peaks with complex shapes, and on rolling effects that result in slower cell velocity. However, width histograms alone were not sufficient to distinguish a large aggregate of cells with high velocity and an individual rolling cell moving slowly because both would produce peaks of similar widths.
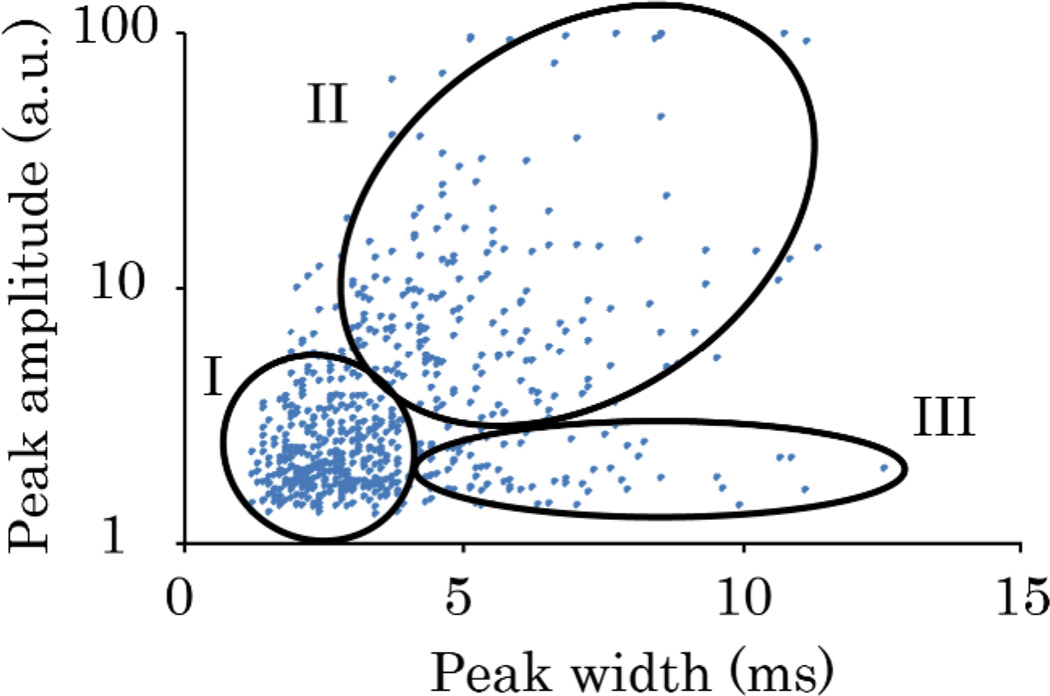
We hypothesized that these cells could be identified with a two-parameter plot representing PA peak amplitude and peak widths obtained from time-of-flight measurements. Figure 4 illustrates verification of this approach for B16F10 cells. Three areas of interest were selected for this scatter plot: I) the area with the highest density of events, corresponding to fast-moving individual cells; II) aggregates of cells that were larger and had more melanin than individual cells; and III) peaks with PA signal too small to consider these objects as aggregates. However, large widths in III suggested that these cells were moving much more slowly than the other cells. Therefore, multi-parameter analysis of PA data may provide a criterion for distinguishing aggregates and individual rolling cells.
Fig. 4.
(Color online) Scatter plot of height and width of peaks for label-free PAFC detection of circulating B16F10 cells in mouse ear arteriole (1064 nm). Area I suggests signals from individual cells; area II includes aggregates of several cells; area III indicates possible rolling cells.
Thus, proof-of-the concept for high-speed PAFC time-of-flight velocity measurements of circulating objects was demonstrated for nano- and micro-particles and for various types of cells in vitro (with single- and multi-beam schemes) and in vivo (with single-beam scheme). Multi-beam PAFC geometry provided greater accuracy for velocity calculations of rare objects, with no information required of object sizes. However, for multiple objects located close to each other, interpretation of PA data requires further study.
Flow velocities of cells and particles in mouse ear capillaries, obtained with one-beam PAFC, ranged from 3 to 12 mm/s, which was in line with our previous data and that in the literature [8]. Differences in cell velocities were likely related to cell diameters, different locations of cells within the blood vessel cross-section, rolling effects, and variations in blood flow rates of different vessels. PAFC scatter plot was a robust approach for distinguishing cell aggregates and individual, slow-rolling cells in flow [9].
Acknowledgments
We acknowledge support of grants from the National Institutes of Health (R01EB000873, R01CA131164, R01EB009230, and R21CA139373), the National Science Foundation (DBI-0852737), and from the Department of Defense (W88XWH-10-2-0130, W81XWH-10-BCRP-CA, and W81XWH-11-1-0129).
References with titles
- 1.Yeh Y, Cummins HZ. Localized fluid flow measurements with an He-Ne laser spectrometer. Appl. Phys. Lett. 1964;4:176. [Google Scholar]
- 2.Fang H, Maslov K, Wang LV. Photoacoustic Doppler effect from flowing small light-absorbing particles. Phys. Rev. Lett. 2007;99:184501. doi: 10.1103/PhysRevLett.99.184501. [DOI] [PubMed] [Google Scholar]
- 3.Sell JA, editor. Photothermal Investigations of Solids and Fluids. New York: Academic Press; 1989. [Google Scholar]
- 4.Zharov VP, Galanzha EI, Tuchin VV. Photothermal imaging of moving cells in lymph and blood flow in vivo. Proc. SPIE. 2004;5320:256. [Google Scholar]
- 5.Zharov VP, Galanzha EI, Tuchin VV. Integrated photothermal flow cytometry in vivo. J Biomed Opt. 2005;10:051502. doi: 10.1117/1.2070167. [DOI] [PubMed] [Google Scholar]
- 6.Galanzha EI, Shashkov EV, Spring PM, Suen JY, Zharov VP. In vivo, noninvasive, label-free detection and eradication of circulating metastatic melanoma cells using two-color photoacoustic flow cytometry with a diode laser. Cancer Res. 2009;69:7926. doi: 10.1158/0008-5472.CAN-08-4900. [DOI] [PMC free article] [PubMed] [Google Scholar]
- 7.Nedosekin DA, Sarimollaoglu M, Shashkov EV, Galanzha EI, Zharov VP. Ultra-fast photoacoustic flow cytometry with a 0.5 MHz pulse repetition rate nanosecond laser. Opt. Express. 2010;18:8605–8620. doi: 10.1364/OE.18.008605. [DOI] [PMC free article] [PubMed] [Google Scholar]
- 8.Charm SE, Kurland GS. Blood flow and microcirculation. Wiley; 1974. [Google Scholar]
- 9.Ishikawa M, Fernandez B, Kerbel RS. Highly pigmented human melanoma variant which metastasizes widely in nude mice, including to skin and brain. Cancer Res. 1988;48:4897, 4903. [PubMed] [Google Scholar]


