Abstract
While there is broad agreement on the catalytic mechanism of Multicopper Oxidases (MCOs), the geometric and electronic structures of the resting trinuclear Cu cluster have been variable, and their relevance to catalysis debated. Here, we present a spectroscopic characterization, complimented by crystallographic data, of two resting forms occurring in the same enzyme, and define their interconversion. The resting oxidized form shows similar features to the resting form in Rhus vernicifera and Trametes versicolor laccase, characterized by ‘normal’ type 2 Cu EPR features, 330nm absorption shoulder, and a short type 3 (T3) Cu-Cu distance, while the alternative resting form shows unusually small A-parallel and high g-parallel EPR features, lack of 330nm absorption intensity, and a long T3 Cu-Cu distance. These different forms are evaluated with respect to activation for catalysis, and it is shown that the alternative resting form can only be activated by low-potential reduction, in contrast to the resting oxidized form which is activated via the type 1 Cu at high potential. This difference in activity is correlated to differences in redox states of the two forms, and highlights the requirement for efficient sequential reduction of resting MCOs for their involvement in catalysis.
Multicopper Oxidases (MCOs) are a large group of enzymes, including laccase, CueO, Fet3p, and Bilirubin Oxidase (BOD).1 These enzymes couple single electron oxidations of various substrates to the four electron reduction of dioxygen to water.2 This reactivity is performed with a minimum of four Cu ions, arranged in a type 1 (T1) Cu and a trinuclear Cu (TNC) site, respectively.3 The T1 Cu, ranging in potential from +350–800mV,4 receives electrons from the substrate, and transfers these to the TNC, which is the site of dioxygen reduction.5 A generally accepted reaction mechanism for O2 reduction by the TNC involves two two-electron transfers, starting from a fully reduced enzyme.6 In the first step, O2 is reduced by two electrons, forming the so-called Peroxy Intermediate (PI). This is followed by a second two-electron transfer, which results in cleavage of the O-O bond, and formation of a second intermediate, the Native Intermediate (NI). The catalytic cycle is completed upon reduction of NI by a total of four electrons, regenerating a fully reduced enzyme.6
Different resting forms of MCOs have been observed, and there has been some debate as to which is the relevant form for activation for catalysis.7 The most well characterized form is the as-isolated resting oxidized form observed in Rhus vernicifera and Trametes versicolor (TvL). This resting form is also obtained in the decay of NI in the absence of reducing substrate.8 In the resting oxidized form, the TNC is fully oxidized with spectroscopically defined mononuclear T2 Cu(II) and binuclear T3 Cu(II) sites. The T2 Cu(II) is magnetically isolated, with ‘normal’ Electron Paramagnetic Resonance (EPR) parameters of g□ = 2.22–2.27 and A□ = 170–200×10−4cm−1, and the absence of intense UVvis absorption features. The T3 Cu(II)’s are antiferromagnetically coupled, with intense charge transfer transitions around 330nm, originating from a bridging hydroxide ligand.2 Correlated crystal structures show an oxygen bridging atom in between the T3 Cu’s, which are separated by <4Å9 (Table 1). In contrst, an alternative resting form of MCOs has been observed primarily in Bilirubin Oxidases (BODs), including CotA from Bacillus subtilis. This alternative resting form is characterized by a TNC with an unusually small A□ (80–100×10−4cm−1),10 lack of 330nm absorption intensity, and T3 Cu-Cu distances of >4.7Å, with a dioxygen or single oxygen bridging the two T3 Cu’s7,11 (Table 1).
Table 1.
Spectroscopic and structural properties of resting forms of MCOs.
| EPR (A□, g□) | 330nm abs. |
T3-T3 Cu distance |
|
|---|---|---|---|
| Resting oxidized | 170–200×104cm−1 2.22–2.27 |
yes | <4Å |
| Alternative resting | 80–100×10−4cm−1 2.34–2.39 |
no | >4.7Å |
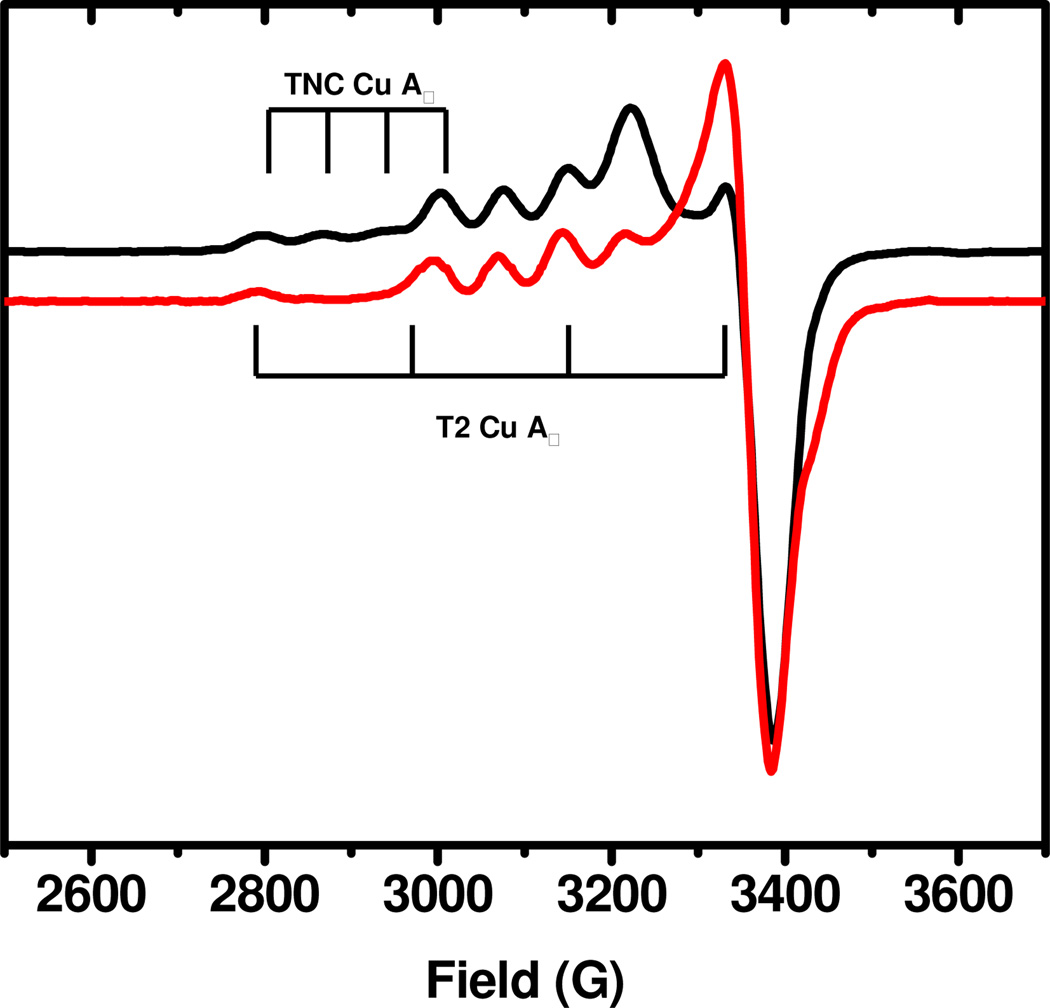
Herein, we define both the resting oxidized and the alternative resting forms of MCOs in the same BOD enzyme, and show these can be interconverted. From a detailed spectroscopic analysis, we identify a difference in the redox states of the TNC in the two forms, and correlate this to differences in activation for catalysis and in geometric structure. BOD from Magnaporthe oryzae was expressed in Pichia pastoris and purified to homogeneity.12 The as-isolated enzyme has an intense blue color (ie. oxidized T1 Cu), and 3.7–3.9 Cu’s/molecule as determined by the biquinoline method and by atomic absorption spectroscopy for the enzyme solution at neutral pH.12 Figure 1 shows the EPR spectrum (black) of the as-isolated BOD, with spin integrated intensity of 1.8–1.9 Cu(II)’s per molecule, consistent with one paramagnetic Cu in the TNC (in addition to the oxidized T1 Cu). The EPR parameters of the non- T1 Cu (g□ = 2.37, A□ = 82×10−4cm−1), are similar to those reported for the alternative resting form (Table 1). Interestingly, these features resemble those previously reported for a ‘Type 0’ Cu site, observed in mutationally modified T1 Cu from Azurin.13 Furthermore, the absorption spectrum, of the as-isolated BOD, shows no 330nm shoulder (Fig. S1, Supporting Information), again consistent with the alternative resting form (Table 1). To reduce the as-isolated BOD, dithionite was added in small increments, to anaerobic enzyme, with concomitant monitoring by EPR. This allowed for selective reduction of the T1 Cu (Fig. S2, Supporting Information), followed by reduction of the TNC EPR active Cu. This indicates that the EPR active TNC Cu has a significantly lower potential than that of the T1 Cu. Upon complete reduction, the BOD was exposed to dioxygen, which resulted in an immediate return of the blue color consistent with reoxidation of the enzyme. The TNC EPR features of the reoxidized resting enzyme are considerably different from those of the as-isolated form, as shown in Fig. 1 (red), with g□ = 2.24, A□ = 182×10−4cm−1, similar to the resting oxidized form of MCOs (Table 1). Also, the absorption spectrum of the reoxidized enzyme clearly shows the 330nm shoulder (Fig. S1, Supporting Information), indicating that all three TNC Cu’s have been oxidized. Importantly, when the reoxidized enzyme was exposed to Cl− ions, a known inhibitor of MCOs, and followed by EPR, regeneration of the alternative enzyme form was observed (Fig. S3, Supporting Information). It should be mentioned that we observed a similar conversion in commercially available Myrothecium verrucaria BOD (‘Amano 3’) from Amano Enzymes Inc. (Fig. S4, Supporting Information). Based on the above, BOD from M.oryzae, has two distinct resting forms, that can be interconverted: the resting oxidized form (1), generated upon reoxidation by O2 of fully reduced enzyme, and the alternative resting form (2), observed in the as-isolated enzyme, and upon Cl− addition to 1.
Figure 1.
EPR spectra of the as-isolated (black) and reoxidized (red) forms of M.oryzae BOD. TNC A□ features are indicated by vertical lines. T1 Cu features are similar in the two forms with g□ 2.22 and A□ ~83×10−4cm−1.
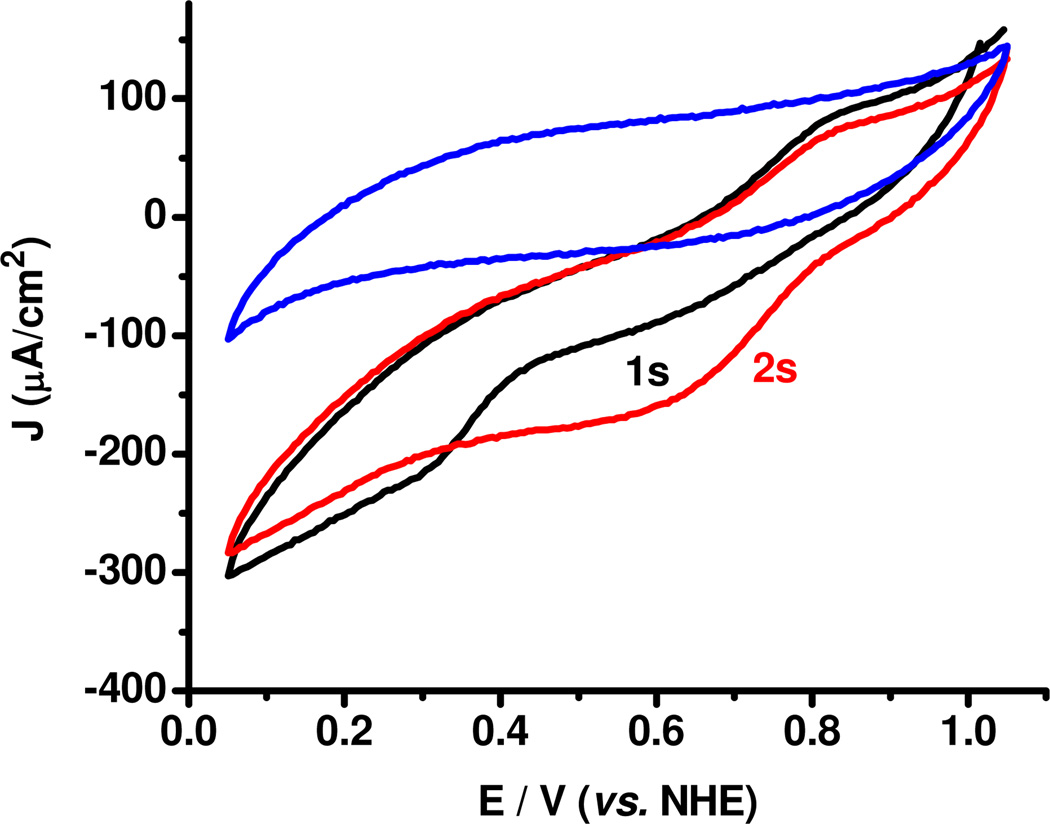
The electrochemical behaviors, in the presence of O2, of the two resting forms of the BOD, were investigated. 1 and 2, respectively were adsorbed on spectrographic graphite electrodes (SPGEs), and subsequently evaluated in air-saturated buffer by cyclic voltammetry. Fig. 2 shows the cyclic voltammograms (CVs) obtained with absorption of the as-isolated alternative form, 2. Compared to the background CV of a bare SPGE electrode (blue), significant catalytic current is observed, verifying activation of the enzyme by direct electron transfer (DET) from the electrode. Importantly, the CVs of the first (black) and second scan (red) are markedly different, with onset of catalytic current observed at ~+400mV (vs. NHE) in the first scan, shifting to ~+800mV in the second scan. A +800mV onset agrees with previous reports on immobilized BODs, where this was ascribed to DET to the T1 Cu.14 When the resting oxidized form, 1, is adsorbed, catalytic current is also observed (Fig. S5, Supporting Information). The onset in this case is at ~+800mV, thus coinciding with the onset of the catalytic current in the second (and subsequent) scan of 2. Therefore, the alternative form, 2, can be activated for O2 catalysis only at sufficiently low electrode potentials, consistent with the observation of a low potential TNC Cu (vide supra), whereas the resting oxidized form, 1, is activated at the much higher potential of the T1 Cu. Electrochemical interconversion of 1 and 2, similar to solution behavior was also investigated. Upon electrochemical activation of 2, followed by a resting period of several hours (i.e. no applied potential), the onset current was observed at ~+800mV (Fig. S6, Supporting Information). This strongly indicates that upon reductive activation, the alternative resting form, 2, of the enzyme is converted to the resting oxidized form, 1. Also, if an electrode with adsorbed activated enzyme (ie. resting oxidized), 1, is placed in NaCl buffer overnight, the CV shows a return of the low activation potential (Fig. S7, Supporting Information), consistent with the interconversion behavior observed in solution.
Figure 2.
CVs of a polished SPGE (blue) and first scan (black, 1s) and second scan (red, 2s) of the alternative resting form of M.oryzae BOD adsorbed on SPGE in air-saturated sodium phosphate buffer, pH 6, room temperature. Scan rate 5mV/s.
Activities of the two resting forms in solution were also explored, using 2,2'-azino-bis(3-ethylbenzothiazoline-6-sulphonic acid) (ABTS), a common MCO substrate showing a distinct absorption band upon one electron oxidation that can be followed spectrophotometrically. Under continuous turnover in air saturated phosphate buffer, the resting oxidized enzyme showed more than ten-fold higher activity than the alternative resting form (248 vs. 22 units/mg). This is consistent with the high redox potential (+650mV) of ABTS,15 again indicating that 2 can only be activated by a sufficiently low reductant (ie. dithionite), whereas 1 is activated by high potential substrates. The residual activity of 2 is ascribed to the presence of a small amount of 1.
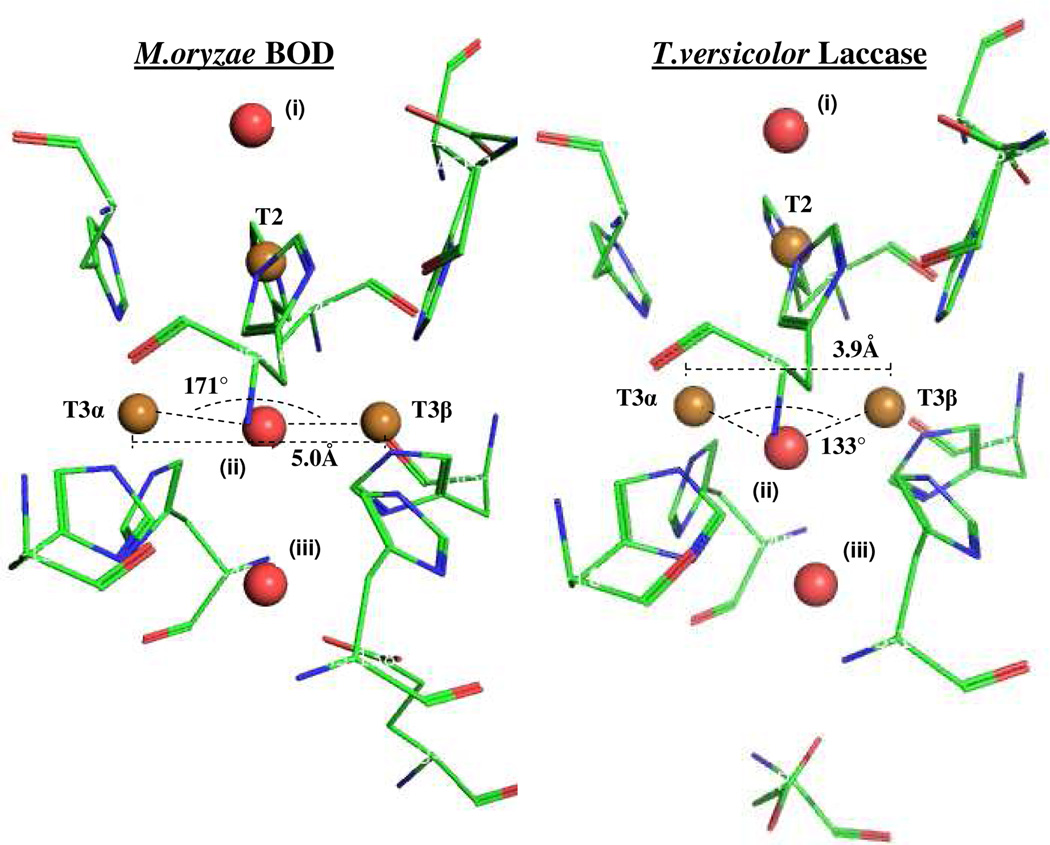
To further elucidate differences between the two resting forms of the BOD, we were able to obtain crystals of the as-isolated enzyme, grown for two days in pH 4.6 acetate buffer, pH-adjusted with HCl. In order to correlate the crystal structure to the spectroscopy, as-isolated (ie. alternative resting) enzyme, 2, was buffer exchanged into the crystallization buffer, and monitored by EPR over the same time period. After two days, this resulted in an EPR spectrum equivalent to that of 2 (Fig. S8, Supporting Information), verifying that the crystal structure corresponds to the alternative resting form of the enzyme. Under the crystal growth conditions, the resting oxidized form, 1, of the BOD, converts to the alternative resting form, 2. We are currently pursuing different conditions that may allow crystallization of 1 in BOD. Here, we focus on the structural differences between 1 and 2 of the TNC by comparing the crystal structure of M. oryzae BOD (Table S2, Supporting Information), 2, to the previously published structure of T. versicolor (1GYC)9b, 1. The correspondence of the TvL structure to 1 is validated by a. the equivalent spectroscopic features of the resting oxidized forms in M. oryzae BOD (described above) and TvL,16 b. the conservation of activity after X-ray exposure of TvL9b, and c. the fact that we found that Cl− does not convert form 1 to form 2 in TvL.17 Fig 3 depicts the geometric structures of the TNCs of BOD and TvL, both to resolutions of 1.9Å. Relevant first and second sphere residues are included in addition to the three Cu’s. Three oxygen atoms in undefined protonation states, are also included. Oxygen (i) is weakly coordinated to the T2 Cu, whereas oxygen (ii) is situated in between the two T3 Cu’s, in hydrogen bonding distance (Table S2, Supporting Information) to an additional oxygen (iii). It should be mentioned that although the crystallization buffer of the BOD includes chloride ions, no evidence of these was found at or near the TNC (Fig. S9, Supporting Information). As seen in Fig. 3, the overall motif of the TNCs is similar in the two enzymes forms. However, there are two highly important differences. First, the crystal structure of the BOD shows an almost linear T3 Cu-O-Cu angle (171°), in contrast to the 133° angle observed for TvL (Fig. 3, and Table S2, Supporting Information). Second, the distance between the two T3 Cu’s is 5.0Å in BOD, compared to only 3.9Å in TvL (Fig. 3, and Table S2, Supporting Information). A long Cu-Cu distance is in agreement with crystal structures of other BODs, where either one or two oxygen atoms are observed in similar positions as oxygen (ii). 7,11
Figure 3.
Pymol generated structures of TNCs in the alternative resting M.oryzae BOD, and the resting oxidized T.versicolor laccase (ATTC 20869) (pdb: 1GYC). Golden spheres represent Cu atoms and red spheres represent oxygen. T3 Cu-Cu distances and Cu-O-Cu angles are included.
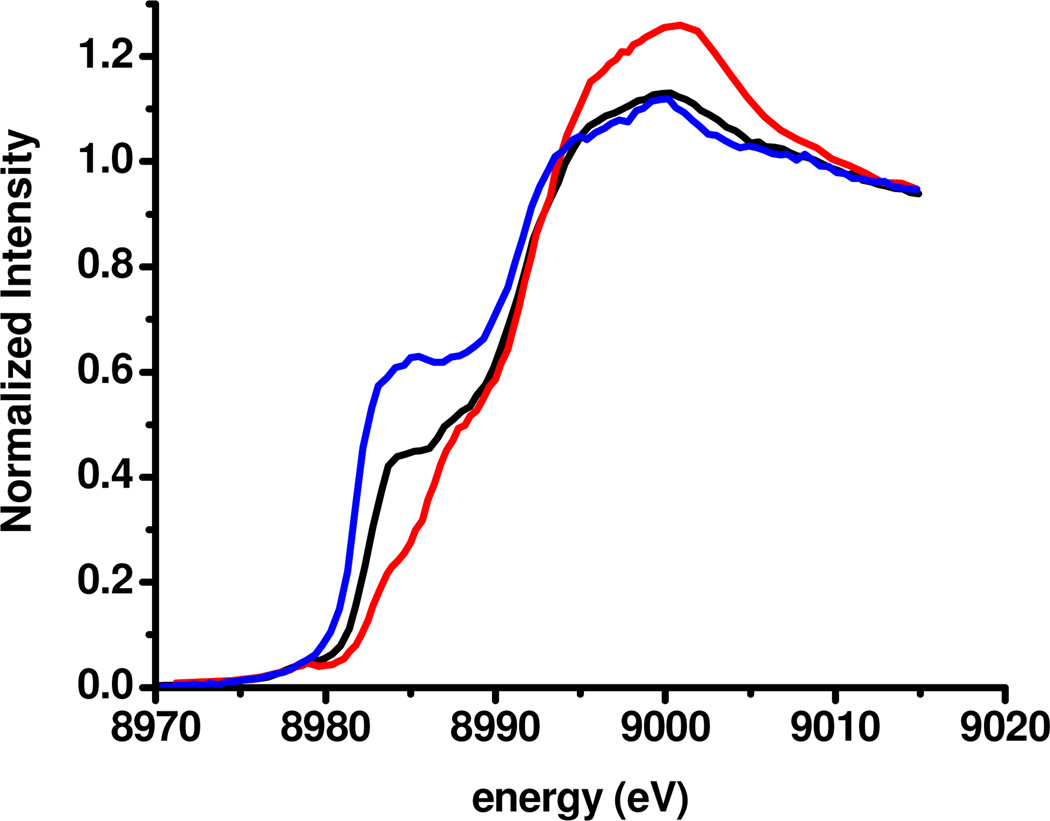
The origin of the activation, structural, and spectroscopical differences between these two resting forms, 1 and 2, was revealed by Cu K-edge X-ray Absorption Spectroscopy (XAS). Studies on copper containing model complexes have shown that Cu(I) has an intense transition at 8984eV, arising from excitation of a core electron from a Cu 1s to its 4p orbitals.18 This property has been invaluable in determining the redox states of intermediates in MCOs.19 Fig. 4 shows XAS spectra of the as-isolated alternative form (black), 2, and the resting oxidized form (red), 1, of M. oryzae BOD. For comparison, the spectrum of the fully reduced enzyme (blue) is also included. For 1, very little intensity is observed at 8984eV, consistent with the spectroscopic features of this site, indicating a fully oxidized enzyme. In contrast, 2 is observed to have significant intensity at 8984eV, approximately half of that observed for the fully reduced enzyme. This, complimented by EPR spin integration and the absence of a 330nm absorption shoulder, allow assignment of 2 to a 2x Cu(I), 1x Cu(II) TNC (with the T1 Cu oxidized). Importantly, when 2 is regenerated from 1, by the addition of Cl− ions (vide supra), the XAS edge spectrum is identical to that of as-isolated enzyme 2 (Fig. S10, Supporting Information), confirming the partially reduced redox state of the alternative resting form, 2. This redox state of 2 may be correlated with the long T3 Cu-Cu distance observed in the crystal structure (vide supra). Structures of MCOs obtained from either crystallography or computations, show significantly longer T3 Cu-Cu distances in the fully reduced, compared to the fully oxidized forms of the TNC.20
Figure 4.
Cu K-edge XAS spectra of as-isolated alternative resting (black), resting oxidized (red), and fully reduced (blue) forms of BOD from M.oryzae.
In summary, two forms of resting MCOs, resting oxidized and alternative resting, that can be interconverted, have been identified and characterized in the same BOD. The latter is responsible for an unusual TNC EPR signal, a long T3 Cu-Cu distance, and a low redox potential of a TNC Cu. Only the resting oxidized form, 1, is catalytically active under normal assay conditions, whereas the alternative form, 2, requires a low potential reductant to be fully reduced for O2 reactivity. This reflects the fact that the alternative form has a partially reduced TNC that is not capable of O2 reduction. This emphasizes the requirement for correct sequential reduction of resting MCO to the fully reduced enzyme, the origin of which is currently being investigated.
Supplementary Material
ACKNOWLEDGMENT
Portions of this research were carried out at the Stanford Synchrotron Radiation Lightsource, a Directorate of SLAC National Accelerator Laboratory and an Office of Science User Facility operated for the U.S. Department of Energy Office of Science by Stanford University. The SSRL Structural Molecular Biology Program is supported by the DOE Office of Biological and Environmental Research, and by the National Institutes of Health, National Center for Research Resources, Biomedical Technology Program. The contents of this publication are solely the responsibility of the authors and do not necessarily represent the official view of NCRR or NIH. We warmly thank Dr. Pierre Legrand and Andrew Thompson at SOLEIL for beamtime and their help during data collection on PROXIMA1 Beamline. We thank Amano Enzymes inc. for providing ‘Amano 3’. F. T. acknowledges the Swedish Chemical Society for financial support (Bengt Lundqvists Post Doc-stipendier 2010). C.H.K. is a Stanford Graduate Fellow.
Funding Sources
This work was supported by a European Young Investigator Award (EURYI), la Région Aquitaine, and by NIH Grants DK-31450 (E.I.S.) and RR-001209 (K.O.H).
ABBREVIATIONS
- ABTS
2,2’-azino-bis(3-ethylenebenzothiazoline-6-sulphonic acid)
- BOD
bilirubin oxidase
- CV
cyclic voltammogram
- DET
direct electron transfer
- EPR
Electron Paramagnetic Resonance
- MCO
multicopper oxidase
- NI
native intermediate
- PI
peroxy intermediate
- SPGE
spectrographic graphite electrode
- XAS
X-ray absorption spectroscopy
- TNC
trinuclear cluster
- T1/T2/T3
type 1/2/3
- TvL
Trametes versicolor laccase.
Footnotes
ASSOCIATED CONTENT
Experimental procedures, Supporting figures S1–S10, Supporting tables S1–S2 are all included. This material is available free of charge via the internet at http://pubs.acs.org.
REFERENCES
- 1.(a) Reinhammar B. Biochim. Biophys. Acta. 1970;205:35. doi: 10.1016/0005-2728(70)90059-9. [DOI] [PubMed] [Google Scholar]; (b) Outten FW, Huffman DL, Hale JA, O’Halloran TV. J. Biol. Chem. 2001;276:30670. doi: 10.1074/jbc.M104122200. [DOI] [PubMed] [Google Scholar]; (c) Kosman DJ, Hassett R, Yuan DS, McCracken J. J. Am. Chem. Soc. 1998;120:4037. [Google Scholar]; (d) Tanaka N, Murao S. Agric. Biol. Chem. 1985;49:1985. [Google Scholar]
- 2.Solomon EI, Sundaram UM, Machonkin TE. Chem. Rev. 1996;96:2563. doi: 10.1021/cr950046o. [DOI] [PubMed] [Google Scholar]
- 3.(a) Allendorf MD, Spira DJ, Solomon EI. Proc. Natl. Acad. Sci. 1985;82:3063. doi: 10.1073/pnas.82.10.3063. [DOI] [PMC free article] [PubMed] [Google Scholar]; (b) Spira-Solomon DJ, Allendorf MD, Solomon EI. J. Am. Chem. Soc. 1986;108:5318. [Google Scholar]
- 4.(a) Kroneck PMH, Armstrong FA, Merkle H, Marchesini A. In: Ascorbic Acid: Chemistry, Metabolism, and Uses. Seib PA, Tolbert BM, editors. Vol. 200. Washington DC: 1982. pp. 223–248. [Google Scholar]; (b) Fee JA, Malmstrom BG. Biochim. Biophys. Acta. 1968;153:299. doi: 10.1016/0005-2728(68)90175-8. [DOI] [PubMed] [Google Scholar]
- 5.Cole JL, Tan GO, Hodgson KO, Solomon EI. J. Am. Chem. Soc. 1990;112:2243. [Google Scholar]
- 6.Solomon EI, Augustine AJ, Yoon J. Dalton Trans. 2008;30:3921. doi: 10.1039/b800799c. [DOI] [PMC free article] [PubMed] [Google Scholar]
- 7.Bento I, Silva CS, Chen Z, Martins LO, Lindley PF, Soares CM. BMC Struct. Biol. 2010;10:28. doi: 10.1186/1472-6807-10-28. [DOI] [PMC free article] [PubMed] [Google Scholar]
- 8.Andreasson L-E, Bränden R, Reinhammar B. Biochim. Biophys. Acta. 1976;438:370. doi: 10.1016/0005-2744(76)90254-0. [DOI] [PubMed] [Google Scholar]
- 9.(a) Messerschmidt A, Ladenstein R, Huber R. J. Mol. Biol. 1992;224:179. doi: 10.1016/0022-2836(92)90583-6. [DOI] [PubMed] [Google Scholar]; (b) Piontek K, Antorini M, Choinowski T. J. Biol. Chem. 2002;277:37663. doi: 10.1074/jbc.M204571200. [DOI] [PubMed] [Google Scholar]
- 10.(a) Shimizu A, Kwon J-H, Sasaki T, Satoh T, Sakurai N, Sakurai T, Yamaguchi S, Samejima T. Biochemistry. 1999;38:3034. doi: 10.1021/bi9819531. [DOI] [PubMed] [Google Scholar]; (b) Martins LO, Soares CM, Pereira MM, Teixeira M, Costa T, Jones GH, Henriques AO. J. Biol. Chem. 2002;277:18849. doi: 10.1074/jbc.M200827200. [DOI] [PubMed] [Google Scholar]
- 11.Mizutani K, Toyada M, Sagara K, Takahashi N, Sato A, Kamitaka Y, Tsujimura S, Nakanishi Y, Sugiura T, Yamaguchi S, Kano K, Mikami B. Acta. Cryst. 2010:F66–765. doi: 10.1107/S1744309110018828. [DOI] [PMC free article] [PubMed] [Google Scholar]
- 12.Durand F, Gounel S, Kjaergaard CH, Solomon EI, Mano N. Applied Microb. Biotech. doi: 10.1007/s00253-012-3926-2. [DOI] [PMC free article] [PubMed] [Google Scholar]
- 13.Lancaster KM, George SD, Yokoyama K, Richards JH, Gray HB. Nat. Chem. 2009;1:711. doi: 10.1038/nchem.412. [DOI] [PMC free article] [PubMed] [Google Scholar]
- 14.(a) Ramirez P, Mano N, Andreu R, Ruzgas T, Heller A, Gorton L, Shleev S. Biochim. Biophys. Acta. 2008;1777:1364. doi: 10.1016/j.bbabio.2008.06.010. [DOI] [PubMed] [Google Scholar]; (b) Santos L, Climent V, Blanford CF, Armstrong FA. Phys. Chem. Chem. Phys. 2010;12:13962. doi: 10.1039/c0cp00018c. [DOI] [PubMed] [Google Scholar]
- 15.Bourbonnais R, Leech D, Paice MG. Biochim. Biophys. Acta. 1998;379:381. doi: 10.1016/s0304-4165(97)00117-7. [DOI] [PubMed] [Google Scholar]
- 16.(a) Malkin R, Malmstrom BG, Vanngard T. Eur. J. Biochem. 1969;7:253. doi: 10.1111/j.1432-1033.1969.tb19600.x. [DOI] [PubMed] [Google Scholar]; (b) Malkin R, Malmstrom BG, Vanngard T. Eur. J. Biochem. 1969;10:324. doi: 10.1111/j.1432-1033.1969.tb00693.x. [DOI] [PubMed] [Google Scholar]
- 17.Kjaergaard CH, Solomon EI. unpublished results [Google Scholar]
- 18.Kau L-S, Spira-Solomon DJ, Penner-Hahn JE, Hodgson KO, Solomon EI. J. Am. Chem. Soc. 1987;109:6433. [Google Scholar]
- 19.(a) Shin W, Sundaram UM, Cole JL, Zhang HH, Hedman B, Hodgson KO, Solomon EI. J. Am. Chem. Soc. 1996;118:3202. [Google Scholar]; (b) Lee S-K, George SD, Antholine WE, Hedman B, Hodgson KO, Solomon EI. J. Am. Chem. Soc. 2002;124:6180. doi: 10.1021/ja0114052. [DOI] [PubMed] [Google Scholar]
- 20.(a) Messerschmidt A, Luecke H, Huber R. J. Mol. Biol. 1993;230:997. doi: 10.1006/jmbi.1993.1215. [DOI] [PubMed] [Google Scholar]; (b) Taylor AB, Stoj CS, Ziegler L, Kosman DJ, Hart PJ. Natl. Acad. Sci. 2005;102:15459. doi: 10.1073/pnas.0506227102. [DOI] [PMC free article] [PubMed] [Google Scholar]; (c) Yoon J, Solomon EI. J. Am. Chem. Soc. 2007;129:13127. doi: 10.1021/ja073947a. [DOI] [PMC free article] [PubMed] [Google Scholar]
Associated Data
This section collects any data citations, data availability statements, or supplementary materials included in this article.


