

Abstract
AMP-activated protein kinase (AMPK) enhances glucose transporter GLUT4 regulation. AMPK also suppresses energy-consuming pathways such as cholesterol synthesis. Interestingly, recent in vitro and in vivo data suggest that excess membrane cholesterol impairs GLUT4 regulation. Therefore, this study tested whether a beneficial, GLUT4-regulatory aspect of AMPK stimulation involved cholesterol lowering. Using L6 myotubes stably expressing an exofacial myc-epitope-tagged-GLUT4, AMPK stimulation by 5-aminoimidazole-4-carboxamide-1-β-d-ribonucleoside (AICAR; 45 min, 1 mm) or 2,4-dinitrophenol (DNP; 30 min, 200 μm) increased cell surface GLUT4myc labeling by approximately ∼25% (P < 0.05). Insulin (20 min, 100 nm) also increased GLUT4myc labeling by about 50% (P < 0.05), which was further enhanced (∼25%, P < 0.05) by AICAR or DNP. Consistent with AMPK-mediated suppression of cholesterol synthesis, AICAR and DNP decreased membrane cholesterol by 20–25% (P < 0.05). Whereas AMPK knockdown prevented the enhanced basal and insulin-stimulated GLUT4myc labeling by AICAR and DNP, cholesterol replenishment only blocked the AMPK-associated enhancement in insulin action. Cells cultured in a hyperinsulinemic milieu, resembling conditions in vivo that promote the progression/worsening of insulin resistance, displayed an increase in membrane cholesterol. This occurred concomitantly with a loss of cortical filamentous actin (F-actin) and defects in GLUT4 regulation by insulin. These derangements were prevented by AMPK stimulation. Examination of skeletal muscle from insulin-resistant Zucker rats revealed a similar elevation in membrane cholesterol and loss of F-actin. Lowering cholesterol to control levels restored F-actin structure and insulin sensitivity. In conclusion, these data suggest a novel aspect of GLUT4 regulation by AMPK involves membrane cholesterol lowering. Moreover, this AMPK-mediated process protected against hyperinsulinemia-induced insulin resistance.
AMP-activated protein kinase (AMPK) plays several beneficial roles in the regulation of skeletal muscle glucose, lipid, and protein metabolism (1). One physiological process that AMPK activity promotes in skeletal muscle is glucose transport. This occurs in the absence of insulin and also by the regulation of the insulin-responsive glucose transporter, GLUT4. Data support that AMPK inhibits the Rab-GTPase-activating proteins AS160 (TBC1D4) and TBC1D1, and this triggers GLUT4 trafficking to the plasma membrane (1). Insulin stimulation of this same process entails a well-characterized AMPK-independent phosphorylation/inhibition of AS160 and TBC1D1 by Akt (2). Several new studies have suggested signal specificity occurs via site-specific phosphorylation of AS160 and TBC1D1 (3–5).
Another important aspect of AMPK functionality, which likely influences GLUT4 regulation, is its concomitant inactivation of energy-consuming pathways such as fatty acid and cholesterol synthesis. Although it is well established that excess fatty acids (6) and, more recently, excess plasma membrane cholesterol (7) impair GLUT4 regulation by insulin, few studies have addressed whether an aspect of GLUT4 regulation by AMPK is lipid based. Whereas fatty acids are well recognized to impair the transduction of proximal insulin signals to GLUT4, excess plasma membrane cholesterol does not seem to affect proximal insulin signaling, but rather disrupts cortical filamentous actin (F-actin) structure essential for GLUT4 translocation (7). An emerging hypothesis is that membrane cholesterol toxicity may represent an early event in the development of skeletal muscle insulin resistance (2, 7). Regardless of whether or not this is the case, there is evidence that plasma membrane cholesterol lowering increases cell surface levels of GLUT4 and enhances insulin sensitivity in a fashion resembling the effect of AMPK stimulation (8–10).
Interestingly, moderate increases in plasma membrane fluidity, which would be an expected outcome of cholesterol lowering, also has been documented to increase glucose transport (11, 12). Consistent with membrane fluidity influencing insulin responsiveness, insulin-stimulated glucose transport is decreased when fluidity diminishes (12). Furthermore, it has been shown that basal glucose transport is not fully active in cells and that it can be increased further by augmenting membrane fluidity (11). In that regard, metformin, a widely used medication for individuals with type 2 diabetes, has been found to enhance insulin action by increasing membrane fluidity (13, 14). More recently the antidiabetic activity of chromium has been linked to plasma membrane cholesterol lowering that amplifies insulin-regulated GLUT4-mediated glucose transport (9, 10). Similarly to metformin (15), chromium has been found to stimulate AMPK (9, 16–18).
Mechanistically, it is of interest that 3-hydroxy-3-methylglutaryl coenzyme A reductase (HMGR), a rate-limiting enzyme in cholesterol synthesis, is inactivated by AMPK. Also, multiple lines of evidence indicate that AMPK activation suppresses the activity of sterol-regulatory element-binding proteins (SREBP) that are major transcription factors activating the expression of genes involved in biosynthesis of cholesterol, fatty acids, and triglycerides (15, 19). As such, suppression of both HMGR and SREBP by AMPK would be predicted to lower membrane cholesterol and enhance GLUT4 regulation. In support of this possibility, inhibition of SREBP was found to ameliorate diet-induced cholesterol/lipid tissue accrual and insulin resistance (20). In the present study, we investigated the effect of increased AMPK activity on membrane cholesterol and GLUT4 regulation in rat L6 myotubes. We also examined whether AMPK stimulation in L6 myotubes could protect against hyperinsulinemia-induced increases in membrane cholesterol that compromise cortical F-actin structure and GLUT4 regulation in 3T3-L1 adipocytes (21).
Materials and Methods
Cell culture and treatments
Rat L6 muscle cells stably expressing GLUT4 with an exofacial myc-epitope (L6-GLUT4myc) generously obtained from Dr. Amira Klip (The Hospital for Sick Children, Toronto, Ontario, Canada), were cultured as previously described (22). Myoblasts were maintained in α-MEM containing 5.5 mm glucose (Life Technologies, Inc., Gaithersburg, MD) and 10% fetal bovine serum (FBS; HyClone Laboratories, Logan, UT), and differentiated into multinucleated myotubes with 2% FBS. All studies used myotubes between 4 d and 6 d after initiation of differentiation. Cells were serum starved for 30 min before all experiments. Note longer serum starvation periods we tested did not enhance the characteristic low response (1.5- to 2.0-fold) of this cell line to insulin. Cells were then left untreated or treated with 1 mm 5-aminoimidazole-4-carboxamide-1-β-d-ribonucleoside (AICAR) for 45 min or 200 μm 2,4-dinitrophenol (DNP) for 30 min. During the final 20 min (or 5 min for insulin-signaling analyses) of these incubations, cells were left in either the basal state or were acutely stimulated with 100 nm insulin. In a subset of experiments, insulin induction of insulin resistance was performed as previously described (22) by treating the cells with 5 nm insulin for 12 h.
Animals
Specific pathogen-free obese (fa/fa) and lean (Fa/?) female Zucker rats were obtained from Harlan Teklad (Madison, WI) at 6 wk of age. Upon arrival, rats were housed individually in a temperature-controlled animal room maintained on a 12-h light, 12-h dark cycle. The rats were fed ad libitum NIH standard chow and water. All in vivo procedures performed were based on protocols approved by the Eli Lilly Institutional Animal Care and Use Committee.
ATP measurement
Intracellular ATP content was measured using a luminescence ATP detection assay system (ATPlite; PerkinElmer Inc., Wellesley, MA). Briefly, after experimental treatments, L6 myotubes were lysed using a mammalian cell lysis buffer which inactivates endogenous ATPase. Subsequently, whole-cell lysate was incubated with substrate buffer and luminescence was detected using the SpectraMax M2 (Molecular Devices, Sunnyvale, CA). Luminescence was converted to actual ATP concentration (nanomolar) by use of an ATP standard curve. ATP concentrations were normalized for protein concentration determined by the Bradford method.
Immunocytochemistry
Myotube GLUT4myc and F-actin labeling was performed as previously described (22). Briefly, myotubes were fixed with 2% paraformaldehyde/PBS. After fixation, cells were either left unpermeabilized (GLUT4myc) or were permeabilized (F-actin) for 15 min at room temperature in 0.2% Triton X-100/PBS and blocked in Odyssey Blocking Buffer (LI-COR Biosciences, Lincoln, NE). The samples were then incubated in primary antibody overnight, washed, and incubated with an infrared-conjugated secondary antibody (LI-COR) or with 1:50 fluorescein isothiocyanate-conjugated antimouse (confocal) for 1 h. Images were collected and quantified with the Odyssey system as previously described (22). Immunofluorescent intensity was normalized to intensity from Syto60, a fluorescent nucleic acid stain (Molecular Probes). Skeletal muscle was prepared and labeled as previously described (22, 23). Briefly, after 2 wk of acclimation, rats in the postprandial state were anesthetized with 5 mg/100 g body weight sodium pentobarbital, and the epitrochlearis muscles were dissected out, blotted on gauze, quickly rinsed in saline, and immersed in 4% paraformaldehyde/PBS. Both epitrochlearis muscles from five lean and five obese rats were used, for a total of 10 muscles. Myotube and skeletal muscle images were obtained using the Zeiss LSM 510 NLO Confocal Microscope (Carl Zeiss, Thornwood, NY). For confocal imaging, all microscopic and camera settings were identical within experiments, and representative images are shown.
Membrane and cholesterol analyses
A plasma membrane-enriched fraction was prepared as described by Khayat et al. (24). Briefly, myotube monolayers grown on 10-cm diameter dishes were gently scraped with a rubber policeman in 5 ml of ice-cold homogenization buffer (in mm concentration: 250 sucrose, 20 HEPES, 2 EGTA, and 3 NaN3; pH 7.4) containing freshly added protease inhibitors (in μm: 200 phenylmethylsulfonylfluoride, 1 leupeptin, and 1 pepstatin A) and homogenized through a 22-gauge needle 10 times. The homogenate was centrifuged at 760 × g for 5 min at 4 C, and the resultant supernatant was centrifuged at 31,000 × g for 20 min to separate a plasma membrane-enriched pellet from an intracellular microsome supernatant. The plasma membrane pellet was resuspended in homogenization buffer and assayed for protein (Bradford) and cholesterol (Amplex Red) content as previously described (9). Several unpublished analyses that we have performed revealed that measured changes in plasma membrane cholesterol were similarly reflected in total cellular membrane fractions prepared by centrifuging the original cellular homogenate at 5,000 × g for 20 min at 4 C and then subjecting the supernatant to centrifugation at 100,000 × g for 30 min. Because the number of 10-cm diameter dishes required to obtain this total membrane fraction was half that required to prepare plasma membrane-enriched fractions, we used total membrane fractions in the current study.
The preparation of methyl-β-cyclodextrin (βCD)-cholesterol complex to experimentally replenish membrane cholesterol content was performed as previously described (8). Briefly, 96.7 μl of cholesterol from 5 mg/ml stock in chloroform-methanol (1:1, vol/vol) was added to a glass tube. The solvent was evaporated under a gentle stream of nitrogen gas, and a dried cholesterol film was formed on the bottom of the tube. Next, 10 ml of 1 mm βCD were added, vortexed, and sonicated (bath sonicator). This 100% saturated βCD-cholesterol solution was incubated in a 37 C water bath for 48 h with vigorous shaking. This mixed solution was then filtered through a 0.45-μm syringe filter (Millipore Corp., Bedford, MA) before use. In the cholesterol replenishment experiments, during the 30-min serum starvation period, cells were preincubated with this solution before treatments with AICAR, DNP, and/or insulin. All treatments were performed during continual exposure to the βCD-cholesterol solution.
SDS-PAGE analyses
Total cell extracts were prepared from 10-cm diameter dishes. Myotubes were washed two times with ice-cold PBS and scraped into 1 ml lysis buffer (25 mm Tris, pH 7.4; 50 mm NaF; 10 mm Na3P2O7; 137 mm NaCl; 10% glycerol; and 1% Nonidet P-40) containing 2 mm phenylmethylsulfonylfluoride, 2 mm Na3VO4, 5 μg/ml aprotinin, 10 μm leupeptin, and 1 μm pepstatin A and then rotated for 15 min at 4 C. Insoluble material was separated by centrifugation for 15 min at 4 C. Protein concentrations were determined via the Bradford method, and equivalent protein amounts were separated by 7.5% SDS-PAGE. The resolved fractions were transferred to nitrocellulose (Bio-Rad Laboratories, Inc., Hercules, CA). Phospho-Akt-2 was detected with anti-phospho-Akt-2 (Ser474) (Genscript Corp., Piscataway, NJ). Phospho-insulin receptor and insulin receptor substrate (IRS)-1 were detected with a monoclonal phosphotyrosine antibody (PY20; Transduction Laboratories, Lexington, KY). We also used phosphospecific antibodies to AMPK and AS160 (Cell Signaling Technology, Danvers, MA) and to HMGR and ACC (Millipore Corp.). Equal protein loading was confirmed by Ponceau staining and by immunoblot analysis with anti-ACC, anti-AMPK (Cell Signaling Technology), and anti-Actin antibody (Cytoskeleton, Denver, CO). All immunoblots were labeled with insulin receptor-conjugated secondary antibodies and analyzed via the Odyssey system (LI-COR Biosciences, Lincoln, NE).
Small interfering RNA (siRNA) design and transfection
Three independent oligonuceotide sequences, designed and purchased from Ambion (Austin, TX), were tested for each of the two α-subunit isoforms. The oligonucleotides with the highest knockdown efficiency for α1 and α2 were, respectively: CGA GUU GAC UGG ACA UAA Att (siRNA identification no.: 194424) and GCA ACU AUC AAA GAC AUA Ctt (siRNA identification no.: 194794). Because these cells express both α-isoforms, the combination of the two nucleotides led to the greatest knockdown efficiency. Ambion's Negative Control no. 1 siRNA (catalog no. 4635) was used as a control in all experiments. For all knockdown experiments cells were seeded as described previously. Cells were first transfected at approximately 48 h after seeding (or ∼60% confluency). Calcium phosphate transfection protocol was used as follows. siRNA (60 pmol) was added to siRNA mix: 15 μl ddH2O, 15 μl Buffer A [0.5 m CaCl2, 0.1 m HEPES (pH 7.0)], and 30 μl Buffer B [0.28 m NaCl, 0.75 mm NaH2PO4, 0.75 mm Na2HPO4, 0.05 m HEPES (pH 7.0)] and after 10 min at room temperature, the siRNA mix was added to each well of a 12-well plate containing 600 μl DMEM + 5% FBS and incubated 12–16 h. After 12–16 h incubation, media were aspirated and replaced with DMEM + 2% FBS. An additional transfection was repeated 72 h after the initial transfection. Cells were treated and assayed 72 h after the final transfection.
Glucose transport assays
Rats in the postprandial state were anesthetized with 5 mg/100 g body weight sodium pentobarbital. Soleus muscles were dissected out, blotted on gauze, and transferred to 25-ml Erlenmeyer flasks containing 2 ml of Krebs-Henseleit buffer with 0.1% BSA, 32 mm mannitol, and 8 mm glucose. The flasks were incubated in a shaking water bath maintained at 30 C for 1 h and were continually gassed with 95% CO2. Muscles were initially incubated in the presence or absence of βCD (2.5 mm) for 60 min before incubation under basal conditions (no additions), or stimulation with insulin (13.3 nm). The muscles were then transferred to flasks containing 2 ml of Krebs-Henseleit buffer with 0.1% BSA, 40 mm mannitol, 2 mm pyruvate, and the same additions as in the previous incubation, and then used for measurement of glucose transport as previously described (23).
Statistics
All values are presented as means ± se. The significance of differences between means was evaluated by one-way repeated measures ANOVA. Where differences among groups were indicated, the Newman-Keuls test was used for post hoc comparison between groups. Differences between two groups were analyzed by Student's t test for independent samples. GraphPad Prism 4 software (GraphPad Software, Inc., San Diego, CA) was used for all analyses. P < 0.05 was considered significant.
Results
AMPK activation in L6 myotubes
Treatment of L6-GLUT4myc myotubes with AICAR (1 mm, 45 min) or DNP (200 μm, 30 min) resulted in an increase in AMPK Thr172 phosphorylation (Fig. 1A), an event characteristic of increased kinase activity. Consistent with this surrogate of increased activity (25); the phosphorylation of acetylcoenzyme A carboxylase (ACC) Ser79, a well-characterized phosphorylation target of AMPK, was increased by the AICAR and DNP treatments (Fig. 1B). Use of an antibody that recognizes HMGR when phosphorylated on Ser872 also suggested that AICAR and DNP induced phosphorylation of this target, but the intensity of the bands detected was too faint for accurate analysis. In line with AICAR and DNP stimulating AMPK Thr172 phosphorylation via an ATP-independent [i.e. AICAR conversion to the 5′-AMP analog ZMP] and an ATP-dependent mechanism [i.e. mitochondrial uncoupling that prevents cellular production of ATP], respectively, intracellular ATP levels were unchanged by AICAR, yet decreased 40% after DNP treatment (see Supplemental Fig. 1 published on The Endocrine Society's Journals Online web site at http://endo.endojournals.org).
Fig. 1.
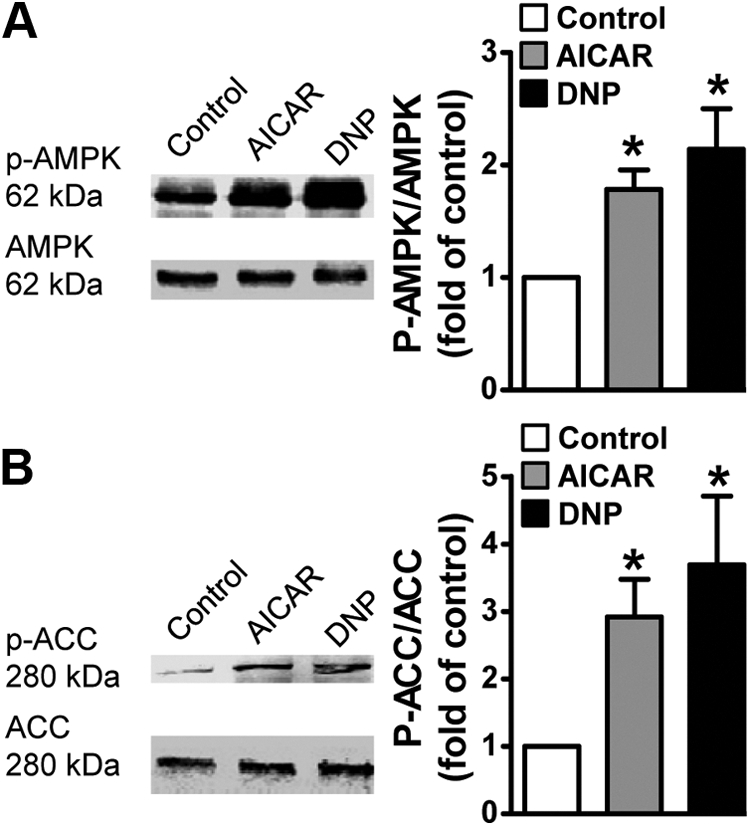
AMPK activation in L6 myotubes. Myotubes were left untreated or treated with AICAR (1 mm, 45 min) or DNP (200 μm, 30 min). Total cell extracts were prepared, and protein concentrations were determined by the Bradford method. Equivalent protein amounts were separated by 7.5% SDS-PAGE. The resolved fractions were transferred to nitrocellulose, and immunoblot analyses were performed using anti-phospho-AMPK and anti-pan-AMPK (A) and anti-phospho-ACC and anti-pan-ACC antibodies (B). Quantification of these analyses represent the ratio of immunoblot band intensities detected with antiphosphorylation antibodies [i.e. α-pAMPK, α-pACC] to that measured with specific protein antibodies [i.e. α-AMPK, α-ACC]. Values are means ± se of six to 12 independent experiments, *, P < 0.05 vs. control group.
AMPK signaling enhances basal and insulin-stimulated cell surface GLUT4 levels
We next measured cell surface GLUT4 levels under the various treatment conditions using the L6-GLUT4myc cell system. In this modified cell line the tagged transporter segregates, cycles, and responds to insulin similarly to endogenous GLUT4 (26, 27). As shown in Fig. 2A (panels 1 and 2), acute insulin stimulation of control cells resulted in increased immunological labeling of the myc-epitope at the surface of intact cells. Red fluorescent costaining of nucleic acids with Syto60 was employed to verify the presence of cells and to normalize the myc signal in quantitative cell population-based analyses using the LI-COR imaging system (Fig. 2B). Acute AICAR and DNP treatments of control cells increased basal surface GLUT4myc labeling (Fig. 2, A and B; compare panels and bars 1, 3, and 5). In addition, these treatments resulted in a further increase in insulin-stimulated plasma membrane GLUT4 accumulation (Fig. 2, A and B; compare panels and bars 2, 4, and 6). The combined responses to insulin and AMPK activation, leading to an increased plasma membrane GLUT4myc of approximately 20% above that observed for insulin alone, is consistent with recent kinetic analysis of GLUT4 regulation (28). Also as documented by others (24, 28), the AMPK-stimulated gain of plasma membrane GLUT4 in the absence or presence of insulin was not associated with phosphorylation/activation of key insulin-signaling molecules such as the insulin receptor substrate-1 (IRS-1) and Akt2 (Fig. 3A). In addition, an AICAR- or DNP-induced increase in the phosphorylation of AS160 was not observed (Fig. 3B, bars 1, 3, and 5), and these stimuli did not affect the insulin-stimulated phosphorylation of AS160 (Fig. 3B, bars 2, 4, and 6).
Fig. 2.

AMPK activation increases plasma membrane GLUT4. Myotubes were left untreated or treated with AICAR (1 mm, 45 min) or DNP (200 μm, 30 min) in the absence (basal, panels and bars 1, 3, and 5) or presence (insulin, panels and bars 2, 4, and 6) of acute insulin stimulation (100 nm, 20 min). After treatment, cells were fixed and left unpermeabilized. The samples were then labeled with anti-myc antibody, washed, and incubated with an infrared-conjugated secondary antibody (LI-COR) or with fluorescein isothiocyanate -conjugated antimouse (confocal). Immunofluorescent intensity was normalized to intensity from Syto60, a fluorescent nucleic acid stain. Images were collected and quantified with the Odyssey system. Representative α-myc immunofluorescent and Syto60 staining images of treated myotubes are shown (A). Values are means ± se of α-myc/Syto 60 signal quantification from 20–40 independent experiments (B). *, P < 0.05 vs. control-basal group; #, P < 0.05 vs. control-insulin group.
Fig. 3.
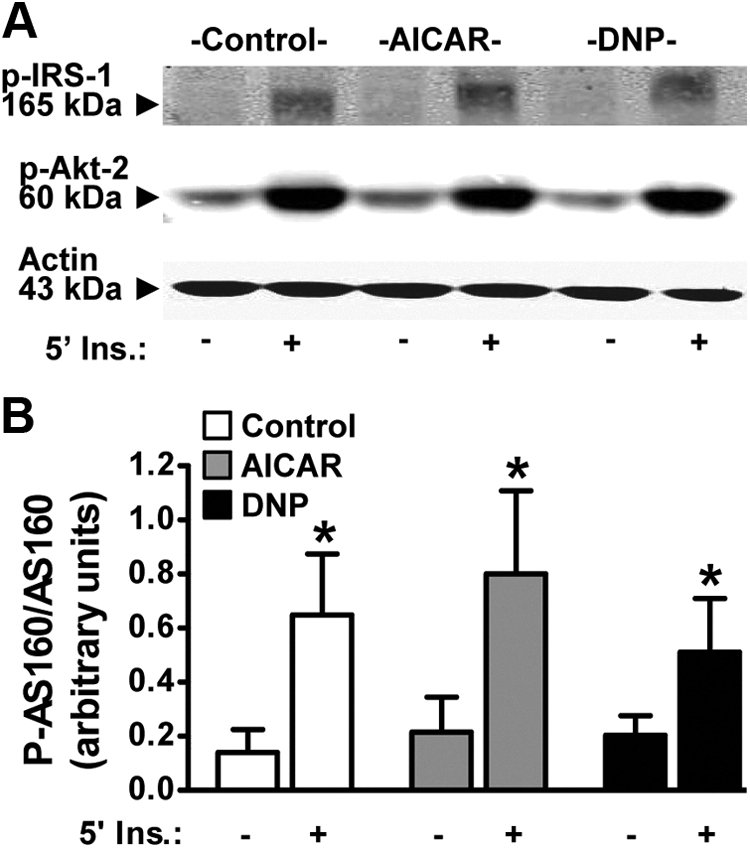
AMPK acts independently of insulin. Myotubes were left untreated or treated with AICAR (1 mm, 45 min) or DNP (200 μm, 30 min) in the absence (basal, panels and bars 1, 3, and 5) or presence (insulin, panels and bars 2, 4, and 6) of acute insulin stimulation (100 nm, 5 min). Total cell extracts were prepared and protein concentrations were determined via the Bradford method. Equivalent protein amounts were separated by 7.5% SDS-PAGE. The resolved fractions were transferred to nitrocellulose, and immunoblot analyses were performed using phospho-IRS-1 and phospho-Akt2 (A) and phospho-AS160 (B) antibodies. Equal protein loading was confirmed by Ponceau staining and by immunoblot analysis with anti-actin antibody. Representative immunoblots are shown from three to six independent experiments (A). Quantification of these analyses represent the ratio of immunoblot band intensities detected with antiphosphorylation antibody [i.e. α-pAS160] to that measured with specific protein antibody [i.e. α-AS160]. Values presented in panel B are means ± se from six independent experiments. *, P < 0.05 vs. control-basal group. Ins., Insulin.
AICAR- and DNP-treated L6 myotubes display a loss in membrane cholesterol
Concomitant to their effects on GLUT4 trafficking, both AICAR and DNP acutely elicited a 20–25% decrease in membrane cholesterol (Fig. 4A; compare bars 1–3). This induced loss of membrane cholesterol prompted us to ask whether that contributed to the regulation of GLUT4 by AICAR and/or DNP. Here we used methyl-β-cyclodextrin (βCD) to replenish the depleted membrane cholesterol induced by AICAR and DNP. As seen in Fig. 4B, the AICAR- and DNP-induced loss of membrane cholesterol was prevented with βCD preloaded with cholesterol (βCD:Chol). This cholesterol replenishment was found to mitigate AICAR- and DNP-enhanced insulin-stimulated plasma membrane GLUT4myc labeling (Fig. 4, C and D; compare bars 2, 4, 6, and 8). Interestingly, the basal increase in plasma membrane GLUT4myc induced by AICAR and DNP was not prevented by the βCD:Chol (Fig. 4, C and D; compare bars 1, 3, 5, and 7). The βCD:Chol treatment did not increase membrane cholesterol levels compared with control (Fig. 4B) or affect basal or insulin-stimulated plasma membrane GLUT4myc levels (Fig. 4, C and D; compare bars 1, 2, 5, and 6). These data suggest that the action of AICAR and DNP on mobilizing GLUT4 to the cell surface results from a cholesterol-independent mechanism; whereas membrane cholesterol lowering by AICAR and DNP contributes to the enhancement of insulin regulation of the transporter.
Fig. 4.
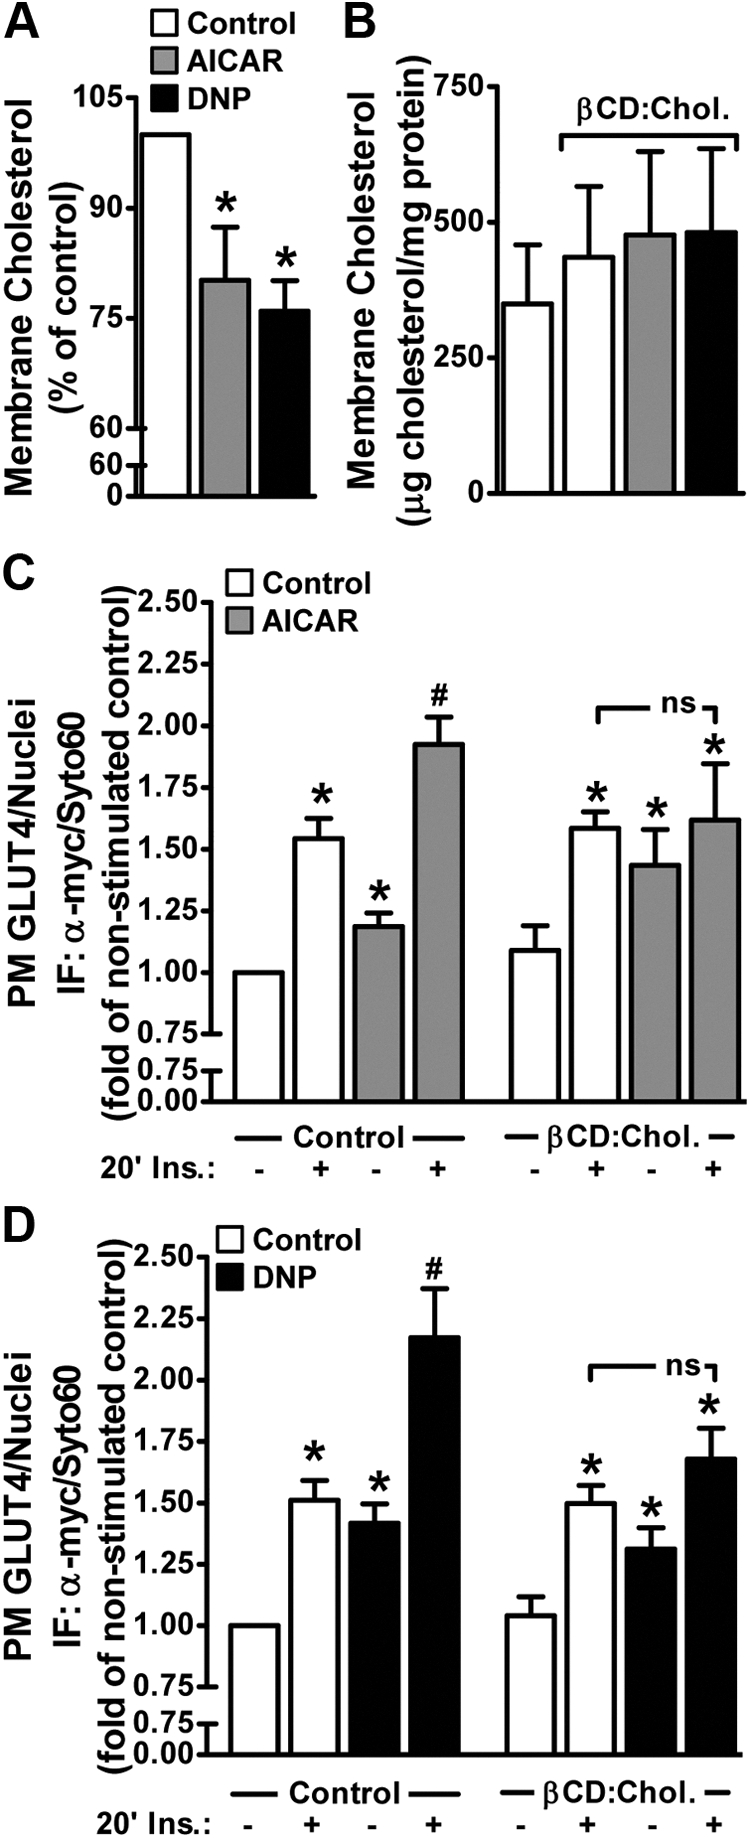
AMPK activation decreases membrane cholesterol, and AMPK-enhanced insulin action is cholesterol dependent. Myotubes were left untreated or treated with AICAR (1 mm, 45 min) or DNP (200 μm, 30 min) in the absence or presence of exogenous cholesterol (βCD:Chol, 45 min). A plasma membrane-enriched fraction was prepared as described in Materials and Methods. Membrane cholesterol contents (A and B) were determined by the Amplex Red cholesterol assay and normalized to protein content determined by the Bradford method. Basal and insulin-stimulated (100 nm, 20 min) plasma membrane GLUT4 contents (C and D) were determined in myotubes treated as described in Fig. 2. Values are means ± se of nine to 13 independent experiments. *, P < 0.05 vs. control (or control-basal) groups; #, P < 0.05 vs. control-insulin group. ns, nonsignificant
AMPK mediates cholesterol-dependent and independent regulation of GLUT4
We next tested the effect of siRNA-mediated knockdown of the catalytic α-subunits of AMPK on the ability of AICAR and DNP to lower membrane cholesterol and modulate GLUT4 regulation. Because these cells express α1 and α2 isoforms of AMPK, oligonucleotides against both isoforms were used simultaneously for knockdown. The combination of α1 and α2 isoform-specific oligonucleotides reduced the detectable pan-AMPKα protein by 90% (Fig. 5A). This reduction in AMPKα was associated with an ablation of DNP-stimulated membrane cholesterol lowering compared with control cells transfected with scramble oligos (Fig. 5B). Consistent with increased AMPK activity regulating basal and insulin-stimulated GLUT4 translocation, DNP treatment of AMPKα-deficient cells did not increase basal or insulin-stimulated plasma membrane GLUT4myc content above the levels seen in non-DNP-treated AMPKα-deficient cells (Fig. 5C). Although we did not measure the effect of AICAR on membrane cholesterol in siScramble and siAMPKα cells, we did observe the same inability of AICAR to stimulate an increase in plasma membrane GLUT4myc or enhance the increase elicited by insulin in AMPKα-deficient cells (Fig. 5D). Note, in both experiments the siAMPK-deficient cells showed a global loss of plasma membrane GLUT4myc content; regardless, unlike the siScramble cells, DNP and AICAR did not induce a statistically significant increase in basal or insulin-stimulated plasma membrane GLUT4myc content.
Fig. 5.

AMPK knockdown abrogated DNP-induced membrane cholesterol lowering and increased basal- and insulin-stimulated plasma membrane GLUT4. Myotubes received transient transfections targeting the AMPK α1 and α2 catalytic subunits as described in Materials and Methods. Myotubes were then left untreated or treated with AICAR (1 mm, 45 min) or DNP (200 μm, 30 min). Total cell extracts were prepared from nontransfected control, siScramble-transfected (siScr), and siAMPKα-transfected myotubes. SDS-PAGE and immunoblot analyses were performed as described in Fig. 3 using anti-AMPK and antiactin antibodies (A). Membrane cholesterol content was determined as described in Fig. 4B. Basal and insulin-stimulated (100 nm, 20 min) plasma membrane GLUT4 contents (C and D) were determined in myotubes treated as described in Fig. 2. Values are means ± se of six to 11 independent experiments. *, P < 0.05 vs. siScr (or control-basal) groups; #, P < 0.05 vs. control-insulin groups. ns, Nonsignificant.
AICAR-mediated membrane cholesterol lowering corrects cortical F-actin loss and GLUT4 dysregulation in hyperinsulinemia-induced insulin-resistant L6 myotubes
A model whereby membrane cholesterol lowering enhances regulation of GLUT4 by insulin suggests that increases in membrane cholesterol may contribute to impaired insulin action. Interestingly, study has suggested the actin cytoskeleton, recognized to be essential in the regulation of GLUT4 by insulin, is intimately linked to cholesterol-enriched plasma membrane microdomains (2). In fact, a loss of cortical actin filaments has been suggested to contribute to impaired GLUT4 regulation in hyperinsulinemia-induced insulin-resistant L6 myotubes and isolated epitrochlearis skeletal muscle from obese 8-wk-old, hyperinsulinemic, insulin-resistant Zucker fatty (fa/fa) rats, yet whether increased membrane cholesterol represents a basis for this derangement is not known (22). To test this, we performed membrane cholesterol, cortical F-actin, and GLUT4 analyses using hyperinsulinemia-induced insulin-resistant L6 myotubes, a model system previously observed to have a loss in actin filaments and defective GLUT4 regulation by insulin (22). Figure 6A (compare bars 1 and 2) shows a small (14%), yet significant, increase in membrane cholesterol induced by hyperinsulinemia accompanying a 14% loss of cortical F-actin (Fig. 6B, compare bars 1 and 2). Consistent with a beneficial effect of AMPK activation on insulin responsiveness, AICAR treatment prevented the hyperinsulinemia-induced increase in membrane cholesterol (Fig. 6A; compare bars 2 and 3) and cortical F-actin loss (Fig. 6B; compare bars 2 and 3). These AMPK-induced membrane/cytoskeletal improvements restored regulation of GLUT4 by insulin (Fig. 6C; compare bars 4 and 6). Note that the AICAR-stimulated gain in plasma membrane GLUT4 was still observed in cells exposed to hyperinsulinemia. Importantly, the AICAR treatment protected against the hyperinsulinemia-induced loss of fold insulin stimulation (see Fig. 6C, inset).
Fig. 6.

AMPK activation protects against hyperinsulinemia-induced increase in membrane cholesterol, F-actin loss, and GLUT4 dysregulation. Myotubes were left untreated or treated with AICAR (1 mm, 45 min) in the absence or presence of hyperinsulinemia (5 nm, 12 h). Membrane cholesterol content was determined as described in Fig. 4A. Cortical F-actin immunofluorescence was determined by fixing and permeabilizing cells as described in Materials and Methods. The samples were then labeled with anti-F-actin antibody, washed, and incubated with an infrared-conjugated secondary antibody. Immunofluorescent intensity was normalized to intensity from Syto60 and quantified with the Odyssey system (B). Basal and insulin-stimulated (100 nm, 20 min) plasma membrane GLUT4 contents (C) were determined in myotubes treated as described in Fig. 2. Values are means ± se of four to eight independent experiments. *, P < 0.05 vs. control (or control-basal) groups; #, P < 0.05 vs. control-insulin groups. Fold insulin stimulation for each treatment condition are presented in panel C inset. Ins., Insulin.
Skeletal muscle from insulin-resistant animals display an increase in membrane cholesterol
Although it is difficult to prove that accumulation of membrane cholesterol plays a causal role in F-actin loss and insulin resistance, results from several studies suggest that these derangements are uniformly present in skeletal muscle from insulin-resistant mice, rats, swine, and humans (7, 22). As a start to testing the causality, we examined whether these in vivo defects could be corrected by cholesterol lowering. As we previously reported (22), the epitrochlearis muscles of obese rats showed lower cortical F-actin structure compared with lean rats (Fig. 7A). Similar results were seen in the soleus muscle in these same rats (Fig. 7B, bar 1). These same soleus muscles from the obese rats had a 37% higher level of membrane cholesterol compared with lean controls (Fig. 7B, bar 2). Insulin-stimulated 2-deoxy-d-glucose (2-DG) transport measured in soleus muscle was characteristically lower in obese than lean muscle (Fig. 7C; compare bars 2 and 4). When insulin-resistant muscles were exposed to 2.5 mm of the cholesterol-lowering agent methyl-β-cyclodextrin (βCD) and then treated with insulin, 2-DG transport in the obese group was restored to levels that were equal to those achieved by the lean group (Fig. 7C; compare bars 4 and 6). Importantly, treatment of soleus muscle obtained from the obese group with βCD resulted in a gain in F-actin signal intensity (Fig. 7D). Because muscle extracellular [14C]mannitol space was not affected, this βCD-induced membrane cholesterol normalization did not compromise membrane integrity, results consistent with use of this low-dose βCD reduction of plasma membrane cholesterol in cell culture (8). Because removing cholesterol alone restored insulin-stimulated glucose transport, this strongly suggests that it is the elevated plasma membrane cholesterol impairing this process in muscles from obese rats. This causal relationship is further supported by recent data demonstrating that cholesterol loading of insulin-sensitive L6 myotubes caused cortical F-actin loss and GLUT4 dysfunction impairing insulin-stimulated glucose transport (7).
Fig. 7.

Cholesterol lowering normalizes insulin sensitivity in obese Zucker skeletal muscle. Rat epitrochlearis muscle (A) and soleus muscle (B, C, and D) from lean/obese Zucker rats were labeled with antibodies against F-actin, imaged by confocal microscopy, and digitally quantitated using MetaMorph software (A, B, and D). Remaining soleus muscle was fractionated for membrane cholesterol analyses (B) as described in Materials and Methods. Paired contralateral soleus muscles were subjected to basal and insulin-stimulated 2-DG uptake measurements (C) as described in Materials and Methods. Subgroups of these muscles were exposed to 2.5 mm βCD for 30 min before the 30-min insulin stimulation. Values are means ± se from five independent experiments. *, P < 0.05 vs. lean; #, P < 0.05 vs. lean (+insulin).
Discussion
This study examined the effect of increased AMPK activity on membrane cholesterol and GLUT4 regulation in L6 myotubes. Consistent with increased AMPK activity lowering membrane cholesterol, we found that both AICAR and DNP lowered membrane cholesterol. Moreover, the effect of these agents on enhancing the insulin-stimulated increase in plasma membrane GLUT4myc was eliminated by replenishing the reduced membrane cholesterol back to levels seen in control cells. Intriguingly, this did not suppress AICAR- or DNP-stimulated GLUT4 translocation; whereas siAMPK knockdown did, suggesting that increased AMPK activity regulates basal and insulin-stimulated GLUT4 by divergent mechanisms. Although in the present study we attempted to delineate this further (as we provide expanded information on below), an important preliminary question we asked was whether excess membrane cholesterol could represent an unappreciated aspect of insulin resistance and whether AMPK stimulation could counter membrane cholesterol toxicity. In this regard, this report offers several novel observations that extend our understanding of mechanisms of insulin resistance, in particular those pertaining to cytoskeletal-based mechanisms (7, 21–22, 29). First, we observed a hyperinsulinemia-induced decrease in cortical F-actin that is accompanied by an increase in membrane cholesterol. Second, increased AMPK activity lowered the insulin-induced elevation in membrane cholesterol to levels observed in control, insulin-sensitive cells. Third, this membrane cholesterol normalization restored cortical F-actin structure and fully restored insulin-stimulated GLUT4 regulation. Finally, testing whether these cell culture-based findings translate to the whole animal revealed strikingly similar and correctable membrane/cytoskeletal abnormalities in isolated skeletal muscle, a tissue responsible for approximately 80% of postprandial glucose disposal (30) and regarded as a major peripheral site of insulin resistance in type 2 diabetes (31).
We were surprised that the AICAR- and DNP-stimulated GLUT4 translocation was independent of membrane cholesterol lowering. For example, as we depict in Supplemental Fig. 2A, if AMPK activity regulates basal GLUT4 translocation by a cholesterol-independent mechanism, whereas AMPK enhances insulin-stimulated GLUT4 translocation via lowering membrane cholesterol, a prediction would be lowering membrane cholesterol with βCD would only affect insulin-stimulated, not basal, GLUT4 translocation. Contrary to this prediction, we found that βCD increased both basal and insulin-stimulated plasma membrane GLUT4myc content in L6 myotubes (see Supplemental Fig. 2B). One possible explanation for this observation could be that the βCD-induced 34% loss of membrane cholesterol (see Supplemental Fig. 2B, inset), which was more than that induced by AMPK activation (i.e. 19.8% and 24.1% for AICAR and DNP, respectively, see Fig. 4A), impaired the endocytic retrieval of cell surface GLUT4, as we and others have found occurs in 3T3-L1 adipocytes with greater (≥50%) reduction of membrane cholesterol (8, 32). Interestingly, studies have demonstrated that GLUT4 translocation in L6 myotubes is primarily reliant on regulated endocytosis, as opposed to the reliance of regulated exocytosis in 3T3-L1 adipocytes (33). In fact, characterization of GLUT4 trafficking kinetics in L6 myotubes stimulated with insulin, DNP, and a more direct AMPK activator, A-769662, suggest that enhanced surface levels of GLUT4 result in large part by inhibiting endocytosis (28, 34). Perhaps the AMPK-stimulated or βCD-induced decrease in membrane cholesterol suppresses endocytic retrieval of cell surface GLUT4. It will be of interest to test whether membrane cholesterol regulation by AMPK maintains and enhances insulin-stimulated cell surface GLUT4 levels by inhibiting endocytosis.
Another possible explanation could be that βCD and/or βCD:Chol may have an off-target effect on AMPK activity. For example, if βCD increased AMPK activity, then a predicted outcome would be a gain in both basal and insulin-stimulated plasma membrane GLUT4myc content with the use of βCD and βCD:Chol. However, we did not detect an increase in AMPK Thr172 phosphorylation with either βCD or βCD:Chol (see Supplemental Fig. 2C). In this context, the specific inhibition of enhanced insulin-stimulated, not basal, plasma membrane GLUT4myc content with βCD:Chol seems to implicate membrane cholesterol lowering as a mechanism by which AMPK enhances insulin action, but not basal GLUT4 regulation. Studies are currently testing the idea that a divergent AMPK-mediated, cholesterol-independent pathway (e.g. AS160 and/or TBC1D1) can regulate basal plasma membrane GLUT4 levels. Although we have considered employing statins to inhibit cholesterol synthesis to avoid the complexities of βCD, reports showing increased AMPK activity in cells treated with statins also render their use as a tool in testing this model ineffective (35, 36). With regard to a role of AS160, our studies failed to detect increased AS160 phosphorylation in cell lysates from AICAR- or DNP-treated cells. The basis for this is unclear, yet could reflect site-specific phosphorylation of AS160 or its homolog TBC1D1 that was not detected by the phospho-Akt substrate antibody used in this study.
Regardless of whether or not divergent pathways mediate the action of AMPK on basal and insulin-stimulated GLUT4, our data suggest that membrane cholesterol regulation is a novel mechanism of AMPK action and is directly linked to GLUT4 trafficking. Whether membrane cholesterol toxicity is a component of insulin resistance certainly requires further testing; however, this study found excess membrane cholesterol in two well-described in vitro and in vivo models of insulin resistance. In addition, membrane cholesterol excess/F-actin loss has recently been suggested to contribute to palmitate-induced insulin resistance in L6 myotubes and in skeletal muscle from high-fat-fed C57Bl/6J mice (7). Moreover, muscle biopsies from individuals across a range of insulin sensitivities revealed an inverse correlation between membrane cholesterol and glucose disposal (7). This causal relationship is further supported by data demonstrating that cholesterol loading insulin-sensitive L6 myotubes caused cortical F-actin loss, GLUT4 dysfunction, and subsequent impairment of insulin-stimulated glucose transport (7).
Mechanistically, increased hexosamine biosynthesis pathway (HBP) activity has been implicated in mediating the insulin- and palmitate-induced increase in membrane cholesterol via engagement of a cholesterolgenic program (7, 16, 21). In line with increased HBP activity transcriptionally provoking a membrane cholesterol-based insulin-resistant state, we found that HBP inhibition attenuated the expression of genes involved in cholesterol synthesis (e.g. Hmgcr) and prevented membrane cholesterol accumulation, F-actin loss, and GLUT4/glucose transport dysfunction (7, 21). These data support the concept that the diabetic milieu known to accelerate diabetes progression is associated with aberrant cholesterol synthesis. The resultant gain in skeletal muscle membrane cholesterol compromises cortical F-actin structure that is essential for insulin-regulated GLUT4 translocation and glucose transport. Data presented herein further suggest that increased AMPK activity counters membrane cholesterol toxicity. We predict that the loss of membrane cholesterol seen after an acute exposure of the myotubes to AICAR or DNP likely results from AMPK-mediated inhibition of HMGR activity, not suppression of SREBP-transcriptional events. However, it is possible that chronic AMPK stimulation in vivo could contribute to beneficial membrane cholesterol regulation via suppression of the activities of both HMGR and SREBP. Whether suppression of HMGR and/or SREBP activities accounts for the AMPK-induced lowering of membrane cholesterol requires further mechanistic dissection. Furthermore, in the context of contraction-induced glucose transport, where AMPK is involved in 30–40% of the effect (37), it will be of interest to explore whether changes in skeletal muscle membrane cholesterol account for the well-established increase in skeletal muscle insulin sensitivity observed after exercise (38).
It is possible that the F-actin changes are localized in cholesterol-enriched caveolae microdomain membrane regions. In vitro and in vivo imaging analyses from this study seem to intriguingly support the observed reciprocal changes in membrane cholesterol and F-actin. Notably, F-actin labeling has been documented in electron micrographs to be localized in caveolae regions (39). Although caveolae have been postulated to contribute to many functions in insulin and GLUT4 action through the years (2), these findings must be cautiously interpreted. Concerns regarding the study of caveolae are associated with each of the numerous strategic approaches used to study these structures. In spite of these caveats, fluorescence confocal labeling of caveolae and cortical F-actin has revealed actin filaments emanating from caveolae microdomains (40). Moreover, quantitative electron microscopy and freeze-fracture analyses have revealed that cytoskeletal components, including actin, are highly enriched in the membrane area underlying the neck part of caveolae (41). Together, these findings suggest a critical role for caveolae in the functionality of cortical F-actin organization. Given the unequivocal importance of cortical F-actin in insulin-regulated GLUT4 translocation, these findings also emphasize the importance of caveolae in GLUT4 regulation. Of interest to our understanding of caveolae-associated actin regulation are new electron microscopic data showing high concentrations of phosphatidylinositol 4,5 bisphosphate (PIP2) at the rim of caveolae (42). This localization of PIP2 is consistent with its regulation of the cytoskeleton where this lipid's availability is recognized to modulate membrane/cytoskeleton interaction, the stability of cortical F-actin, and the turnover of cytoplasmic stress fibers (43). Interestingly, reduced plasma membrane PIP2 and cortical F-actin structure are observed in hyperinsulinemia-induced insulin-resistant 3T3-L1 adipocytes and L6 myotubes. In these cell model systems, insulin-stimulated GLUT4 translocation is impaired but can be corrected with exogenous PIP2 addition to the plasma membrane that mediates a restoration of cortical F-actin structure (22, 29).
Although speculative, we view findings from the present study as a possible indication that increased AMPK activity is advantageous in reversing membrane/cytoskeletal defects that negatively impact skeletal muscle insulin-stimulated GLUT4 translocation. Furthermore, these data suggest that the membrane/cytoskeletal defects are induced before those in insulin signaling. Supporting this view are studies using various cell model systems of insulin resistance that demonstrate insulin signaling to Akt2/AS160 is not impaired (22, 29, 44–46). Collectively these data suggest that some insulin-resistant states, perhaps early noninflammatory-associated peripheral insulin resistance may result from a membrane/cytoskeletal-based mechanical defect in GLUT4 storage vesicle arrival, tethering, docking, and/or fusion with the plasma membrane. Interestingly, cholesterol has also been suggested to impair glucose-stimulated insulin secretion by acting through PIP2 and cortical F-actin (47). Therefore, similar mechanisms may lead to both impaired insulin action and impaired insulin secretion in the setting of metabolic syndrome.
Supplementary Material
Acknowledgments
We thank Drs. Amira Klip (The Hospital for Sick Children, Toronto, Ontario, Canada) and Steve Waters (Entelos Inc., Foster City, CA) for generously providing us with the GLUT4myc expressing L6 myotubes and L6 myotube protocols.
This work was supported by National Institutes of Health Grants AT001846 (to J.S.E.), DK082773 (to J.S.E.), and DK082773-S1 (to J.S.E.), and Indiana University Diabetes and Obesity Research Training Program DeVault Fellowships (to K.M.H. and N.J.H.) and Grant T32-DK064466 (to N.J.H.).
Disclosure Summary: The authors have nothing to disclose.
Footnotes
- ACC
- Acetylcoenzyme A carboxylase
- AICAR
- 5-aminoimidazole-4-carboxamide-1-β-d-ribonucleoside
- AMPK
- AMP-activated protein kinase
- βCD
- methyl-β-cyclodextrin
- βCD:Chol
- βCD preloaded with cholesterol
- 2-DG
- 2-deoxy-d-glucose
- DNP
- 2,4-dinitrophenol
- F-actin
- filamentous actin
- FBS
- fetal bovine serum
- GLUT
- glucose transporter
- HBP
- hexosamine biosynthesis pathway
- HMGR
- 3-hydroxy-3-methylglutaryl coenzyme A reductase
- PIP2
- phosphatidylinositol 4,5 bisphosphate
- siRNA
- small interfering RNA
- SREBP
- sterol-regulatory element-binding proteins.
References
- 1. Witczak CA, Sharoff CG, Goodyear LJ. 2008. AMP-activated protein kinase in skeletal muscle: from structure and localization to its role as a master regulator of cellular metabolism. Cell Mol Life Sci 65:3737–3755 [DOI] [PMC free article] [PubMed] [Google Scholar]
- 2. Hoffman NJ, Elmendorf JS. 2011. Signaling, cytoskeletal and membrane mechanisms regulating GLUT4 exocytosis. Trends Endocrinol Metab 22:110–116 [DOI] [PMC free article] [PubMed] [Google Scholar]
- 3. Jessen N, An D, Lihn AS, Nygren J, Hirshman MF, Thorell A, Goodyear LJ. 2011. Exercise increases TBC1D1 phosphorylation in human skeletal muscle. Am J Physiol Endocrinol Metab 301:E164–E171 [DOI] [PMC free article] [PubMed] [Google Scholar]
- 4. Taylor EB, An D, Kramer HF, Yu H, Fujii NL, Roeckl KS, Bowles N, Hirshman MF, Xie J, Feener EP, Goodyear LJ. 2008. Discovery of TBC1D1 as an insulin-, AICAR-, and contraction-stimulated signaling nexus in mouse skeletal muscle. J Biol Chem 283:9787–9796 [DOI] [PMC free article] [PubMed] [Google Scholar]
- 5. Treebak JT, Taylor EB, Witczak CA, An D, Toyoda T, Koh HJ, Xie J, Feener EP, Wojtaszewski JF, Hirshman MF, Goodyear LJ. 2010. Identification of a novel phosphorylation site on TBC1D4 regulated by AMP-activated protein kinase in skeletal muscle. Am J Physiol Cell Physiol 298:C377–C385 [DOI] [PMC free article] [PubMed] [Google Scholar]
- 6. Qatanani M, Lazar MA. 2007. Mechanisms of obesity-associated insulin resistance: many choices on the menu. Genes Dev 21:1443–1455 [DOI] [PubMed] [Google Scholar]
- 7. Habegger KM, Penque BA, Sealls W, Tackett L, Bell LN, Blue EK, Gallagher PJ, Sturek M, Alloosh MA, Steinberg HO, Considine RV, Elmendorf JS. 2012. Fat-induced membrane cholesterol accrual provokes cortical filamentous actin destabilisation and glucose transport dysfunction in skeletal muscle. Diabetologia 55:457–467 [DOI] [PMC free article] [PubMed] [Google Scholar]
- 8. Liu P, Leffler BJ, Weeks LK, Chen G, Bouchard CM, Strawbridge AB, Elmendorf JS. 2004. Sphingomyelinase activates GLUT4 translocation via a cholesterol-dependent mechanism. Am J Physiol Cell Physiol 286:C317–C329 [DOI] [PubMed] [Google Scholar]
- 9. Chen G, Liu P, Pattar GR, Tackett L, Bhonagiri P, Strawbridge AB, Elmendorf JS. 2006. Chromium activates glucose transporter 4 trafficking and enhances insulin-stimulated glucose transport in 3T3–L1 adipocytes via a cholesterol-dependent mechanism. Mol Endocrinol 20:857–870 [DOI] [PubMed] [Google Scholar]
- 10. Pattar GR, Tackett L, Liu P, Elmendorf JS. 2006. Chromium picolinate positively influences the glucose transporter system via affecting cholesterol homeostasis in adipocytes cultured under hyperglycemic diabetic conditions. Mutat Res 610:93–100 [DOI] [PMC free article] [PubMed] [Google Scholar]
- 11. Czech MP. 1980. Insulin action and the regulation of hexose transport. Diabetes 29:399–409 [DOI] [PubMed] [Google Scholar]
- 12. Pilch PF, Thompson PA, Czech MP. 1980. Coordinate modulation of D-glucose transport activity and bilayer fluidity in plasma membranes derived from control and insulin-treated adipocytes. Proc Natl Acad Sci USA 77:915–918 [DOI] [PMC free article] [PubMed] [Google Scholar]
- 13. Muller S, Denet S, Candiloros H, Barrois R, Wiernsperger N, Donner M, Drouin P. 1997. Action of metformin on erythrocyte membrane fluidity in vitro and in vivo. Eur J Pharmacol 337:103–110 [DOI] [PubMed] [Google Scholar]
- 14. Wiernsperger NF. 1999. Membrane physiology as a basis for the cellular effects of metformin in insulin resistance and diabetes. Diabetes Metab 25:110–127 [PubMed] [Google Scholar]
- 15. Zhou G, Myers R, Li Y, Chen Y, Shen X, Fenyk-Melody J, Wu M, Ventre J, Doebber T, Fujii N, Musi N, Hirshman MF, Goodyear LJ, Moller DE. 2001. Role of AMP-activated protein kinase in mechanism of metformin action. J Clin Invest 108:1167–1174 [DOI] [PMC free article] [PubMed] [Google Scholar]
- 16. Sealls W, Penque BA, Elmendorf JS. 2011. Evidence that chromium modulates cellular cholesterol homeostasis and ABCA1 functionality impaired by hyperinsulinemia–brief report. Arterioscler Thromb Vasc Biol 31:1139–1140 [DOI] [PMC free article] [PubMed] [Google Scholar]
- 17. Thirunavukkarasu M, Penumathsa SV, Juhasz B, Zhan L, Cordis G, Altaf E, Bagchi M, Bagchi D, Maulik N. 2006. Niacin-bound chromium enhances myocardial protection from ischemia-reperfusion injury. Am J Physiol Heart Circ Physiol 291:H820–H826 [DOI] [PubMed] [Google Scholar]
- 18. Zhao P, Wang J, Ma H, Xiao Y, He L, Tong C, Wang Z, Zheng Q, Dolence EK, Nair S, Ren J, Li J. 2009. A newly synthetic chromium complex-Chromium (d-phenylalanine)(3) activates AMP-activated protein kinase and stimulates glucose transport. Biochem Pharmacol 77:1002–1010 [DOI] [PubMed] [Google Scholar]
- 19. Yang J, Maika S, Craddock L, King JA, Liu ZM. 2008. Chronic activation of AMP-activated protein kinase-alpha1 in liver leads to decreased adiposity in mice. Biochem Biophys Res Commun 370:248–253 [DOI] [PubMed] [Google Scholar]
- 20. Tang JJ, Li JG, Qi W, Qiu WW, Li PS, Li BL, Song BL. 2011. Inhibition of SREBP by a small molecule, betulin, improves hyperlipidemia and insulin resistance and reduces atherosclerotic plaques. Cell Metab 13:44–56 [DOI] [PubMed] [Google Scholar]
- 21. Bhonagiri P, Pattar GR, Habegger KM, McCarthy AM, Tackett L, Elmendorf JS. 2011. Evidence coupling increased hexosamine biosynthesis pathway activity to membrane cholesterol toxicity and cortical filamentous actin derangement contributing to cellular insulin resistance. Endocrinology 152:3373–3384 [DOI] [PMC free article] [PubMed] [Google Scholar]
- 22. McCarthy AM, Spisak KO, Brozinick JT, Elmendorf JS. 2006. Loss of cortical actin filaments in insulin-resistant skeletal muscle cells impairs GLUT4 vesicle trafficking and glucose transport. Am J Physiol Cell Physiol 291:C860–C868 [DOI] [PMC free article] [PubMed] [Google Scholar]
- 23. Brozinick JT, Jr, Hawkins ED, Strawbridge AB, Elmendorf JS. 2004. Disruption of cortical actin in skeletal muscle demonstrates an essential role of the cytoskeleton in glucose transporter 4 translocation in insulin-sensitive tissues. J Biol Chem 279:40699–40706 [DOI] [PMC free article] [PubMed] [Google Scholar]
- 24. Khayat ZA, Tsakiridis T, Ueyama A, Somwar R, Ebina Y, Klip A. 1998. Rapid stimulation of glucose transport by mitochondrial uncoupling depends in part on cytosolic Ca2+ and cPKC. Am J Physiol 275:C1487–C1497 [DOI] [PubMed] [Google Scholar]
- 25. Hawley SA, Davison M, Woods A, Davies SP, Beri RK, Carling D, Hardie DG. 1996. Characterization of the AMP-activated protein kinase kinase from rat liver and identification of threonine 172 as the major site at which it phosphorylates AMP-activated protein kinase. J Biol Chem 271:27879–27887 [DOI] [PubMed] [Google Scholar]
- 26. Kishi K, Muromoto N, Nakaya Y, Miyata I, Hagi A, Hayashi H, Ebina Y. 1998. Bradykinin directly triggers GLUT4 translocation via an insulin-independent pathway [Erratum (1998) 47:1170]. Diabetes 47:550–558 [DOI] [PubMed] [Google Scholar]
- 27. Wang Q, Khayat Z, Kishi K, Ebina Y, Klip A. 1998. GLUT4 translocation by insulin in intact muscle cells: detection by a fast and quantitative assay. FEBS Lett 427:193–197 [DOI] [PubMed] [Google Scholar]
- 28. Fazakerley DJ, Holman GD, Marley A, James DE, Stöckli J, Coster AC. 2010. Kinetic evidence for unique regulation of GLUT4 trafficking by insulin and AMP-activated protein kinase activators in L6 myotubes. J Biol Chem 285:1653–1660 [DOI] [PMC free article] [PubMed] [Google Scholar]
- 29. Chen G, Raman P, Bhonagiri P, Strawbridge AB, Pattar GR, Elmendorf JS. 2004. Protective effect of phosphatidylinositol 4,5-bisphosphate against cortical filamentous actin loss and insulin resistance induced by sustained exposure of 3T3–L1 adipocytes to insulin. J Biol Chem 279:39705–39709 [DOI] [PMC free article] [PubMed] [Google Scholar]
- 30. Ferrannini E, Smith JD, Cobelli C, Toffolo G, Pilo A, DeFronzo RA. 1985. Effect of insulin on the distribution and disposition of glucose in man. J Clin Invest 76:357–364 [DOI] [PMC free article] [PubMed] [Google Scholar]
- 31. DeFronzo RA, Gunnarsson R, Björkman O, Olsson M, Wahren J. 1985. Effects of insulin on peripheral and splanchnic glucose metabolism in noninsulin-dependent (type II) diabetes mellitus. J Clin Invest 76:149–155 [DOI] [PMC free article] [PubMed] [Google Scholar]
- 32. Blot V, McGraw TE. 2006. GLUT4 is internalized by a cholesterol-dependent nystatin-sensitive mechanism inhibited by insulin. EMBO J 25:5648–5658 [DOI] [PMC free article] [PubMed] [Google Scholar]
- 33. Stöckli J, Fazakerley DJ, Coster AC, Holman GD, James DE. 2010. Muscling in on GLUT4 kinetics. Commun Integr Biol 3:260–262 [DOI] [PMC free article] [PubMed] [Google Scholar]
- 34. Antonescu CN, Diaz M, Femia G, Planas JV, Klip A. 2008. Clathrin-dependent and independent endocytosis of glucose transporter 4 (GLUT4) in myoblasts: regulation by mitochondrial uncoupling. Traffic 9:1173–1190 [DOI] [PubMed] [Google Scholar]
- 35. Sun W, Lee TS, Zhu M, Gu C, Wang Y, Zhu Y, Shyy JY. 2006. Statins activate AMP-activated protein kinase in vitro and in vivo. Circulation 114:2655–2662 [DOI] [PubMed] [Google Scholar]
- 36. Wong AK, Howie J, Petrie JR, Lang CC. 2009. AMP-activated protein kinase pathway: a potential therapeutic target in cardiometabolic disease. Clin Sci (Lond) 116:607–620 [DOI] [PMC free article] [PubMed] [Google Scholar]
- 37. Mu J, Brozinick JT, Jr, Valladares O, Bucan M, Birnbaum MJ. 2001. A role for AMP-activated protein kinase in contraction- and hypoxia-regulated glucose transport in skeletal muscle. Mol Cell 7:1085–1094 [DOI] [PubMed] [Google Scholar]
- 38. Fujii N, Jessen N, Goodyear LJ. 2006. AMP-activated protein kinase and the regulation of glucose transport. Am J Physiol Endocrinol Metab 291:E867–E877 [DOI] [PubMed] [Google Scholar]
- 39. Parton RG, Molero JC, Floetenmeyer M, Green KM, James DE. 2002. Characterization of a distinct plasma membrane macrodomain in differentiated adipocytes. J Biol Chem 277:46769–46778 [DOI] [PubMed] [Google Scholar]
- 40. Kanzaki M, Pessin JE. 2002. Caveolin-associated filamentous actin (Cav-actin) defines a novel F-actin structure in adipocytes. J Biol Chem 277:25867–25869 [DOI] [PubMed] [Google Scholar]
- 41. Foti M, Porcheron G, Fournier M, Maeder C, Carpentier JL. 2007. The neck of caveolae is a distinct plasma membrane subdomain that concentrates insulin receptors in 3T3–L1 adipocytes. Proc Natl Acad Sci USA 104:1242–1247 [DOI] [PMC free article] [PubMed] [Google Scholar]
- 42. Fujita A, Cheng J, Fujimoto T. 2010. Quantitative electron microscopy for the nanoscale analysis of membrane lipid distribution. Nat Protoc 5:661–669 [DOI] [PubMed] [Google Scholar]
- 43. Kwik J, Boyle S, Fooksman D, Margolis L, Sheetz MP, Edidin M. 2003. Membrane cholesterol, lateral mobility, and the phosphatidylinositol 4,5-bisphosphate-dependent organization of cell actin. Proc Natl Acad Sci USA 100:13964–13969 [DOI] [PMC free article] [PubMed] [Google Scholar]
- 44. Xiong W, Jordens I, Gonzalez E, McGraw TE. 2010. GLUT4 is sorted to vesicles whose accumulation beneath and insertion into the plasma membrane are differentially regulated by insulin and selectively affected by insulin resistance. Mol Biol Cell 21:1375–1386 [DOI] [PMC free article] [PubMed] [Google Scholar]
- 45. Hoehn KL, Hohnen-Behrens C, Cederberg A, Wu LE, Turner N, Yuasa T, Ebina Y, James DE. 2008. IRS1-independent defects define major nodes of insulin resistance. Cell Metab 7:421–433 [DOI] [PMC free article] [PubMed] [Google Scholar]
- 46. Strawbridge AB, Elmendorf JS. 2005. Phosphatidylinositol 4,5-bisphosphate reverses endothelin-1-induced insulin resistance via an actin-dependent mechanism. Diabetes 54:1698–1705 [DOI] [PMC free article] [PubMed] [Google Scholar]
- 47. Hao M, Bogan JS. 2009. Cholesterol regulates glucose-stimulated insulin secretion through phosphatidylinositol 4,5-bisphosphate. J Biol Chem 284:29489–29498 [DOI] [PMC free article] [PubMed] [Google Scholar]
Associated Data
This section collects any data citations, data availability statements, or supplementary materials included in this article.